1
MECH6010 Service Behaviour
of Materials
Teachers:
Dr. Y. Chen (yuechen@hku.hk)
Dr. K.W. Kwan (kkwkwan@connect.hku.hk)
2
Topics covered in this course
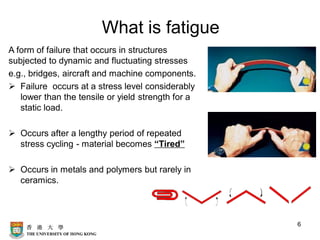
• Fatigue
• Corrosion
• Engineering plastics
• Composites
• Creep
• Fracture
References:
[1] M.F. Ashby and D.R.H. Jones, Engineering Materials 1: An
Introduction to Their Properties and Applications, Pergmon Press
[2] W.D. Callister, Materials Science and Engineering: An Introduction,
John Wiley & Sons, INC
Classification of Materials
Metals
• good conductors of
electricity and heat
• susceptible to
corrosion
• strong, and
deformable
Ceramics
• thermally and
electrically insulating
• resistant to high
temperatures and
harsh environments
• hard, but brittle
Composites
• consist of more than
one material type
• designed to display
a combination of
properties of each
component
surfboards
Polymers
• very large molecules
• low density, low weight
• maybe extremely
flexible
Classification of Materials
5
Service Behaviour of Materials
Fatigue
What is fatigue
A form of failure that occurs in structures
subjected to dynamic and fluctuating stresses
e.g., bridges, aircraft and machine components.
➢ Failure occurs at a stress level considerably
lower than the tensile or yield strength for a
static load.
➢ Occurs after a lengthy period of repeated
stress cycling - material becomes “Tired”
➢ Occurs in metals and polymers but rarely in
ceramics.
6
Why is fatigue important?
➢ A bar of steel
repeatedly loaded and
unloaded at 85% of it’s
yield strength will
ultimately fail in fatigue if
it is loaded through
enough cycles.
➢Steel ordinarily
elongates approximately
30% in a typical tensile
test. Almost no
elongation is evident in
the appearance of
fatigue fractures.
7
8
Testing methods
Testing methods: many kinds such as tension-compression, rotate-
bend, and torsion.
9
Mean stress:
Range of stress:
Stress amplitude:
Stress ratio:
10
Types of fatigue behavior
• Fatigue limit, Sfat:
--no fatigue if S < Sfat
Sfat
case for
steel (typ.)
N = Cycles to failure
103
105
107
109
unsafe
safe
S
=
stress
amplitude
• For some materials,
there is no fatigue
limit!
case for
Al (typ.)
N = Cycles to failure
103
105
107
109
unsafe
safe
S
=
stress
amplitude
11
Constant amplitude cyclic stress histories
Fully reversed
m = 0, R = -1
Pulsating
m = a R = 0
Cyclic
m > 0 R > 0
12
Mean stress effect
m< 0
m= 0
m> 0
No. of cycles, logN
Stress
amplitude,
logS
time
m< 0
m= 0
m> 0
Stress
0
The tensile mean stress is
in general detrimental
while the compressive
mean stress is beneficial
or has negligible effect
on the fatigue durability.
Most of the S – N data
used in analyses was
produced under zero
mean stress (R = -1).
13
Categories of fatigue
14
Laws of fatigue of uncracked components
High cycle fatigue: neither σmax nor |σmin | is greater than σy. Experimental
law to predict the number of cycles to failure Nf (under σm = 0).
σr Nf
a = C1
where a is a constant (between 1/8 to 1/15 for most of materials) and C1 is
also a constant (stress unit).
Basquin’s Law
Log σr
15
Low cycle fatigue: σmax or |σmin | are greater than σy.
Experimental law to predict the number of cycles to
failure Nf:
Δɛpl Nf
b = C2
where b is a constant (0.5 to 0.6) and C2
is also a constant.
Coffin-Manson’s Law
16
Crack initiation and propagation of
uncracked component
Three steps:
(1) Crack initiation at surface (stress concentration sites such as
surface scratches and dents). Cracks form at the surface, after ~5% of
fatigue life
(2) Crack propagation
(3) Final failure
Propagation is first crystallographic
(stage I growth) and then perpendicular
to stress axis until failure (stage II
growth)
17
The region of a fracture surface that formed during the crack propagation step
may be characterized by two types of markings termed beachmarks (sometimes
also called “clamshell marks”) and striations.
Both of these features appear as concentric ridges that expand away from the
crack initiation site(s), frequently in a circular or semicircular pattern. Each
beachmark band represents a period of time over which crack growth occurred.
Beachmarks are of macroscopic dimensions and may be observed with unaided
eyes.
Region of rapid
failure
Region of slow crack propagation
Fatigue fractograph
18
Initiation
site
Fatigue
cracking Final fracture
19
On the other hand, fatigue striations are microscopic in size and subject to
observation with the electron microscope (either TEM or SEM).
The presence of beachmarks and/or striations on a fracture surface
confirms that the cause of failure was fatigue. Nevertheless, the absence
of either or both does not exclude fatigue as the cause of failure.
20
Fatigue of pre-cracked components
( )
m
da
A K
dN
=  Stress intensity factor (ΔK)
21
Al alloys for aerospace
22
( )
m
da
A K
dN
= 
23
Case study
A large steel sheet is exposed to tensile and compressive stresses of
magnitudes 100 MPa and 50 MPa, respectively. Prior to testing, it has been
determined that the length of the largest surface crack is 2.0 mm. Estimate
the fatigue life of this steel sheet if its plane strain fracture toughness is 25
MPa m1/2 and the constant m and A are 3.0 and 1.0*10-12 .
( )
m
da
A K
dN
= 
24
2
2
1
1 25 MPa m
0.02m
100 MPa
IC
IC c c
K
K a a
 
 

 
=  =  
 
 
= =
 
 
 
Critical crack length:
( ) ( )
( )
( ) ( )
( )
0 0
0
0
0
max
3 3/2
3/2
max
1/2
3 3
3/2 3/2
0
max max
6
12 3/2 3
1
0
1 1
1 2 1 1
( 2)
2 1 1
5.49 10 cycles
1 10 100 0.002 0.02
f c c
c
c
N a a
f m m
a a
a
a
a
a
c
da da
N dN
A
A K a
da
a
A
a
a a
A A
 
 
   

−
−
= = =
 −
=
 
= − = −
 
 
 
 
− = 
 
  
  

Case study
Fatigue mechanisms
Schematic of slip under
(a) monotonic load and
(b) cyclic load
25
The fatigue process
Crack initiation at the sites of stress concentration (microcracks,
scratches, indents, interior corners, etc.). Quality of surface is important.
Crack propagation
Stage I: initial slow propagation. Involves just a few grains.
Stage II: faster propagation perpendicular to the applied stress.
Ultimate failure
Crack eventually reaches critical dimension and propagates very rapidly.
The total number of cycles to failure is the sum of cycles at the first and
the second stages: Nf = Ni + Np.
Nf: number of cycles to failure
Ni: number of cycles for crack initiation
Np: number of cycles for crack propagation
26
Fatigue mechanisms
Stages I and II of fatigue crack
propagation in polycrystalline
metals.
i) Transgranular
ii) Intergranular
iii) Surface inclusion or pores
iv) Inclusions
v) Grain boundary voids
vi) Triple point grain boundary
intersections
Fatigue crack propagation mechanism
(stage II) by repetitive crack tip plastic
blunting and sharpening
27
28
Quality of the surface:
➢ Polish surface
➢ Introduce compressive stresses into surface layer
(to suppress surface cracks from growing).
Improving fatigue life
N = Cycles to failure
moderate tensile m
Larger tensile m
S
=
stress
amplitude
near zero or compressive m
29
Improving fatigue life
Impose compressive surface stresses
--Method 1: shot peening
put
surface
into
compression
shot
--Method 2: carburizing
C-rich gas
Optimize geometry:
avoid internal corners,
notches etc. (remove
stress concentrators)
bad
bad
better
better
30
Environmental effects
▪ Thermal fatigue: thermal cycling causes expansion and
contraction, hence thermal stress.
Solutions:
➢ change design
➢ use materials with low thermal expansion coefficients
▪ Corrosion fatigue: chemical reactions induce pits which act as
stress raisers. Corrosion also enhances crack propagation.
Solutions:
➢ decrease corrosiveness of medium
➢ add protective surface coating
➢ add residual compressive stresses

1. Fatigue.pdf

  • 1.
    1 MECH6010 Service Behaviour ofMaterials Teachers: Dr. Y. Chen (yuechen@hku.hk) Dr. K.W. Kwan (kkwkwan@connect.hku.hk)
  • 2.
    2 Topics covered inthis course • Fatigue • Corrosion • Engineering plastics • Composites • Creep • Fracture References: [1] M.F. Ashby and D.R.H. Jones, Engineering Materials 1: An Introduction to Their Properties and Applications, Pergmon Press [2] W.D. Callister, Materials Science and Engineering: An Introduction, John Wiley & Sons, INC
  • 3.
    Classification of Materials Metals •good conductors of electricity and heat • susceptible to corrosion • strong, and deformable Ceramics • thermally and electrically insulating • resistant to high temperatures and harsh environments • hard, but brittle
  • 4.
    Composites • consist ofmore than one material type • designed to display a combination of properties of each component surfboards Polymers • very large molecules • low density, low weight • maybe extremely flexible Classification of Materials
  • 5.
    5 Service Behaviour ofMaterials Fatigue
  • 6.
    What is fatigue Aform of failure that occurs in structures subjected to dynamic and fluctuating stresses e.g., bridges, aircraft and machine components. ➢ Failure occurs at a stress level considerably lower than the tensile or yield strength for a static load. ➢ Occurs after a lengthy period of repeated stress cycling - material becomes “Tired” ➢ Occurs in metals and polymers but rarely in ceramics. 6
  • 7.
    Why is fatigueimportant? ➢ A bar of steel repeatedly loaded and unloaded at 85% of it’s yield strength will ultimately fail in fatigue if it is loaded through enough cycles. ➢Steel ordinarily elongates approximately 30% in a typical tensile test. Almost no elongation is evident in the appearance of fatigue fractures. 7
  • 8.
    8 Testing methods Testing methods:many kinds such as tension-compression, rotate- bend, and torsion.
  • 9.
    9 Mean stress: Range ofstress: Stress amplitude: Stress ratio:
  • 10.
    10 Types of fatiguebehavior • Fatigue limit, Sfat: --no fatigue if S < Sfat Sfat case for steel (typ.) N = Cycles to failure 103 105 107 109 unsafe safe S = stress amplitude • For some materials, there is no fatigue limit! case for Al (typ.) N = Cycles to failure 103 105 107 109 unsafe safe S = stress amplitude
  • 11.
    11 Constant amplitude cyclicstress histories Fully reversed m = 0, R = -1 Pulsating m = a R = 0 Cyclic m > 0 R > 0
  • 12.
    12 Mean stress effect m<0 m= 0 m> 0 No. of cycles, logN Stress amplitude, logS time m< 0 m= 0 m> 0 Stress 0 The tensile mean stress is in general detrimental while the compressive mean stress is beneficial or has negligible effect on the fatigue durability. Most of the S – N data used in analyses was produced under zero mean stress (R = -1).
  • 13.
  • 14.
    14 Laws of fatigueof uncracked components High cycle fatigue: neither σmax nor |σmin | is greater than σy. Experimental law to predict the number of cycles to failure Nf (under σm = 0). σr Nf a = C1 where a is a constant (between 1/8 to 1/15 for most of materials) and C1 is also a constant (stress unit). Basquin’s Law Log σr
  • 15.
    15 Low cycle fatigue:σmax or |σmin | are greater than σy. Experimental law to predict the number of cycles to failure Nf: Δɛpl Nf b = C2 where b is a constant (0.5 to 0.6) and C2 is also a constant. Coffin-Manson’s Law
  • 16.
    16 Crack initiation andpropagation of uncracked component Three steps: (1) Crack initiation at surface (stress concentration sites such as surface scratches and dents). Cracks form at the surface, after ~5% of fatigue life (2) Crack propagation (3) Final failure Propagation is first crystallographic (stage I growth) and then perpendicular to stress axis until failure (stage II growth)
  • 17.
    17 The region ofa fracture surface that formed during the crack propagation step may be characterized by two types of markings termed beachmarks (sometimes also called “clamshell marks”) and striations. Both of these features appear as concentric ridges that expand away from the crack initiation site(s), frequently in a circular or semicircular pattern. Each beachmark band represents a period of time over which crack growth occurred. Beachmarks are of macroscopic dimensions and may be observed with unaided eyes. Region of rapid failure Region of slow crack propagation
  • 18.
  • 19.
    19 On the otherhand, fatigue striations are microscopic in size and subject to observation with the electron microscope (either TEM or SEM). The presence of beachmarks and/or striations on a fracture surface confirms that the cause of failure was fatigue. Nevertheless, the absence of either or both does not exclude fatigue as the cause of failure.
  • 20.
    20 Fatigue of pre-crackedcomponents ( ) m da A K dN =  Stress intensity factor (ΔK)
  • 21.
  • 22.
  • 23.
    23 Case study A largesteel sheet is exposed to tensile and compressive stresses of magnitudes 100 MPa and 50 MPa, respectively. Prior to testing, it has been determined that the length of the largest surface crack is 2.0 mm. Estimate the fatigue life of this steel sheet if its plane strain fracture toughness is 25 MPa m1/2 and the constant m and A are 3.0 and 1.0*10-12 . ( ) m da A K dN = 
  • 24.
    24 2 2 1 1 25 MPam 0.02m 100 MPa IC IC c c K K a a        =  =       = =       Critical crack length: ( ) ( ) ( ) ( ) ( ) ( ) 0 0 0 0 0 max 3 3/2 3/2 max 1/2 3 3 3/2 3/2 0 max max 6 12 3/2 3 1 0 1 1 1 2 1 1 ( 2) 2 1 1 5.49 10 cycles 1 10 100 0.002 0.02 f c c c c N a a f m m a a a a a a c da da N dN A A K a da a A a a a A A          − − = = =  − =   = − = −         − =           Case study
  • 25.
    Fatigue mechanisms Schematic ofslip under (a) monotonic load and (b) cyclic load 25
  • 26.
    The fatigue process Crackinitiation at the sites of stress concentration (microcracks, scratches, indents, interior corners, etc.). Quality of surface is important. Crack propagation Stage I: initial slow propagation. Involves just a few grains. Stage II: faster propagation perpendicular to the applied stress. Ultimate failure Crack eventually reaches critical dimension and propagates very rapidly. The total number of cycles to failure is the sum of cycles at the first and the second stages: Nf = Ni + Np. Nf: number of cycles to failure Ni: number of cycles for crack initiation Np: number of cycles for crack propagation 26
  • 27.
    Fatigue mechanisms Stages Iand II of fatigue crack propagation in polycrystalline metals. i) Transgranular ii) Intergranular iii) Surface inclusion or pores iv) Inclusions v) Grain boundary voids vi) Triple point grain boundary intersections Fatigue crack propagation mechanism (stage II) by repetitive crack tip plastic blunting and sharpening 27
  • 28.
    28 Quality of thesurface: ➢ Polish surface ➢ Introduce compressive stresses into surface layer (to suppress surface cracks from growing). Improving fatigue life N = Cycles to failure moderate tensile m Larger tensile m S = stress amplitude near zero or compressive m
  • 29.
    29 Improving fatigue life Imposecompressive surface stresses --Method 1: shot peening put surface into compression shot --Method 2: carburizing C-rich gas Optimize geometry: avoid internal corners, notches etc. (remove stress concentrators) bad bad better better
  • 30.
    30 Environmental effects ▪ Thermalfatigue: thermal cycling causes expansion and contraction, hence thermal stress. Solutions: ➢ change design ➢ use materials with low thermal expansion coefficients ▪ Corrosion fatigue: chemical reactions induce pits which act as stress raisers. Corrosion also enhances crack propagation. Solutions: ➢ decrease corrosiveness of medium ➢ add protective surface coating ➢ add residual compressive stresses