150425 Nepal Earth Quack Disaster
•Download as PPT, PDF•
3 likes•303 views

A magnitude 7.8 earthquake struck near Kathmandu, Nepal, killing over 2,300 people and injuring more than 5,000. The earthquake destroyed homes and buildings in Kathmandu and nearby areas. It also triggered avalanches on Mount Everest that killed at least 17 climbers. The earthquake was caused by the ongoing collision between the Indian and Eurasian tectonic plates, which is what generates earthquakes in this region of the Himalayas.

More Related Content
What's hot
What's hot (14)
Viewers also liked
Viewers also liked (9)
Similar to 150425 Nepal Earth Quack Disaster
Similar to 150425 Nepal Earth Quack Disaster (20)
Recently uploaded
Recently uploaded (20)
150425 Nepal Earth Quack Disaster
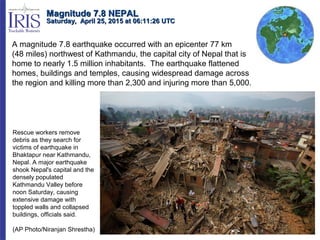
- 1. A magnitude 7.8 earthquake occurred with an epicenter 77 km (48 miles) northwest of Kathmandu, the capital city of Nepal that is home to nearly 1.5 million inhabitants. The earthquake flattened homes, buildings and temples, causing widespread damage across the region and killing more than 2,300 and injuring more than 5,000. Magnitude 7.8 NEPALMagnitude 7.8 NEPAL Saturday, April 25, 2015 at 06:11:26 UTCSaturday, April 25, 2015 at 06:11:26 UTC Rescue workers remove debris as they search for victims of earthquake in Bhaktapur near Kathmandu, Nepal. A major earthquake shook Nepal's capital and the densely populated Kathmandu Valley before noon Saturday, causing extensive damage with toppled walls and collapsed buildings, officials said. (AP Photo/Niranjan Shrestha)
- 2. The earthquake centered outside Kathmandu, the capital, was the worst to hit Nepal in over 80 years. It destroyed swaths of the oldest neighborhoods of Kathmandu and severely damaged three Unesco World Heritage sites. The earthquake was strong enough to be felt all across parts of India, Bangladesh, China's region of Tibet and Pakistan. Magnitude 7.8 NEPALMagnitude 7.8 NEPAL Saturday, April 25, 2015 at 06:11:26 UTCSaturday, April 25, 2015 at 06:11:26 UTC Image courtesy of the BBC Reports of damage and injuries are still being confirmed. The situation is unclear in remote areas which remain cut off or hard to access. Many mountain roads are damaged or blocked by landslides.
- 3. Magnitude 7.8 NEPALMagnitude 7.8 NEPAL Saturday, April 25, 2015 at 06:11:26 UTCSaturday, April 25, 2015 at 06:11:26 UTC People approach the scene after an avalanche triggered by a massive earthquake swept across Everest Base Camp, Nepal on Saturday, April 25, 2015. (AP Photo/ Azim Afif) The earthquake triggered a major avalanche on the south slopes of Mt. Everest, located approximately 160 km east-northeast of the epicenter. The avalanche destroyed the base camp, where climbers were waiting for a break in the weather to ascend the mountain. According to reports, the avalanche killed at least 17 people and injured 61 others.
- 4. Modified Mercalli Intensity Perceived Shaking Extreme Violent Severe Very Strong Strong Moderate Light Weak Not Felt USGS Estimated shaking Intensity from M 7.8 Earthquake The Modified Mercalli Intensity (MMI) scale depicts shaking severity. The area nearest Katmandu experienced very strong to severe shaking. Image courtesy of the US Geological Survey Shaking Intensity Magnitude 7.8 NEPALMagnitude 7.8 NEPAL Saturday, April 25, 2015 at 06:11:26 UTCSaturday, April 25, 2015 at 06:11:26 UTC
- 5. USGS PAGER Population Exposed to Earthquake Shaking Image courtesy of the US Geological Survey The color coded contour lines outline regions of MMI intensity. The total population exposure to a given MMI value is obtained by summing the population between the contour lines. The estimated population exposure to each MMI Intensity is shown in the table. The USGS PAGER map shows the population exposed to different Modified Mercalli Intensity (MMI) levels. Magnitude 7.8 NEPALMagnitude 7.8 NEPAL Saturday, April 25, 2015 at 06:11:26 UTCSaturday, April 25, 2015 at 06:11:26 UTC Nearly 5.3 million people experienced severe ground shaking during this earthquake.
- 6. The earthquake activity in Nepal is caused by the ongoing continent-continent collision between India and Asia. That collision has produced the Himalaya Mountains and the Tibetan Plateau. The collision zone wraps around the northwest promontory of the Indian continent in the Hindu Kush region of Tajikistan and Afghanistan then extends to the southeast through Nepal and Bhutan. The motion of India into Asia is essentially perpendicular to the Himalaya Mountains in Nepal. So thrust faulting earthquakes are the most common kind of earthquake in the central Himalayan region. Magnitude 7.8 NEPALMagnitude 7.8 NEPAL Saturday, April 25, 2015 at 06:11:26 UTCSaturday, April 25, 2015 at 06:11:26 UTC
- 7. This earthquake occurred as the result of thrust faulting between the subducting Indian Plate and the overriding Eurasian Plate to the north. At the location of this earthquake the Indian Plate is converging with Eurasia at a rate of 45 mm/yr towards the north-northeast, driving the uplift of the Himalayas and the Tibetan Plateau. USGS Centroid Moment Tensor Solution Magnitude 7.8 NEPALMagnitude 7.8 NEPAL Saturday, April 25, 2015 at 06:11:26 UTCSaturday, April 25, 2015 at 06:11:26 UTC The tension axis (T) reflects the minimum compressive stress direction. The pressure axis (P) reflects the maximum compressive stress direction.
- 8. Northward underthrusting of India beneath Eurasia generates numerous earthquakes and consequently makes this area one of the most seismically hazardous on Earth. This earthquake hazard map illustrates the peak ground acceleration expected to be exceeded with 10% probability during a 50-year period. The dark red zones indicate accelerations of about 0.5g where g=acceleration of gravity. Magnitude 7.8 NEPALMagnitude 7.8 NEPAL Saturday, April 25, 2015 at 06:11:26 UTCSaturday, April 25, 2015 at 06:11:26 UTC Seismic Hazard Image courtesy of the US Geological Survey
- 9. This map shows epicenters of earthquakes since 1990 (>M4) within the India – Asia collision zone. Note the belt of earthquakes along and south of the Himalaya Mountains sweeping through Nepal (yellow outline). Four earthquakes >M6 have occurred within 250 km of the April 25 earthquake over the past century. The largest included a M6.9 in August 1988 and a M8.0 in 1934 which severely damaged Kathmandu. The 1934 earthquake is thought to have caused around 10,600 fatalities. Magnitude 7.8 NEPALMagnitude 7.8 NEPAL Saturday, April 25, 2015 at 06:11:26 UTCSaturday, April 25, 2015 at 06:11:26 UTC M7.8 April 25, 2015 Map created using the IRIS Earthquake Browser:
- 10. This map shows the magnitude 7.8 earthquake (mainshock) and the distribution of 40 aftershocks of magnitude 4 or larger that occurred over the following 27 hours. The aftershock distribution outlines the rupture zone of the mainshock. The rupture during the mainshock initiated beneath the epicenter and propagated toward the southeast. On the next slide, a map of fault displacement during the earthquake is superimposed on this same map. Magnitude 7.8 NEPALMagnitude 7.8 NEPAL Saturday, April 25, 2015 at 06:11:26 UTCSaturday, April 25, 2015 at 06:11:26 UTC Map created using the IRIS Earthquake Browser: www.iris.edu/ieb M7.8 April 25, 2015 20 km
- 11. Magnitude 7.8 NEPALMagnitude 7.8 NEPAL Saturday, April 25, 2015 at 06:11:26 UTCSaturday, April 25, 2015 at 06:11:26 UTC 20 km 5 10 15 20 30 40 25 50 60 Kathmandu This map shows fault displacement during this earthquake. The red star is the epicenter while the purple arrow shows the direction of rupture propagation towards the southeast. Contours show the rupture front in 5 second increments after rupture initiation. Small red arrows show the direction and amount of motion of the rocks above the fault with respect to the rocks below the fault. The amount of slip is shown by color of shading. Maximum fault displacement of about 3 meters occurred in the rupture zone about 20 km north of Kathmandu.
- 12. Because it is built in a basin underlain by lake sediment, Kathmandu was particularly vulnerable during this earthquake. The city is located in a broad valley surrounded by the Himalayas. This valley was formerly the site of a lake within which river delta and lake sediment accumulated to thickness of about 100 meters. Magnitude 7.8 NEPALMagnitude 7.8 NEPAL Saturday, April 25, 2015 at 06:11:26 UTCSaturday, April 25, 2015 at 06:11:26 UTC Simplified geologic cross-section of the Kathmandu Valley showing basin-fill sediments. Lakebed deposits are labeled “lacustrine” whereas sediments deposited by rivers are labeled “fluvial”. After Sakai et al. Pleistocene rapid uplift of the Himalayan frontal ranges recorded in the Kathmandu and Siwalik basins, Palaeogeography, Palaeoclimatology, Palaeoecology, v. 241, p.1 6–27, 2006.
- 13. This earthquake was destructive due to both the shallow depth (15 km), and the fact that Kathmandu lies in a basin filled with about 2000 feet of soft sediment. Sedimentary basins can have a large effect on ground motion above them. Earthquake waves travel at high velocity through the stiff, crystalline rock of the crust but slow dramatically when entering the basin. This increases the amplitude of the earthquake waves within the basin fill. In addition, the sharp density contrast of the soft basin rocks with surrounding material can cause waves to reflect, trapping energy in the basin for a period of time. This extends the duration of shaking. Magnitude 7.8 NEPALMagnitude 7.8 NEPAL Saturday, April 25, 2015 at 06:11:26 UTCSaturday, April 25, 2015 at 06:11:26 UTC
- 14. Direct P and S waves cannot travel to stations at an epicentral distance Δ > 103° because of the large decrease in wave velocities across the boundary between the mantle and the liquid outer core. There is a "shadow zone" for direct P waves in the range 103° < Δ < 140°. The S-wave shadow zone exists for Δ > 103° because the liquid outer core blocks S waves that cannot travel through liquids. The record of the earthquake on the Mt Tabor Middle School seismometer (MTOR) is illustrated below. Portland is about 11,355 km (~7055 miles, 102.3 degrees) from the location of this earthquake. Magnitude 7.8 NEPALMagnitude 7.8 NEPAL Saturday, April 25, 2015 at 06:11:26 UTCSaturday, April 25, 2015 at 06:11:26 UTC
- 15. Image and text courtesy of the US Geological Survey Magnitude 7.8 NEPALMagnitude 7.8 NEPAL Saturday, April 25, 2015 at 06:11:26 UTCSaturday, April 25, 2015 at 06:11:26 UTC A magnitude 6.7 aftershock was felt on Sunday in Nepal, India and Bangladesh, and more avalanches were reported near Mt. Everest. Aftershocks following the magnitude 7.8 mainshock have resulted in additional damage and have been a major disruption to recovery efforts. Aftershock sequences follow predictable patterns as a group, although the individual earthquakes are themselves not predictable. The graph shows how the number of aftershocks and the magnitude of aftershocks decay with increasing time since the main shock. The number of aftershocks also decreases with distance from the main shock. Image modified from the Guardian
- 16. Teachable Moments are a service of IRIS Education & Public Outreach and The University of Portland Magnitude 7.8 NEPALMagnitude 7.8 NEPAL Saturday, April 25, 2015 at 06:11:26 UTCSaturday, April 25, 2015 at 06:11:26 UTC
Editor's Notes
- Shaking intensity scales were developed to standardize the measurements and ease comparison of different earthquakes. The Modified-Mercalli Intensity scale is a twelve-stage scale, from I to XII. Lower numbers represent imperceptible shaking while XII represents total destruction.
- The USGS PAGER map shows the population exposed to different Modified Mercalli Intensity (MMI) levels. MMI describes the severity of an earthquake in terms of its effect on humans and structures and is a rough measure of the amount of shaking at a given location.
- Relevant Animation: Earthquake focal mechanisms? http://www.iris.edu/hq/programs/education_and_outreach/animations/25
- Explore the seismicity further: Images from IRIS Earthquake Browser (www.iris.edu/ieb)
- Explore the seismicity further: Explore aftershocks in the IRIS Earthquake Browser (www.iris.edu/ieb)