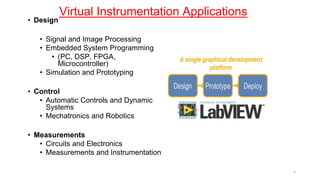
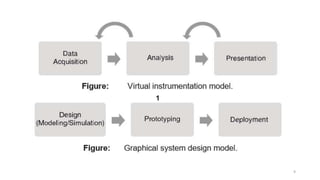
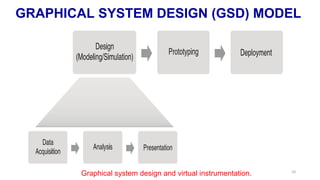
Mr.John Graff,
National Instruments
LabVIEW
2
⮚Laboratory Virtual Instrument Engineering
Workbench
⮚Graphical programming language
⮚Used for data acquisition, instrument
control, and signal processing
LabVIEW
•G is a graphical language, so programs
look like flowcharts
•Program modules are clicked and dragged
into place
•Modules are “wired” together, and data
flows through these “wires”
3
⮚Called “Virtual Instruments” (VIs)
⮚Appearance and operation imitates
actual physical instruments
Without With
LabVIEW
4
Virtual Instrumentation Applications
• Design
• Signal and Image Processing
• Embedded System Programming
• (PC, DSP, FPGA,
Microcontroller)
• Simulation and Prototyping
• Control
• Automatic Controls and Dynamic
Systems
• Mechatronics and Robotics
• Measurements
• Circuits and Electronics
• Measurements and Instrumentation
A single graphical development
platform
5
LabVIEW Background
• LabVIEW(Laboratory Virtual Instrumentation
Engineering Workbench)
• Nicknamed “G” for its graphical programming
• Designed by NI (National Instruments , LabVIEW 2012
was released in August 2012.
• Commonly used for data acquisition, instrument
control, and industrial automation.
6
Basics of GSD
• Uses functions called VIs (virtual instruments) to I/O, signal
processing, computations, programming, etc.
• Connects VI icons with wires that transmit values between
functions.
• Has three components: a front panel, a block diagram, and
connector pane.
• Uses data flow, so function execute as soon as all income
data is received.
• Allows for Object /Oriented programming via subVIs and
classes.
7
Basic Functions of Virtual Instrument
Three-step process:
1.Data acquisition
2.Data analysis
3.Data visualization/presentation.
8
9
GRAPHICAL SYSTEM DESIGN (GSD) MODEL
Graphical system design and virtual instrumentation. 10
Design (Model)
•Researcher develops a mathematical model of
the system, including sensors, actuators,
plants and controllers, and simulates them
under a variety of initial conditions and
constraints.
•The researcher uses different numerical
methods with the objective of validating the
performance of the model and optimizing it
11
Design (Model)
12
Prototype (Lab)
13
Prototype (Lab)
• If experimental validation of the model is required,
researchers develop and test a prototype in the
laboratory.
• The “virtual plant/process” can be used for HIL tests.
• Usually, this experimental (prototyping) phase is
executed on standard PCs or PXI computers, using
PCI/PXI data acquisition devices or external
measuring devices connected to a PC via USB,
Ethernet, GPIB, or serial ports.
14
Deployment (Field)
15
Deployment (Field)
•Finally, the model (controller, analyzer or both) is
deployed in the field using a PC, or it can be
downloaded to a dedicated embedded controller such
as Compact RIO, which usually operates in stand-
alone mode and in real-time .
•For large systems, with high-channel counts or
involving modular instruments such as scopes, digital
multimeters (DMMs), RF vector signal analyzers, and
dynamic signal acquisition (DSA) devices, the PXI
platform is more appropriate.
16
DESIGN FLOW WITHOUT GSD
Typical embedded system software and hardware
design flow.
17
DESIGN FLOW WITH GSD
Stream-lined development flow with graphical system
design 18
ADVANTAGES OF LabVIEW
•Graphical user interface
•Drag-and-drop built-in functions
•Multiple high level development tools
•Multi platforms
•Reduces cost and preserves investment
•Flexibility and scalability
•Visualization capabilities
19
Web references
• https://www.youtube.com/watch?v=Rzr4EJcaxSo
• https://www.youtube.com/watch?v=RL7Tjgy7fl8
* 21

1.2_Graphical System Design (GSD) model.pptx

  • 1.
  • 2.
    LabVIEW 2 ⮚Laboratory Virtual InstrumentEngineering Workbench ⮚Graphical programming language ⮚Used for data acquisition, instrument control, and signal processing
  • 3.
    LabVIEW •G is agraphical language, so programs look like flowcharts •Program modules are clicked and dragged into place •Modules are “wired” together, and data flows through these “wires” 3
  • 4.
    ⮚Called “Virtual Instruments”(VIs) ⮚Appearance and operation imitates actual physical instruments Without With LabVIEW 4
  • 5.
    Virtual Instrumentation Applications •Design • Signal and Image Processing • Embedded System Programming • (PC, DSP, FPGA, Microcontroller) • Simulation and Prototyping • Control • Automatic Controls and Dynamic Systems • Mechatronics and Robotics • Measurements • Circuits and Electronics • Measurements and Instrumentation A single graphical development platform 5
  • 6.
    LabVIEW Background • LabVIEW(LaboratoryVirtual Instrumentation Engineering Workbench) • Nicknamed “G” for its graphical programming • Designed by NI (National Instruments , LabVIEW 2012 was released in August 2012. • Commonly used for data acquisition, instrument control, and industrial automation. 6
  • 7.
    Basics of GSD •Uses functions called VIs (virtual instruments) to I/O, signal processing, computations, programming, etc. • Connects VI icons with wires that transmit values between functions. • Has three components: a front panel, a block diagram, and connector pane. • Uses data flow, so function execute as soon as all income data is received. • Allows for Object /Oriented programming via subVIs and classes. 7
  • 8.
    Basic Functions ofVirtual Instrument Three-step process: 1.Data acquisition 2.Data analysis 3.Data visualization/presentation. 8
  • 9.
  • 10.
    GRAPHICAL SYSTEM DESIGN(GSD) MODEL Graphical system design and virtual instrumentation. 10
  • 11.
    Design (Model) •Researcher developsa mathematical model of the system, including sensors, actuators, plants and controllers, and simulates them under a variety of initial conditions and constraints. •The researcher uses different numerical methods with the objective of validating the performance of the model and optimizing it 11
  • 12.
  • 13.
  • 14.
    Prototype (Lab) • Ifexperimental validation of the model is required, researchers develop and test a prototype in the laboratory. • The “virtual plant/process” can be used for HIL tests. • Usually, this experimental (prototyping) phase is executed on standard PCs or PXI computers, using PCI/PXI data acquisition devices or external measuring devices connected to a PC via USB, Ethernet, GPIB, or serial ports. 14
  • 15.
  • 16.
    Deployment (Field) •Finally, themodel (controller, analyzer or both) is deployed in the field using a PC, or it can be downloaded to a dedicated embedded controller such as Compact RIO, which usually operates in stand- alone mode and in real-time . •For large systems, with high-channel counts or involving modular instruments such as scopes, digital multimeters (DMMs), RF vector signal analyzers, and dynamic signal acquisition (DSA) devices, the PXI platform is more appropriate. 16
  • 17.
    DESIGN FLOW WITHOUTGSD Typical embedded system software and hardware design flow. 17
  • 18.
    DESIGN FLOW WITHGSD Stream-lined development flow with graphical system design 18
  • 19.
    ADVANTAGES OF LabVIEW •Graphicaluser interface •Drag-and-drop built-in functions •Multiple high level development tools •Multi platforms •Reduces cost and preserves investment •Flexibility and scalability •Visualization capabilities 19
  • 21.
    Web references • https://www.youtube.com/watch?v=Rzr4EJcaxSo •https://www.youtube.com/watch?v=RL7Tjgy7fl8 * 21