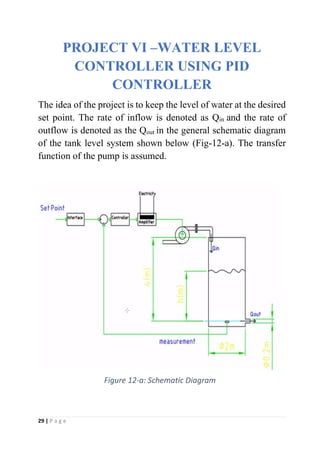
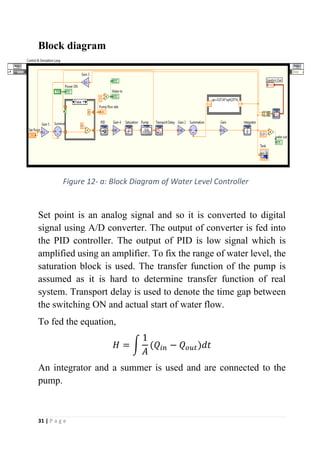
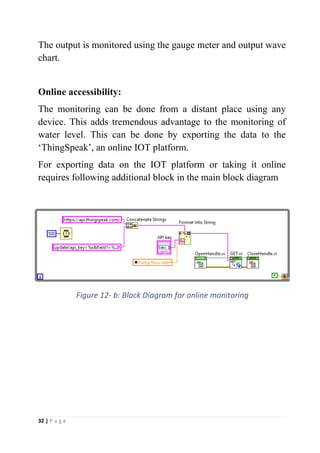
1 | P a g e
National Instruments Innovation Center
Online based Summer Internship Project Report
On
Virtual Automation using LabVIEW
SUBMITTED
BY
Manish Kumar
Roll No. – EEB17036
7th Semester, Electrical Engineering, B. Tech, Tezpur
University
Duration of the internship: 16th June 2020 - 30th July 2020.
2 | P a g e
CERTIFICATE OF PARTICIPATION
3 | P a g e
Acknowledgement
I would like to thank my instructor Mr. Nitesh Pradhan,
Coordinator National Instrument Innovation Centre for
providing me the opportunities of learning and gaining practical
experience in field of automation and for his guidance during the
period of training. His invaluable suggestions not only helped
me to reach the successful completion of the tasks assigned, but
also made me learn a lot.
4 | P a g e
Abstract
The internship report contains several mini projects which
I have done during the internship period through which I
have tried to explain our 45 days experience in field of
virtual automation.
5 | P a g e
CONTENTS
Chapter
No
Topic Page
No.
1. Introduction 6
2. Project-1: Dice Simulation 11
3. Project-2: Fan Simulation 14
4. Project-3: Function Generator 17
5. Project-4: Temperature Sensing 21
6. Project-5: Bottle Arm Shift Using
Robotic Arm Shift
24
7. Project-6: Water Level Controller Using
PID Controller
29
8. Conclusions 36
9. References 37
6 | P a g e
INTRODUCTION
LabVIEW (short for Laboratory Virtual Instrumentation
Engineering Workbench) is a platform and development
environment for a visual programming language from National
Instruments.
Originally It was released for the Apple Macintosh in 1986, Lab
VIEW is commonly used for data acquisition, instrument
control, and industrial automation on a variety of platforms
including Microsoft Windows, various flavours of UNIX, Linux,
and Mac OS.
The programming language used in Lab VIEW, is a dataflow
language. Execution is determined by the structure of a graphical
block diagram.
Dataflow programming: The programming language used in
LabVIEW, called "G", is a dataflow language. Execution is
determined by the structure of a graphical block diagram (the
LV-source code) on which the programmer connects different
function-nodes by drawing wires.
7 | P a g e
Comparison of Text Based and Graphical
Programming
Text Based Programming Graphical Programming
It is Text based Programming It is icon-based programming
and wiring
Text based programming is not
interactive
Graphical programming is
highly interactive
Syntax must be known to do
programming
Syntax is knowledge but is not
required for programming
The execution of the program is
from top to bottom
The execution of the program is
from left to right
To check for the error the
program has to be compiled or
executed
Errors are indicated as we wire
the blocks
Front panel design needs extra
coding or needs extra work
Front panel design is a part of
programming
Program flow is not visible Data flow is visible
Table 1: Comparison between text based and graphical based programming
LabVIEW ties the creation of user interfaces (called front
panels) into the development cycle. LabVIEW
programs/subroutines are called virtual instruments.
8 | P a g e
Each Virtual instrument has three components:
1. Block Diagram: Contains the graphical source code that
defines the functionality of the Virtual instruments.
2. Front Panel: The front panel window is the user interface
for the Virtual instruments (VI). It has controls and
indicators, which are the interactive input and output
terminals, respectively, of the VI. Controls and indicators
placed on the front panel are automatically placed on the
block diagram
3. Connector Panel and Icon: Method of connecting to other
Virtual instruments.
Figure 1:Front Panel and Block Diagram
9 | P a g e
Benefits of using LabVIEW
• Extensive Interface - Even people with limited coding
experience can write programs and deploy solutions in
reduced time interval.
• Code Reuse and Platform independent -The G-code is
independent of the operating system
• Parallel Processing- Easy to code programs with multiple
tasks performed in parallel by multithreading
• Hardware support: One benefit of LabVIEW over other
development environments is the extensive support for
accessing instrumentation hardware.
Application of LabVIEW
LabVIEW is used most by companies that manufacture
hardware of some sort, specifically in the groups responsible for
testing that the product was designed correctly and that the
product works before leaving the factory. It’s also used in
research (i.e. government labs and universities) that use
LabVIEW to facilitate their experiments.
• Machine monitoring and control: LabVIEW Real-Time
module helps in preparing powerful machine monitoring
and control applications
• Research and Analysis: Scientist and Researchers use it
biomedical, aerospace energy industries etc.
• Control Design: Real world data can be compared with
theoretical data
10 | P a g e
Companies that use LabVIEW
There are many companies that uses LabVIEW in which
some of the famous companies are:
• Ball Aerospace
• Siemens
• Nokia
• General Electric
• Honeywell
• Amazon
• General Dynamics
• Philips
• John Deere
• SpaceX
11 | P a g e
PROJECT I - DICE SIMULATION
This project is the basic LabVIEW project which focus on the
automation of the dice outcome. The dice is programmed to give
random outputs ranging from 1 to 6.
This method can also be implemented to generate random
numbers of possible definite range
Block diagram components
• Picture Enum terminal
• A for loop
• Random number generator
• Multiplier
• U16 unsigned word integer
• Delay timer
Block diagram
Figure 2: Block Diagram of Dice Simulation
12 | P a g e
Description and procedure
Front panel:
• Arrange the image files of dice 1-6 in same size
• Right click on the front panel >> ring & Enum >> picture
>> picture ring (NXG style)
• Drag an image file in the picture ring >> right click
>>choose add after
• Follow the above step for all the image files
• Right click >> disable increment/decrement
Block diagram panel:
• Click on block diagram panel, convert the picture Enum
terminal to indicator
• Right click >> structure >> Take a fore loop
• Set the time
• Right click >> functions >> numeric >> random number
generator
• Choose multiplier, value const 5 for 0-5, for six dice
• Choose U16 unsigned value
• Right click >> timing >> wait(ms); this sets the simulation
speed of the cpu (125 ms in this project)
• Run
13 | P a g e
Output
Each time we click run, the dice shows a random number
between 1 and 6 which no one can predict.
Figure 3:Output of Dice Simulation (Front Panel View)
14 | P a g e
PROJECT II - FAN SIMULATION
This simulation project in LabVIEW allows us to virtually
automate and regulate the speed of the fan. The virtual knob can
be used to regulate the speed of the fan and the stop button can
be used to stop the fan.
This project can be modified to control the speed of any
independent fan, machine, etc.
Block diagram components
• Picture Enum terminal
• A while loop
• Quotient remainder generator
• Multiplier
• Delay timer
• Stop button
Block diagram
Figure 4: Block Diagram of Fan Simulation
15 | P a g e
Description and procedure
Front panel:
• Arrange the image files of fan in same size
• Right click on the front panel >> ring & enum >> picture
>> picture ring (NXG style)
• Drag an image file in the picture ring >> right click
>>choose add after
• Follow the above step for all the image file
Block diagram panel:
• Click on block diagram panel, convert the picture enum
terminal to indicator
• Right click >> structure >> Take a while loop
• Right click >> controls >> Boolean >> stop button
• Right click >> functions >> numeric >> quotient remainder
generator
• Right click >> timing >> wait(ms); this sets the simulation
speed of the cpu (100 ms in this project)
• Right click >> functions >> numeric >> speed >> knob
• Choose multiplier with a multiplying value of 100
• Run
16 | P a g e
Output
When we run the program, we have a virtually automated fan
which can be controlled by the virtual knob/speed regulator. The
stop button is used to stop the movement of the fan.
Figure 5: Output of Fan Simulation (Front Panel View)
17 | P a g e
PROJECT III – FUNCTION
GENERATOR
In this virtual simulation we have generated various type of
waves using virtual oscilloscope aided with amplitude,
frequency and a constant phase knob.
More complex waveforms can be generated following the same
technique with some additional necessary blocks.
Block diagram components
• Amplitude block
• Frequency block
• Constant phase block
• Stop button
• Waveform generator
• Delay timer
Block diagram
Figure 6: Block Diagram of Function Generator
18 | P a g e
Description and procedure
Front panel:
• Right click >> decoration >> choose raised box and place
it on the front panel
• Right click >> numeric >> knob; for amplitude and
frequency
• Right click >> numeric >> numeric constant; for a constant
phase supply
• Right click >> numeric >> boolean >> stop button
• Right click >> graph >> waveform graph;
Block diagram panel:
• Right click >> structure >> while loop
• Connect stop button to the loop terminal
• Right click >> signal processing >> waveform generator
• Right click on waveform generator >> click on visible >>
label; now the terminals will be visible in terms of
amplitude, frequency and phase
• Right click >> timing >> wait(ms); this sets the simulation
speed of the cpu (125 ms in this project)
• Change signal type button to get different types of waves
19 | P a g e
Output
The types of generated waveforms can be changed using signal
type button on the front panel
Figure 7- a: Output of Function Generator (Triangular Wave)
Figure 7-a: Output of Function Generator (Sine Wave)
20 | P a g e
Figure 7- c: Output of Function Generator (Sawtooth Wave)
Figure 7- b: Output of Function Generator (Square Wave)
21 | P a g e
PROJECT IV – TEMPERATURE
SENSING USING LabVIEW
The project aims on virtually sense the temperature of the system
and tell that the system is at high temperature, medium
temperature or low temperature.
Block Diagram Components
• Horizontal Pointer Slide
• Round Light
• Meter
• Stop Button
Block diagram
Figure 8: Block Diagram of Temperature Sensing
22 | P a g e
Description and Procedure
Front Panel:
• Right Click >> Controls >> Modern >> Numeric >>
Horizontal Pointer Slide
• Right Click >> Controls >> Classic >> Classic
Boolean >> Round Light
• Right Click >> Controls >> Modern >> Numeric >>
Meter
• Right Click >> Controls >> Modern >> Numeric >>
Numeric Indicator
• Controls >> Modern >> Decorations
Block Diagram Panel:
• Right Click >> Functions >> Programming >>
Comparison
• Right Click >>Functions >> Programming >> Boolean
• Right Click >> Functions >> Programming >>
Comparison >> Less or Equal, "Right Click" on the
second input terminal and go to Create >> Constant.
23 | P a g e
OUTPUT:
Figure 9: Output of Temperature Sensing (Front Panel View)
24 | P a g e
PROJECT V – BOTTLE ARM SHIFT
USING ROBOTIC ARM SHIFT
In this LabVIEW project, we designed an automated virtual
robotic arm which are used in the industries to reduce the human
effort. In this program the robotic arm is used to shift bottle or
any container from one place to another.
Block diagram components
• For loop
• While loop
• Delay Timers
• Summers
• Boolean buttons
• Random number generator
Block diagram
UP
Figure 10- a: Block Diagram for UP movement
25 | P a g e
DOWN
Figure 10- b: Block Diagram for Down movement
Release
Figure 10-c: Block Diagram for Release the bottle
Right to left
Figure 10- d: Block Diagram for Right to left movement
26 | P a g e
Hold
Figure 10- e: Block Diagram for hold the bottle
Front panel components:
DCS module kit
• Container
• Conveyor misc.
• Conveyor belt
• Boolean push buttons
Front panel diagrams
Ready position
Figure 11-a: Front panel View (Initially)
27 | P a g e
Running position
Releasing position
Figure 11- a: Front Panel View (Running Left to Right)
Figure 11- b: Front panel View (Releasing)
28 | P a g e
Description and procedures
Front panel:
• Get the DCS module kit containers and calculate their
exact positions and for the working of the simulator.
• Arrange the shape and size of the containers as
accordance
• Select the Boolean functions as working as push button
for the simulator
• Down, release, right to left, up, hold.
Block diagram panel:
• The Boolean buttons help in setting the conditions and
perform accordingly
• For every step of action, the Boolean conditions like
time, position, type, source and delay are set according
to the requirement
Output
As illustrated above in the front panel diagrams, when we run
the program, the arms of the holder expand and it lifts the bottle
and the holder runs on the conveyor belt and transports the bottle
from one position to another
29 | P a g e
PROJECT VI –WATER LEVEL
CONTROLLER USING PID
CONTROLLER
The idea of the project is to keep the level of water at the desired
set point. The rate of inflow is denoted as Qin and the rate of
outflow is denoted as the Qout in the general schematic diagram
of the tank level system shown below (Fig-12-a). The transfer
function of the pump is assumed.
Figure 12-a: Schematic Diagram
30 | P a g e
We have the desired set point, a PID controller, an amplifier
connected to the interface of tank level system. The working
equation for the system is,
𝐻 = ∫
1
𝐴
(𝑄𝑖𝑛 − 𝑄𝑜𝑢𝑡)𝑑𝑡
Where H is the desired height or set point
A is the surface area of the tank
Block diagram components
• Set point block
• A/D converter
• PID controller
• Amplifier
• Saturation block
• Pump block
• Transport delay block
• Summer
• Integrator
• Feed-back sensor
• Gauge meter
• Output wave chart
31 | P a g e
Block diagram
Set point is an analog signal and so it is converted to digital
signal using A/D converter. The output of converter is fed into
the PID controller. The output of PID is low signal which is
amplified using an amplifier. To fix the range of water level, the
saturation block is used. The transfer function of the pump is
assumed as it is hard to determine transfer function of real
system. Transport delay is used to denote the time gap between
the switching ON and actual start of water flow.
To fed the equation,
𝐻 = ∫
1
𝐴
(𝑄𝑖𝑛 − 𝑄𝑜𝑢𝑡)𝑑𝑡
An integrator and a summer is used and are connected to the
pump.
Figure 12- a: Block Diagram of Water Level Controller
32 | P a g e
The output is monitored using the gauge meter and output wave
chart.
Online accessibility:
The monitoring can be done from a distant place using any
device. This adds tremendous advantage to the monitoring of
water level. This can be done by exporting the data to the
‘ThingSpeak’, an online IOT platform.
For exporting data on the IOT platform or taking it online
requires following additional block in the main block diagram
Figure 12- b: Block Diagram for online monitoring
33 | P a g e
The overall block diagram looks like,
Output
Figure 12- c: Complete Block Diagram of Water Level Controller
Figure 13- a: Front Panel View when tank is empty
34 | P a g e
When the switched is turn on the indicator indicates that the
pump is on and we observe the waveform. The red waveform is
the set point and blue waveform is the water level in the tank at
any instant. We observe that the water level saturates when it
reaches the set point.
The API key is related to exporting data on the internet.
Figure 13- b: Front Panel View when water in the tank reaches set point
35 | P a g e
The following diagram shows the monitoring screen on Thing
Speak IOT platform
Figure 13- c: Online monitoring
36 | P a g e
Conclusion
After successful completion of the course and the thorough
experience, it’s clear that this software is very important for
virtual automation. It’s quite easy and handy to operate. The
projects based on this software has industrial applications and
are to some extent the replica of what actually happens in the
industries.
LabVIEW is a powerful tool that has extensive application in the
automation industry. Learning this software has really fascinated
me to take up some real-life projects and implement it using
LabVIEW.
As the world advances, technology evolves and these are the
days of AI, virtual reality, robots and automated machines which
evidently supports the great prospects of virtual automation.
37 | P a g e
References
• https://forums.ni.com/
• https://www.electronics-notes.com/articles/test-methods/labview/what-
is-
labview.php#:~:text=LabVIEW%20provides%20a%20universal%20platform
,acquisition%20and%20test%20equipment%20products.
Thanks

LabVIEW Report

  • 1.
    1 | Pa g e National Instruments Innovation Center Online based Summer Internship Project Report On Virtual Automation using LabVIEW SUBMITTED BY Manish Kumar Roll No. – EEB17036 7th Semester, Electrical Engineering, B. Tech, Tezpur University Duration of the internship: 16th June 2020 - 30th July 2020.
  • 2.
    2 | Pa g e CERTIFICATE OF PARTICIPATION
  • 3.
    3 | Pa g e Acknowledgement I would like to thank my instructor Mr. Nitesh Pradhan, Coordinator National Instrument Innovation Centre for providing me the opportunities of learning and gaining practical experience in field of automation and for his guidance during the period of training. His invaluable suggestions not only helped me to reach the successful completion of the tasks assigned, but also made me learn a lot.
  • 4.
    4 | Pa g e Abstract The internship report contains several mini projects which I have done during the internship period through which I have tried to explain our 45 days experience in field of virtual automation.
  • 5.
    5 | Pa g e CONTENTS Chapter No Topic Page No. 1. Introduction 6 2. Project-1: Dice Simulation 11 3. Project-2: Fan Simulation 14 4. Project-3: Function Generator 17 5. Project-4: Temperature Sensing 21 6. Project-5: Bottle Arm Shift Using Robotic Arm Shift 24 7. Project-6: Water Level Controller Using PID Controller 29 8. Conclusions 36 9. References 37
  • 6.
    6 | Pa g e INTRODUCTION LabVIEW (short for Laboratory Virtual Instrumentation Engineering Workbench) is a platform and development environment for a visual programming language from National Instruments. Originally It was released for the Apple Macintosh in 1986, Lab VIEW is commonly used for data acquisition, instrument control, and industrial automation on a variety of platforms including Microsoft Windows, various flavours of UNIX, Linux, and Mac OS. The programming language used in Lab VIEW, is a dataflow language. Execution is determined by the structure of a graphical block diagram. Dataflow programming: The programming language used in LabVIEW, called "G", is a dataflow language. Execution is determined by the structure of a graphical block diagram (the LV-source code) on which the programmer connects different function-nodes by drawing wires.
  • 7.
    7 | Pa g e Comparison of Text Based and Graphical Programming Text Based Programming Graphical Programming It is Text based Programming It is icon-based programming and wiring Text based programming is not interactive Graphical programming is highly interactive Syntax must be known to do programming Syntax is knowledge but is not required for programming The execution of the program is from top to bottom The execution of the program is from left to right To check for the error the program has to be compiled or executed Errors are indicated as we wire the blocks Front panel design needs extra coding or needs extra work Front panel design is a part of programming Program flow is not visible Data flow is visible Table 1: Comparison between text based and graphical based programming LabVIEW ties the creation of user interfaces (called front panels) into the development cycle. LabVIEW programs/subroutines are called virtual instruments.
  • 8.
    8 | Pa g e Each Virtual instrument has three components: 1. Block Diagram: Contains the graphical source code that defines the functionality of the Virtual instruments. 2. Front Panel: The front panel window is the user interface for the Virtual instruments (VI). It has controls and indicators, which are the interactive input and output terminals, respectively, of the VI. Controls and indicators placed on the front panel are automatically placed on the block diagram 3. Connector Panel and Icon: Method of connecting to other Virtual instruments. Figure 1:Front Panel and Block Diagram
  • 9.
    9 | Pa g e Benefits of using LabVIEW • Extensive Interface - Even people with limited coding experience can write programs and deploy solutions in reduced time interval. • Code Reuse and Platform independent -The G-code is independent of the operating system • Parallel Processing- Easy to code programs with multiple tasks performed in parallel by multithreading • Hardware support: One benefit of LabVIEW over other development environments is the extensive support for accessing instrumentation hardware. Application of LabVIEW LabVIEW is used most by companies that manufacture hardware of some sort, specifically in the groups responsible for testing that the product was designed correctly and that the product works before leaving the factory. It’s also used in research (i.e. government labs and universities) that use LabVIEW to facilitate their experiments. • Machine monitoring and control: LabVIEW Real-Time module helps in preparing powerful machine monitoring and control applications • Research and Analysis: Scientist and Researchers use it biomedical, aerospace energy industries etc. • Control Design: Real world data can be compared with theoretical data
  • 10.
    10 | Pa g e Companies that use LabVIEW There are many companies that uses LabVIEW in which some of the famous companies are: • Ball Aerospace • Siemens • Nokia • General Electric • Honeywell • Amazon • General Dynamics • Philips • John Deere • SpaceX
  • 11.
    11 | Pa g e PROJECT I - DICE SIMULATION This project is the basic LabVIEW project which focus on the automation of the dice outcome. The dice is programmed to give random outputs ranging from 1 to 6. This method can also be implemented to generate random numbers of possible definite range Block diagram components • Picture Enum terminal • A for loop • Random number generator • Multiplier • U16 unsigned word integer • Delay timer Block diagram Figure 2: Block Diagram of Dice Simulation
  • 12.
    12 | Pa g e Description and procedure Front panel: • Arrange the image files of dice 1-6 in same size • Right click on the front panel >> ring & Enum >> picture >> picture ring (NXG style) • Drag an image file in the picture ring >> right click >>choose add after • Follow the above step for all the image files • Right click >> disable increment/decrement Block diagram panel: • Click on block diagram panel, convert the picture Enum terminal to indicator • Right click >> structure >> Take a fore loop • Set the time • Right click >> functions >> numeric >> random number generator • Choose multiplier, value const 5 for 0-5, for six dice • Choose U16 unsigned value • Right click >> timing >> wait(ms); this sets the simulation speed of the cpu (125 ms in this project) • Run
  • 13.
    13 | Pa g e Output Each time we click run, the dice shows a random number between 1 and 6 which no one can predict. Figure 3:Output of Dice Simulation (Front Panel View)
  • 14.
    14 | Pa g e PROJECT II - FAN SIMULATION This simulation project in LabVIEW allows us to virtually automate and regulate the speed of the fan. The virtual knob can be used to regulate the speed of the fan and the stop button can be used to stop the fan. This project can be modified to control the speed of any independent fan, machine, etc. Block diagram components • Picture Enum terminal • A while loop • Quotient remainder generator • Multiplier • Delay timer • Stop button Block diagram Figure 4: Block Diagram of Fan Simulation
  • 15.
    15 | Pa g e Description and procedure Front panel: • Arrange the image files of fan in same size • Right click on the front panel >> ring & enum >> picture >> picture ring (NXG style) • Drag an image file in the picture ring >> right click >>choose add after • Follow the above step for all the image file Block diagram panel: • Click on block diagram panel, convert the picture enum terminal to indicator • Right click >> structure >> Take a while loop • Right click >> controls >> Boolean >> stop button • Right click >> functions >> numeric >> quotient remainder generator • Right click >> timing >> wait(ms); this sets the simulation speed of the cpu (100 ms in this project) • Right click >> functions >> numeric >> speed >> knob • Choose multiplier with a multiplying value of 100 • Run
  • 16.
    16 | Pa g e Output When we run the program, we have a virtually automated fan which can be controlled by the virtual knob/speed regulator. The stop button is used to stop the movement of the fan. Figure 5: Output of Fan Simulation (Front Panel View)
  • 17.
    17 | Pa g e PROJECT III – FUNCTION GENERATOR In this virtual simulation we have generated various type of waves using virtual oscilloscope aided with amplitude, frequency and a constant phase knob. More complex waveforms can be generated following the same technique with some additional necessary blocks. Block diagram components • Amplitude block • Frequency block • Constant phase block • Stop button • Waveform generator • Delay timer Block diagram Figure 6: Block Diagram of Function Generator
  • 18.
    18 | Pa g e Description and procedure Front panel: • Right click >> decoration >> choose raised box and place it on the front panel • Right click >> numeric >> knob; for amplitude and frequency • Right click >> numeric >> numeric constant; for a constant phase supply • Right click >> numeric >> boolean >> stop button • Right click >> graph >> waveform graph; Block diagram panel: • Right click >> structure >> while loop • Connect stop button to the loop terminal • Right click >> signal processing >> waveform generator • Right click on waveform generator >> click on visible >> label; now the terminals will be visible in terms of amplitude, frequency and phase • Right click >> timing >> wait(ms); this sets the simulation speed of the cpu (125 ms in this project) • Change signal type button to get different types of waves
  • 19.
    19 | Pa g e Output The types of generated waveforms can be changed using signal type button on the front panel Figure 7- a: Output of Function Generator (Triangular Wave) Figure 7-a: Output of Function Generator (Sine Wave)
  • 20.
    20 | Pa g e Figure 7- c: Output of Function Generator (Sawtooth Wave) Figure 7- b: Output of Function Generator (Square Wave)
  • 21.
    21 | Pa g e PROJECT IV – TEMPERATURE SENSING USING LabVIEW The project aims on virtually sense the temperature of the system and tell that the system is at high temperature, medium temperature or low temperature. Block Diagram Components • Horizontal Pointer Slide • Round Light • Meter • Stop Button Block diagram Figure 8: Block Diagram of Temperature Sensing
  • 22.
    22 | Pa g e Description and Procedure Front Panel: • Right Click >> Controls >> Modern >> Numeric >> Horizontal Pointer Slide • Right Click >> Controls >> Classic >> Classic Boolean >> Round Light • Right Click >> Controls >> Modern >> Numeric >> Meter • Right Click >> Controls >> Modern >> Numeric >> Numeric Indicator • Controls >> Modern >> Decorations Block Diagram Panel: • Right Click >> Functions >> Programming >> Comparison • Right Click >>Functions >> Programming >> Boolean • Right Click >> Functions >> Programming >> Comparison >> Less or Equal, "Right Click" on the second input terminal and go to Create >> Constant.
  • 23.
    23 | Pa g e OUTPUT: Figure 9: Output of Temperature Sensing (Front Panel View)
  • 24.
    24 | Pa g e PROJECT V – BOTTLE ARM SHIFT USING ROBOTIC ARM SHIFT In this LabVIEW project, we designed an automated virtual robotic arm which are used in the industries to reduce the human effort. In this program the robotic arm is used to shift bottle or any container from one place to another. Block diagram components • For loop • While loop • Delay Timers • Summers • Boolean buttons • Random number generator Block diagram UP Figure 10- a: Block Diagram for UP movement
  • 25.
    25 | Pa g e DOWN Figure 10- b: Block Diagram for Down movement Release Figure 10-c: Block Diagram for Release the bottle Right to left Figure 10- d: Block Diagram for Right to left movement
  • 26.
    26 | Pa g e Hold Figure 10- e: Block Diagram for hold the bottle Front panel components: DCS module kit • Container • Conveyor misc. • Conveyor belt • Boolean push buttons Front panel diagrams Ready position Figure 11-a: Front panel View (Initially)
  • 27.
    27 | Pa g e Running position Releasing position Figure 11- a: Front Panel View (Running Left to Right) Figure 11- b: Front panel View (Releasing)
  • 28.
    28 | Pa g e Description and procedures Front panel: • Get the DCS module kit containers and calculate their exact positions and for the working of the simulator. • Arrange the shape and size of the containers as accordance • Select the Boolean functions as working as push button for the simulator • Down, release, right to left, up, hold. Block diagram panel: • The Boolean buttons help in setting the conditions and perform accordingly • For every step of action, the Boolean conditions like time, position, type, source and delay are set according to the requirement Output As illustrated above in the front panel diagrams, when we run the program, the arms of the holder expand and it lifts the bottle and the holder runs on the conveyor belt and transports the bottle from one position to another
  • 29.
    29 | Pa g e PROJECT VI –WATER LEVEL CONTROLLER USING PID CONTROLLER The idea of the project is to keep the level of water at the desired set point. The rate of inflow is denoted as Qin and the rate of outflow is denoted as the Qout in the general schematic diagram of the tank level system shown below (Fig-12-a). The transfer function of the pump is assumed. Figure 12-a: Schematic Diagram
  • 30.
    30 | Pa g e We have the desired set point, a PID controller, an amplifier connected to the interface of tank level system. The working equation for the system is, 𝐻 = ∫ 1 𝐴 (𝑄𝑖𝑛 − 𝑄𝑜𝑢𝑡)𝑑𝑡 Where H is the desired height or set point A is the surface area of the tank Block diagram components • Set point block • A/D converter • PID controller • Amplifier • Saturation block • Pump block • Transport delay block • Summer • Integrator • Feed-back sensor • Gauge meter • Output wave chart
  • 31.
    31 | Pa g e Block diagram Set point is an analog signal and so it is converted to digital signal using A/D converter. The output of converter is fed into the PID controller. The output of PID is low signal which is amplified using an amplifier. To fix the range of water level, the saturation block is used. The transfer function of the pump is assumed as it is hard to determine transfer function of real system. Transport delay is used to denote the time gap between the switching ON and actual start of water flow. To fed the equation, 𝐻 = ∫ 1 𝐴 (𝑄𝑖𝑛 − 𝑄𝑜𝑢𝑡)𝑑𝑡 An integrator and a summer is used and are connected to the pump. Figure 12- a: Block Diagram of Water Level Controller
  • 32.
    32 | Pa g e The output is monitored using the gauge meter and output wave chart. Online accessibility: The monitoring can be done from a distant place using any device. This adds tremendous advantage to the monitoring of water level. This can be done by exporting the data to the ‘ThingSpeak’, an online IOT platform. For exporting data on the IOT platform or taking it online requires following additional block in the main block diagram Figure 12- b: Block Diagram for online monitoring
  • 33.
    33 | Pa g e The overall block diagram looks like, Output Figure 12- c: Complete Block Diagram of Water Level Controller Figure 13- a: Front Panel View when tank is empty
  • 34.
    34 | Pa g e When the switched is turn on the indicator indicates that the pump is on and we observe the waveform. The red waveform is the set point and blue waveform is the water level in the tank at any instant. We observe that the water level saturates when it reaches the set point. The API key is related to exporting data on the internet. Figure 13- b: Front Panel View when water in the tank reaches set point
  • 35.
    35 | Pa g e The following diagram shows the monitoring screen on Thing Speak IOT platform Figure 13- c: Online monitoring
  • 36.
    36 | Pa g e Conclusion After successful completion of the course and the thorough experience, it’s clear that this software is very important for virtual automation. It’s quite easy and handy to operate. The projects based on this software has industrial applications and are to some extent the replica of what actually happens in the industries. LabVIEW is a powerful tool that has extensive application in the automation industry. Learning this software has really fascinated me to take up some real-life projects and implement it using LabVIEW. As the world advances, technology evolves and these are the days of AI, virtual reality, robots and automated machines which evidently supports the great prospects of virtual automation.
  • 37.
    37 | Pa g e References • https://forums.ni.com/ • https://www.electronics-notes.com/articles/test-methods/labview/what- is- labview.php#:~:text=LabVIEW%20provides%20a%20universal%20platform ,acquisition%20and%20test%20equipment%20products. Thanks