Downloaded 1,285 times


![Basic concepts Data visualization Data summarization
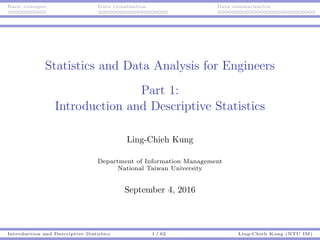
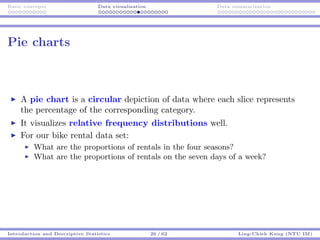
Frequency distributions: an example
The resulting classes:
Class Class interval (Which means)
1 [0, 1000) 0 ≤ x < 1000
2 [1000, 2000) 1000 ≤ x < 2000
3 [2000, 3000) 2000 ≤ x < 3000
...
8 [7000, 8000) 7000 ≤ x < 8000
9 [8000, 9000) 8000 ≤ x < 9000
How about [0, 999], [1000, 1999], etc.?
How about (0, 1000], (1000, 2000], etc.?
Introduction and Descriptive Statistics 18 / 62 Ling-Chieh Kung (NTU IM)](https://image.slidesharecdn.com/tdsa160904combine-160831092419/85/123-2016-9-4-18-320.jpg)


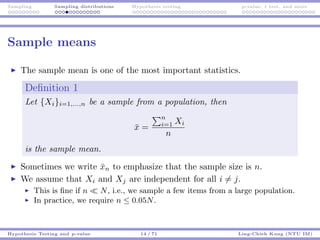
![Sampling Sampling distributions Hypothesis testing p-value, t test, and more
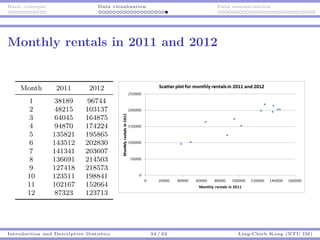
Means and variances of sample means
Suppose the population mean and variance are µ and σ2
, respectively.
These two numbers are fixed.
A sample mean ¯x is a random variable.
It has its expected value E[¯x], variance Var(¯x), and standard deviation
Var(¯x). These numbers are all fixed
They are also denoted as µ¯x, σ2
¯x, and σ¯x, respectively.
For any population, we have the following theorem:
Proposition 1 (Mean and variance of a sample mean)
Let {Xi}i=1,...,n be a size-n random sample from a population with
mean µ and variance σ2
, then we have
µ¯x = µ, σ2
¯x =
σ2
n
, and σ¯x =
σ
√
n
.
Hypothesis Testing and p-value 15 / 71 Ling-Chieh Kung (NTU IM)](https://image.slidesharecdn.com/tdsa160904combine-160831092419/85/123-2016-9-4-77-320.jpg)
![Sampling Sampling distributions Hypothesis testing p-value, t test, and more
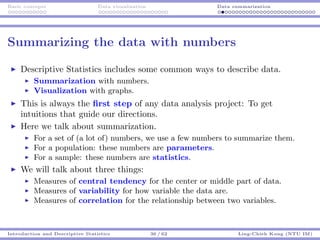
Means and variances of sample means
Do the terms confuse you?
The sample mean vs. the mean of the sample mean.
The sample variance vs. the variance of the sample mean.
By definition, they are:
¯x = 1
n
n
i=1 Xi; a random variable.
E[¯x]; a constant.
s2
= 1
n−1
n
i=1(Xi − ¯x)2
; a random variable.
Var(¯x); a constant.
The sample variance also has its mean and variance.
Hypothesis Testing and p-value 16 / 71 Ling-Chieh Kung (NTU IM)](https://image.slidesharecdn.com/tdsa160904combine-160831092419/85/123-2016-9-4-78-320.jpg)
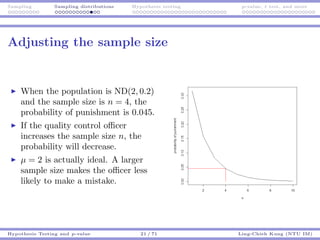
![Sampling Sampling distributions Hypothesis testing p-value, t test, and more
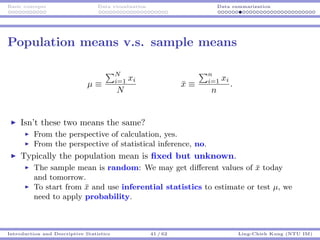
Example: Quality inspection
The weight of a bag of candies follow a normal distribution with mean
µ = 2 and standard deviation σ = 0.2.
Suppose the quality control officer decides to sample 4 bags and
calculate the sample mean ¯x. She will punish me if ¯x /∈ [1.8, 2.2].
Note that my production process is actually “good:” µ = 2.
Unfortunately, it is not perfect: σ > 0.
We may still be punished (if we are unlucky) even though µ = 2.
What is the probability that I will be punished?
We want to calculate 1 − Pr(1.8 < ¯x < 2.2).
We know that µ¯x = µ = 2 and σ¯x = σ√
4
= 0.1.
But we do not know the probability distribution of ¯x!
Hypothesis Testing and p-value 17 / 71 Ling-Chieh Kung (NTU IM)](https://image.slidesharecdn.com/tdsa160904combine-160831092419/85/123-2016-9-4-79-320.jpg)
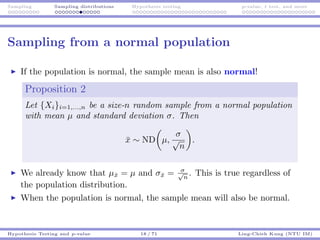
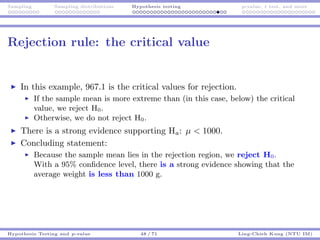
![Sampling Sampling distributions Hypothesis testing p-value, t test, and more
Example revisited: Quality inspection
The weight of a bag of candies follow a normal distribution with mean
µ = 2 and standard deviation σ = 0.2.
Suppose the quality control officer decides to sample 4 bags and
calculate the sample mean ¯x. She will punish me if ¯x /∈ [1.8, 2.2].
What is the probability that I will be punished?
The distribution of the sample mean ¯x is ND(2, 0.1).
Pr(¯x < 1.8) + Pr(¯x > 2.2) ≈ 0.045.
Hypothesis Testing and p-value 19 / 71 Ling-Chieh Kung (NTU IM)](https://image.slidesharecdn.com/tdsa160904combine-160831092419/85/123-2016-9-4-81-320.jpg)


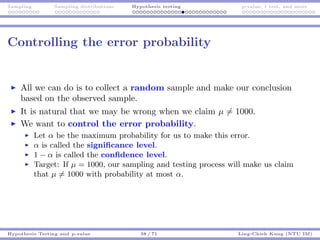


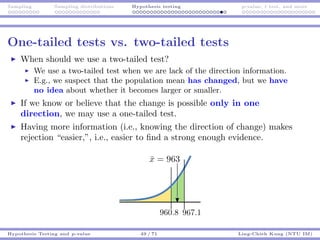


![Sampling Sampling distributions Hypothesis testing p-value, t test, and more
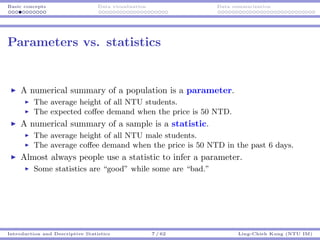
The benefit of using the p-value
In many studies, researchers do not determine the significance level α
before a test is conducted.
They calculate the p-value and then mark the significance of the
result with stars.
One typical way of assigning stars:
p-value Significant? Mark
(0, 0.01] Highly significant ***
(0.01, 0.05] Moderately significant **
(0.05, 0.1] Slightly significant *
(0.1, 1) Insignificant (Empty)
Hypothesis Testing and p-value 56 / 71 Ling-Chieh Kung (NTU IM)](https://image.slidesharecdn.com/tdsa160904combine-160831092419/85/123-2016-9-4-118-320.jpg)


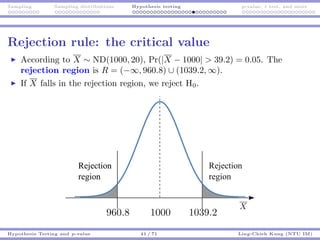
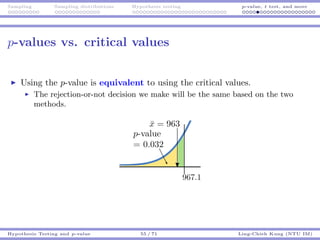
![Sampling Sampling distributions Hypothesis testing p-value, t test, and more
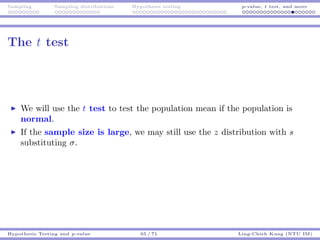
The z and t distributions
Let’s compare Z = X−µ
σ/
√
n
and T = X−µ
S/
√
n
.
Because we do not know σ, we use S to substitute it.
Z ∼ ND(0, 1) and T ∼ t(n − 1).
As the t distribution is a substitution of the z distribution, it is designed
to be also centered at 0: E[T] = E[Z] = 0.
However, as we add one more random variable into the formula (σ is a
known constant), T will be “more random” than Z, i.e.,
Var(T) > Var(Z).
Graphically, t curves will be flatter than the z curve.
Fact: t(n) → ND(0, 1) as n → ∞.
Hypothesis Testing and p-value 63 / 71 Ling-Chieh Kung (NTU IM)](https://image.slidesharecdn.com/tdsa160904combine-160831092419/85/123-2016-9-4-125-320.jpg)


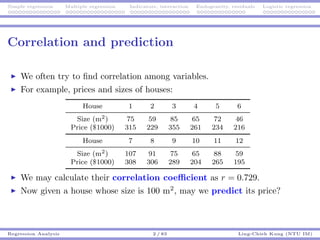


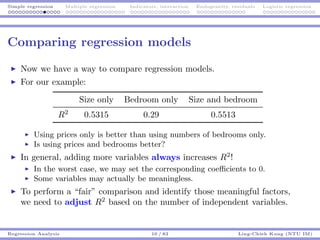


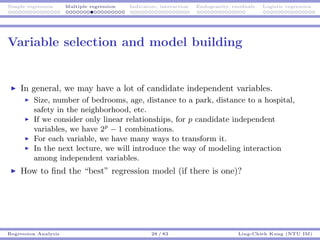


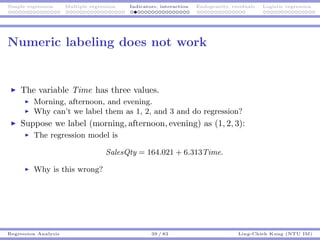


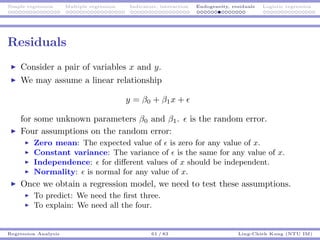


![Simple regression Multiple regression Indicators, interaction Endogeneity, residuals Logistic regression
Logistic regression
The right way to do is to do logistic regression.
Consider the age-survival example.
We still believe that the smaller age increases the survival probability.
However, not in a linear way.
It should be that when one is young enough, being younger does not
help too much.
The marginal benefit of being younger should be decreasing.
The marginal loss of being older should also be decreasing.
One particular functional form that exhibits this
property is
y =
ex
1 + ex
⇔ log
y
1 − y
= x
x can be anything in (−∞, ∞).
y is limited in [0, 1].
Regression Analysis 75 / 83 Ling-Chieh Kung (NTU IM)](https://image.slidesharecdn.com/tdsa160904combine-160831092419/85/123-2016-9-4-208-320.jpg)

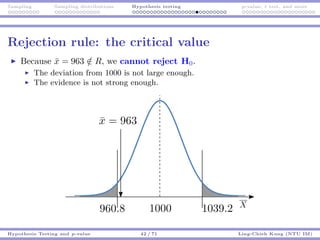
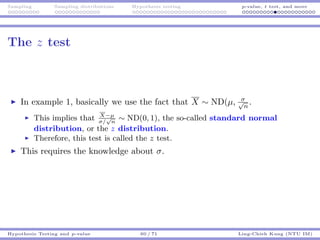
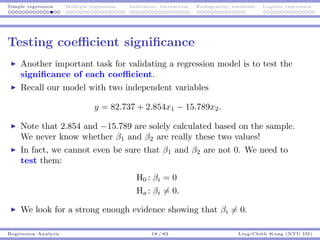
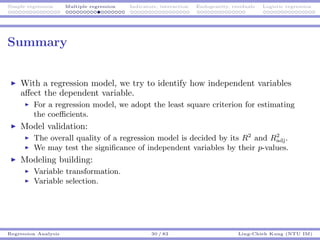
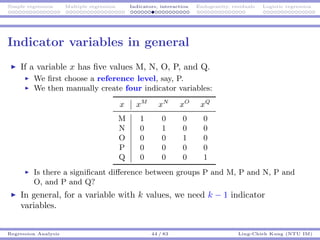
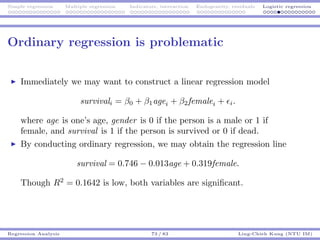
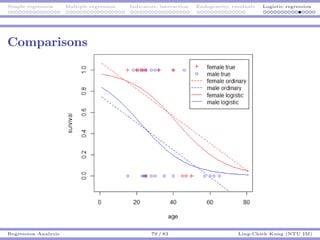
![Simple regression Multiple regression Indicators, interaction Endogeneity, residuals Logistic regression
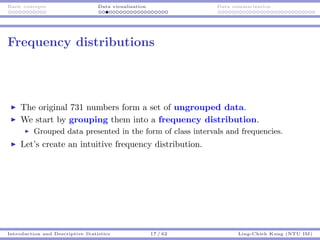
The Logistic regression curve
The curves can be used to
do prediction.
For a man at 80, π is
exp(1.633−0.078×80)
1+exp(1.633−0.078×80) ,
which is 0.0097.
For a woman at 60, π is
exp(1.633−0.078×60+1.597)
1+exp(1.633−0.078×60+1.597) ,
which is 0.1882.
π is always in [0, 1]. There is
no problem for interpreting
π as a probability.
Regression Analysis 78 / 83 Ling-Chieh Kung (NTU IM)](https://image.slidesharecdn.com/tdsa160904combine-160831092419/85/123-2016-9-4-211-320.jpg)


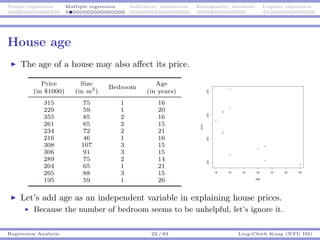
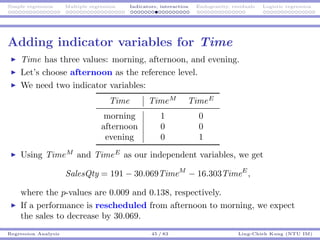
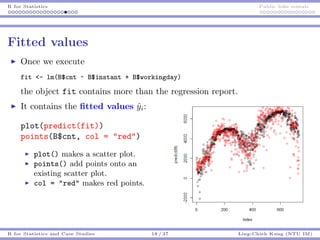
![R for Statistics Public bike rentals
Basic statistics
The mean, median, max, and min expenditure on milk:
mean(W$Milk)
median(W$Milk)
max(W$Milk)
min(W$Milk)
The sample standard deviation of expenditure on milk:
sd(W$Milk)
Counting:
length(W[1, ])
length(W[, 1])
R for Statistics and Case Studies 6 / 37 Ling-Chieh Kung (NTU IM)](https://image.slidesharecdn.com/tdsa160904combine-160831092419/85/123-2016-9-4-222-320.jpg)
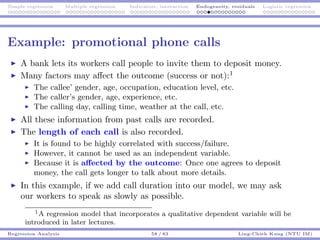
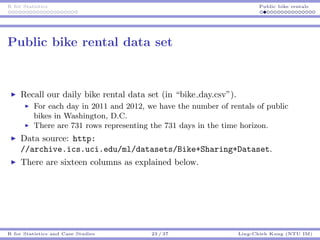
![R for Statistics Public bike rentals
Basic statistics
Correlation coefficient:
cor(W$Milk, W$Grocery)
In fact, you may simply do:
W2 <- W[, 3:8]
cor(W2)
3:8 is a vector (3, 4, 5, 6, 7, 8).
W[, 3:8] is the third to the eighth columns of W.
cor(W2) is the correlation matrix for pairwise correlation coefficients
among all columns of W2.
R for Statistics and Case Studies 7 / 37 Ling-Chieh Kung (NTU IM)](https://image.slidesharecdn.com/tdsa160904combine-160831092419/85/123-2016-9-4-223-320.jpg)

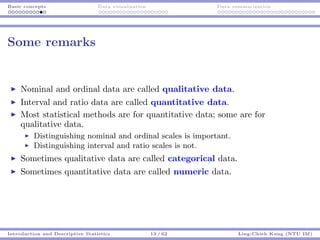
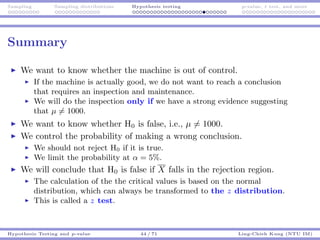
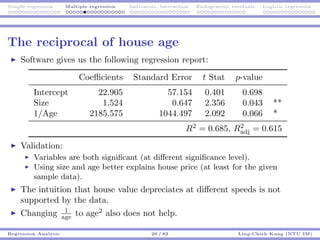
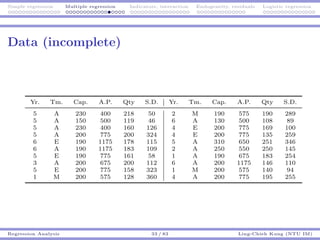
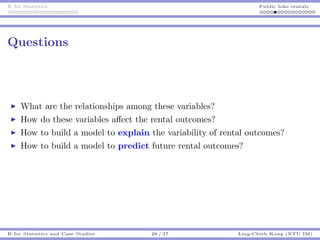
![R for Statistics Public bike rentals
Basic graphs: histograms
hist(W$Milk[which(W$Region == 1)])
R for Statistics and Case Studies 9 / 37 Ling-Chieh Kung (NTU IM)](https://image.slidesharecdn.com/tdsa160904combine-160831092419/85/123-2016-9-4-225-320.jpg)
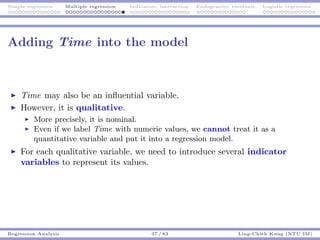
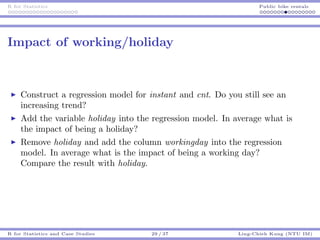
![R for Statistics Public bike rentals
Regression with R
Let’s do regression with R and play with the public bike daily rental
data set.
First, let’s load the data:
B <- read.csv("bike day.csv", header = TRUE)
Take a look at B:
head(B)
mean(B$cnt)
cor(B$cnt, B$temp)
hist(B$cnt)
Try them!
pairs(B)
pairs(B[, 10:16])
R for Statistics and Case Studies 10 / 37 Ling-Chieh Kung (NTU IM)](https://image.slidesharecdn.com/tdsa160904combine-160831092419/85/123-2016-9-4-226-320.jpg)


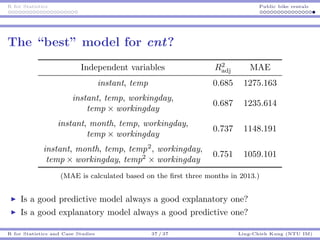

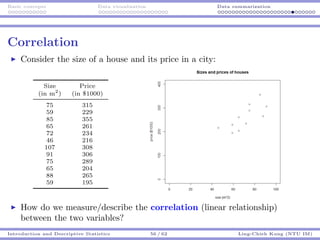
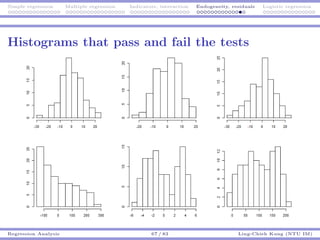
The document provides an introduction to statistics and descriptive statistics, emphasizing the importance of data visualization and summarization for better decision making in engineering. It explains key concepts such as populations, samples, parameters, statistics, and the difference between descriptive and inferential statistics. Various data measurement levels and visualization techniques, including histograms, pie charts, and bar charts, are discussed to effectively present data findings.

![[系列活動] 資料探勘速遊 - Session4 case-studies](https://cdn.slidesharecdn.com/ss_thumbnails/session4-case-studies-170114072124-thumbnail.jpg?width=640&height=640&fit=bounds)


![[DSC 2016] 系列活動:李泳泉 / 星火燎原 - Spark 機器學習初探](https://cdn.slidesharecdn.com/ss_thumbnails/sparkmllib-161026052038-thumbnail.jpg?width=640&height=640&fit=bounds)
![[DSC 2016] 系列活動:吳牧恩、林佳緯 / 用 R 輕鬆做交易策略分析及自動下單](https://cdn.slidesharecdn.com/ss_thumbnails/tradingwithrcombine-160923053815-thumbnail.jpg?width=640&height=640&fit=bounds)


![[台灣人工智慧學校] 人工智慧技術發展與應用](https://cdn.slidesharecdn.com/ss_thumbnails/version5-final-190319060225-thumbnail.jpg?width=640&height=640&fit=bounds)
![[台灣人工智慧學校] 執行長報告](https://cdn.slidesharecdn.com/ss_thumbnails/openingsw-190315170512-thumbnail.jpg?width=640&height=640&fit=bounds)
![[台灣人工智慧學校] 工業 4.0 與智慧製造的發展趨勢與挑戰](https://cdn.slidesharecdn.com/ss_thumbnails/20190316jyh-horngchou-190315170336-thumbnail.jpg?width=640&height=640&fit=bounds)
![[台灣人工智慧學校] 開創台灣產業智慧轉型的新契機](https://cdn.slidesharecdn.com/ss_thumbnails/aiotforaiabytedchangho-190227081005-thumbnail.jpg?width=640&height=640&fit=bounds)
![[台灣人工智慧學校] 開創台灣產業智慧轉型的新契機](https://cdn.slidesharecdn.com/ss_thumbnails/aiinhealthcare-20190216victoria-v6-190227081004-thumbnail.jpg?width=640&height=640&fit=bounds)
![[台灣人工智慧學校] 台北總校第三期結業典禮 - 執行長談話](https://cdn.slidesharecdn.com/ss_thumbnails/tp3closingsw-190126030359-thumbnail.jpg?width=640&height=640&fit=bounds)
![[TOxAIA台中分校] AI 引爆新工業革命,智慧機械首都台中轉型論壇](https://cdn.slidesharecdn.com/ss_thumbnails/aia-chen-190116063635-thumbnail.jpg?width=640&height=640&fit=bounds)
![[TOxAIA台中分校] 2019 台灣數位轉型 與產業升級趨勢觀察](https://cdn.slidesharecdn.com/ss_thumbnails/to-sheng-190116063620-thumbnail.jpg?width=640&height=640&fit=bounds)
![[TOxAIA台中分校] 智慧製造成真! 產線導入AI的致勝關鍵](https://cdn.slidesharecdn.com/ss_thumbnails/thu-hsu-190116063619-thumbnail.jpg?width=640&height=640&fit=bounds)
![[台灣人工智慧學校] 從經濟學看人工智慧產業應用](https://cdn.slidesharecdn.com/ss_thumbnails/1-the-application-of-ai-industry-from-economics-190108064940-thumbnail.jpg?width=640&height=640&fit=bounds)
![[台灣人工智慧學校] 台中分校第二期開學典禮 - 執行長報告](https://cdn.slidesharecdn.com/ss_thumbnails/tc2-opening1-compressed-190107034100-thumbnail.jpg?width=640&height=640&fit=bounds)

![[台中分校] 第一期結業典禮 - 執行長談話](https://cdn.slidesharecdn.com/ss_thumbnails/sw-ppt-181217031715-thumbnail.jpg?width=640&height=640&fit=bounds)
![[TOxAIA新竹分校] 工業4.0潛力新應用! 多模式對話機器人](https://cdn.slidesharecdn.com/ss_thumbnails/20181206004-181210031031-thumbnail.jpg?width=640&height=640&fit=bounds)
![[TOxAIA新竹分校] AI整合是重點! 竹科的關鍵轉型思維](https://cdn.slidesharecdn.com/ss_thumbnails/20181206002-181210031031-thumbnail.jpg?width=640&height=640&fit=bounds)
![[TOxAIA新竹分校] 2019 台灣數位轉型與產業升級趨勢觀察](https://cdn.slidesharecdn.com/ss_thumbnails/20181206-001-181210031002-thumbnail.jpg?width=640&height=640&fit=bounds)
![[TOxAIA新竹分校] 深度學習與Kaggle實戰](https://cdn.slidesharecdn.com/ss_thumbnails/20181206003-181210031001-thumbnail.jpg?width=640&height=640&fit=bounds)
![[台灣人工智慧學校] Bridging AI to Precision Agriculture through IoT](https://cdn.slidesharecdn.com/ss_thumbnails/hc-2nd-openingai-school-181206104858-thumbnail.jpg?width=640&height=640&fit=bounds)
![[2018 台灣人工智慧學校校友年會] 產業經驗分享: 如何用最少的訓練樣本,得到最好的深度學習影像分析結果,減少一半人力,提升一倍品質 / 李明達](https://cdn.slidesharecdn.com/ss_thumbnails/lee-181130104127-thumbnail.jpg?width=640&height=640&fit=bounds)
![[2018 台灣人工智慧學校校友年會] 啟動物聯網新關鍵 - 未來由你「喚」醒 / 沈品勳](https://cdn.slidesharecdn.com/ss_thumbnails/20181117shengfn-181130083931-thumbnail.jpg?width=640&height=640&fit=bounds)


![[DSC Europe 25] Mijat Kustudic - Building Financial Intelligence with AI Agen...](https://cdn.slidesharecdn.com/ss_thumbnails/38y2lb5lse6wstegtvas-3-mijat-kustudic-building-financial-intelligence-with-ai-agents-260114111931-1a4783ce-thumbnail.jpg?width=640&height=640&fit=bounds)
![[DSC Europe 25] Stefan Brankovic - #ResumeIsDead. AI-Powered Interviews and C...](https://cdn.slidesharecdn.com/ss_thumbnails/qnmbsv0xq3uysdrq3sev-2-stefan-brankovic-job-bolt-260114111931-a065aa3d-thumbnail.jpg?width=640&height=640&fit=bounds)


![[DSC Europe 25] Danilo Djukanovic - From Vibes to KPIs: Turning Culture Into ...](https://cdn.slidesharecdn.com/ss_thumbnails/inqestws5wf0cik2glgv-3-danilo-djukanovic-from-vibes-to-kpis-presentation-260114111931-dacff81f-thumbnail.jpg?width=640&height=640&fit=bounds)


