Downloaded 40 times

![Accuracy of estimates (standard error) 2 of 2
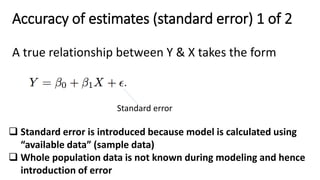
Standard errors can be used to compute confidence intervals
For linear regression, the 95 % confidence interval for β1, β0
approximately takes the form:
In the case of the advertising data, the 95 % confidence interval for
β0 is [6.130, 7.935] and the 95 % confidence interval for β1 is
[0.042, 0.053].](https://image.slidesharecdn.com/appliedstats-intro-170325201606/85/Machine-learning-algorithms-and-business-use-cases-30-320.jpg)


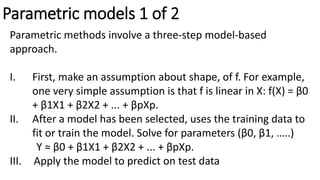
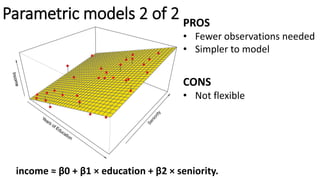
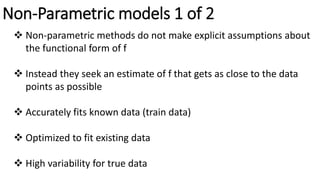
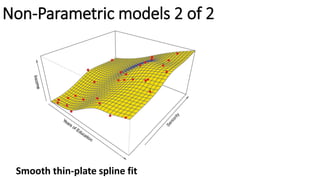
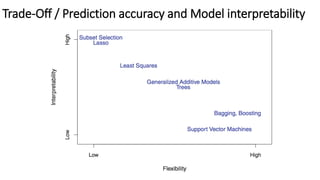
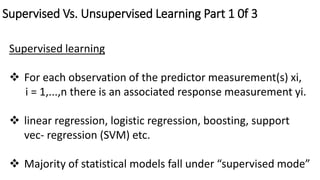
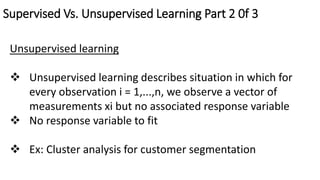
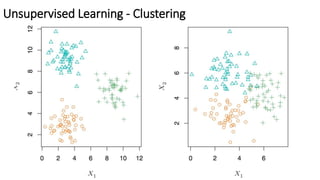
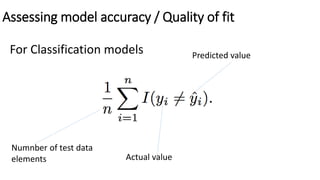
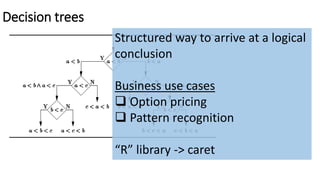
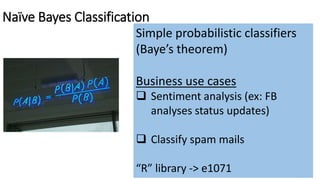
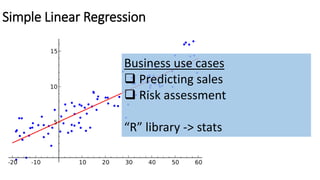
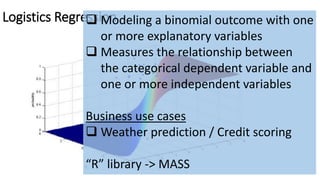
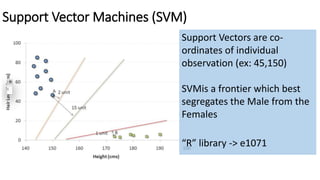
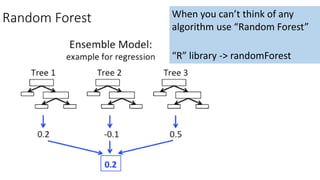
The document outlines methods of statistical learning, including parametric and non-parametric approaches, to predict outcomes based on input variables in a business context. It discusses the differences between supervised and unsupervised learning, along with various algorithms and their applications, such as regression and classification. Additionally, it covers model accuracy assessment techniques and the author's background in the technology industry.