Download to read offline
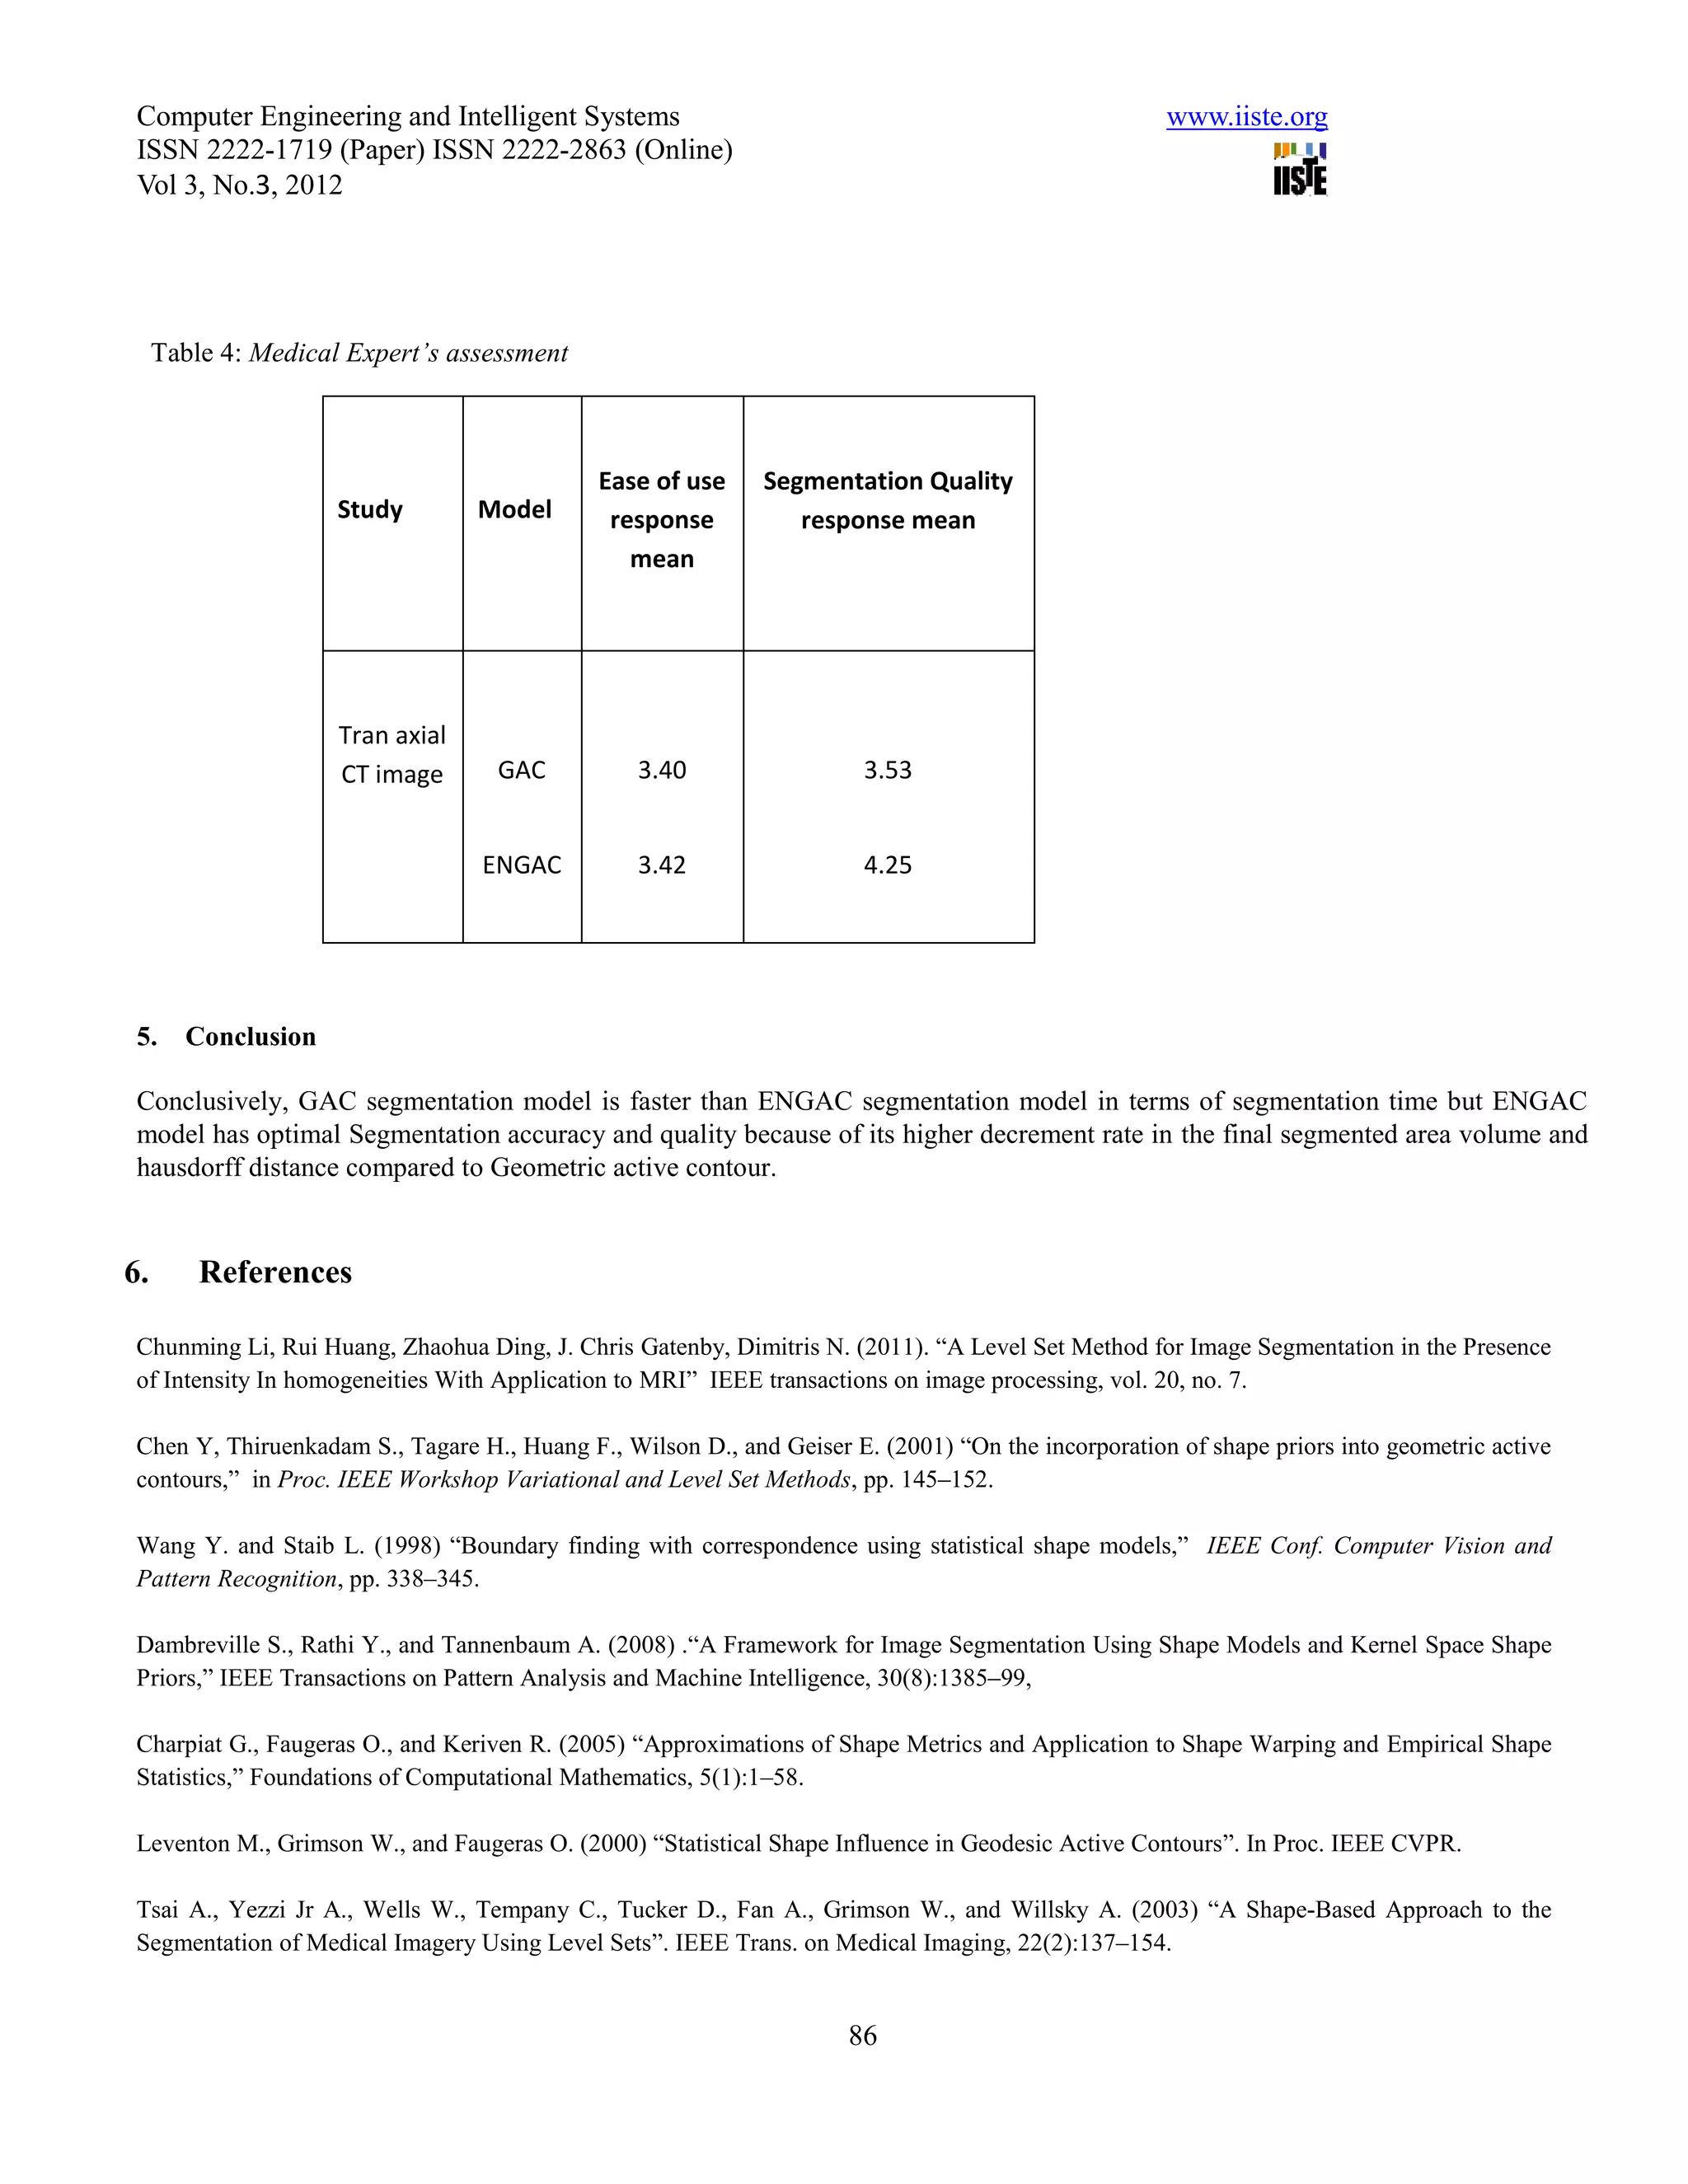

This document summarizes a study that evaluated the performance of two medical image segmentation models: Geometric Active Contour (GAC) and Enhanced Geometric Active Contour (ENGAC). ENGAC was formulated by combining GAC with Kernel Principal Component Analysis to introduce more shape variability. The models were tested on brain MRI and CT images. ENGAC showed improved segmentation accuracy and ability to extract shapes compared to GAC, demonstrating the effectiveness of combining GAC with KPCA for medical image segmentation.