Downloaded 12 times
![Computer Engineering and Intelligent Systems www.iiste.org
ISSN 2222-1719 (Paper) ISSN 2222-2863 (Online)
Vol 3, No.3, 2012
Optimal Nonlocal means algorithm for denoising ultrasound
image
Md. Motiur Rahman 1 , Md. Gauhar Arefin1*, Mithun Kumar PK.1 , Dr. Md. Shorif Uddin2
1. Dept. of Computer Science & Engineering , Mawlana Bhashani Science and Technology
University, Santosh, Tangail-1902, Bangladesh
2. Dept. of Computer Science & Engineering , Jahangirnagar University, Savar, Dhaka-1342 ,
Bangladesh
* E-mail: garefin005@gmail.com
Abstract
We propose a new measure for denoising image by calculating mean distance of all pixels in an image in
non-local means (NL-means) algorithm. We compute and analyze the original NL-means algorithm which
total all the distance of the patches but, our proposed algorithm calculates the mean value of all distance of
all the patches and then than get the sum of all distance. Our proposed algorithm exhibit better result with
comparison of the existing NL-means algorithm.
Keywords: NL-means, Patches, Mean Value, Measurement Matrix.
1. Introduction
Non-local means algorithm systematically use all possible self-predictions that an image can be provided
[1]. But local filters or frequency domain filters are not avail to do that. Non-Local means (NL-means)
approach introduced by Buades et al. to denoise 2D natural images corrupted by an additive white Gaussian
noise [2]. NL-means filter normally calculate the total patch distances of the image, computed a weighted
average of all the pixels in the image and denoise the image [1][3]. We propose a method that could
denoise the image by calculating mean value of all patch distances of the image and denoise the image
better than previous filter.
The aim is to recover the original image from a noisy measurement,
v(i) = u(i) + n(i) … ……………(1)
where, v(i) is the result value, u(i) is the “original” value and n(i) is the noise perturbation at a pixel i.
The best way to model the effect of noise on a digital image is to add some gaussian white noise. In that
case, n(i) are i.i.d. Gaussian values with zero mean and variance σ2 [2].
The denoising methods must not change the original image. But, for the better understanding of an
image those method allows to loss data to reduce the noise from the image [4]. Human vision can only
understand the better recognition of the intensity of the pixel value of an image [5][6]. That’s why, the
propose method is allows calculate mean patch distances, avoiding the total patch distances.
56](https://image.slidesharecdn.com/11-optimalnonlocalmeansalgorithmfordenoisingultrasoundimage-120513004000-phpapp01/75/11-optimal-nonlocal-means-algorithm-for-denoising-ultrasound-image-1-2048.jpg)
![Computer Engineering and Intelligent Systems www.iiste.org
ISSN 2222-1719 (Paper) ISSN 2222-2863 (Online)
Vol 3, No.3, 2012
Section II. gives the introduction of the NL-means algorithm. Section III. discuses the NL-means algorithm
with mean distance calculation of pixel neighborhoods [7]. Section IV. compare the performance of the
NL-means algorithm and proposed NL-mean algorithm.
2. Non-Local Means Algorithm
2.1. Non local means
Recently, a new patch-based non local recovery paradigm has been proposed by Buades et al [2]. This new
paradigm replaces the local comparison of pixels by the non local comparison of patches. The current pixel
does not depend on the distance between neither spatial distances nor in intensity distance. NL-means filter
analyzes the patterns around the pixels.
2.2 Algorithm
In the actual NL-means algorithm filter the restored intensity NL(u)(xi) of pixel xiЄΩdim, is the weighted
average of all the pixel intensities u(xi) in the image Ωdim (a bounded
dim dim
domain Ω ⊆ R ):
NL (u )( x ) = ∑ W ( xi , x j )u ( x j )......... .......... ..(12 )
………….…….(2
x j ∈Ω
dim
where the family of weights {w(xi,xj)}j depend on the similarity between the pixels xi and xj and satisfy the
usual conditions 0 ≤ w(xi, xj) ≤ 1 and w(xi,xj)=1. The weight evaluates the similarity between the intensities
of the local neighborhoods (patches) Ni and Nj centered on pixels xi and xj.
2
For each pixel xj in ∆i, the Gaussian-weighted Euclidean distance ║.║ 2 ,a is computed between the two
patches u(Nj) and u(Ni) of image as explained in [8]. This distance is the traditional L2-norm convolved
with a Gaussian kernel of standard deviation a. The kernel is used to assign spatial weights to the patch
elements. The central pixels in the patch contribute more to the distance than the pixels surrounded of the
central pixel.
The weights w(xi, xj) are then computed as follows:
||u ( N i ) − u ( N j )||2,a
2
1
W ( xi , x j ) = exp− 2
..................(13)
…………..(3)
Zi h
where Zi is the normalizing constant and h acts as a filtering parameter controlling the decay of the
exponential function.
|| u ( N i ) − u ( N j ) || 2 ,a
2
1
W ( x i , x j i =∑ exp −
Z) = exp 2
.......... ........( 13 )
……….....(4)
Zi h
57](https://image.slidesharecdn.com/11-optimalnonlocalmeansalgorithmfordenoisingultrasoundimage-120513004000-phpapp01/75/11-optimal-nonlocal-means-algorithm-for-denoising-ultrasound-image-2-2048.jpg)
![Computer Engineering and Intelligent Systems www.iiste.org
ISSN 2222-1719 (Paper) ISSN 2222-2863 (Online)
Vol 3, No.3, 2012
The NL-means not only compares the gray level in a single point but also compute the geometrical
configurations of whole neighborhoods [4]. Fig. 1 showing this fact, the pixel q3 has the same gray level
value of pixel p, but the neighborhoods are much different and therefore the weight w(p, q3) is nearly
zero[9][10].
3. NL-means algorithm with mean distance calculation
In previous section we discuss about the original algorithm of NL-means. In the equation (2) it estimated
value NL(u)(xi), for a pixel xi, is computed as a weighted average of all the pixels in the image. In this
proposed algorithm of NL-means we determinate the value NL(u)(xi), for a pixel xi, is calculate weighted
mean distance of all the pixels in the image. The proposed algorithm is only compute the mean distances of
the neighborhoods, total all the distances and then it averaged all the weights of neighborhoods.
In NL-means the current pixel does not depend on the distance between neither spatial distances nor in
intensity distance. This filter analyzes the patterns around the pixels. The similarity between two pixels xi
and xj depends on the similarity of the intensity gray level vectors u(Ni ) and u(Nj), where Nk denotes a
square neighborhood of fixed size and centered at a pixel k [3]. This similarity is determinate as a
decreasing function of the weighted Euclidean distance, of equation (3), where a>0 is the standard
deviation of the Gaussian kernel. In the distance calculation we compute mean distance of all
neighborhoods and then calculate the total of all distances.
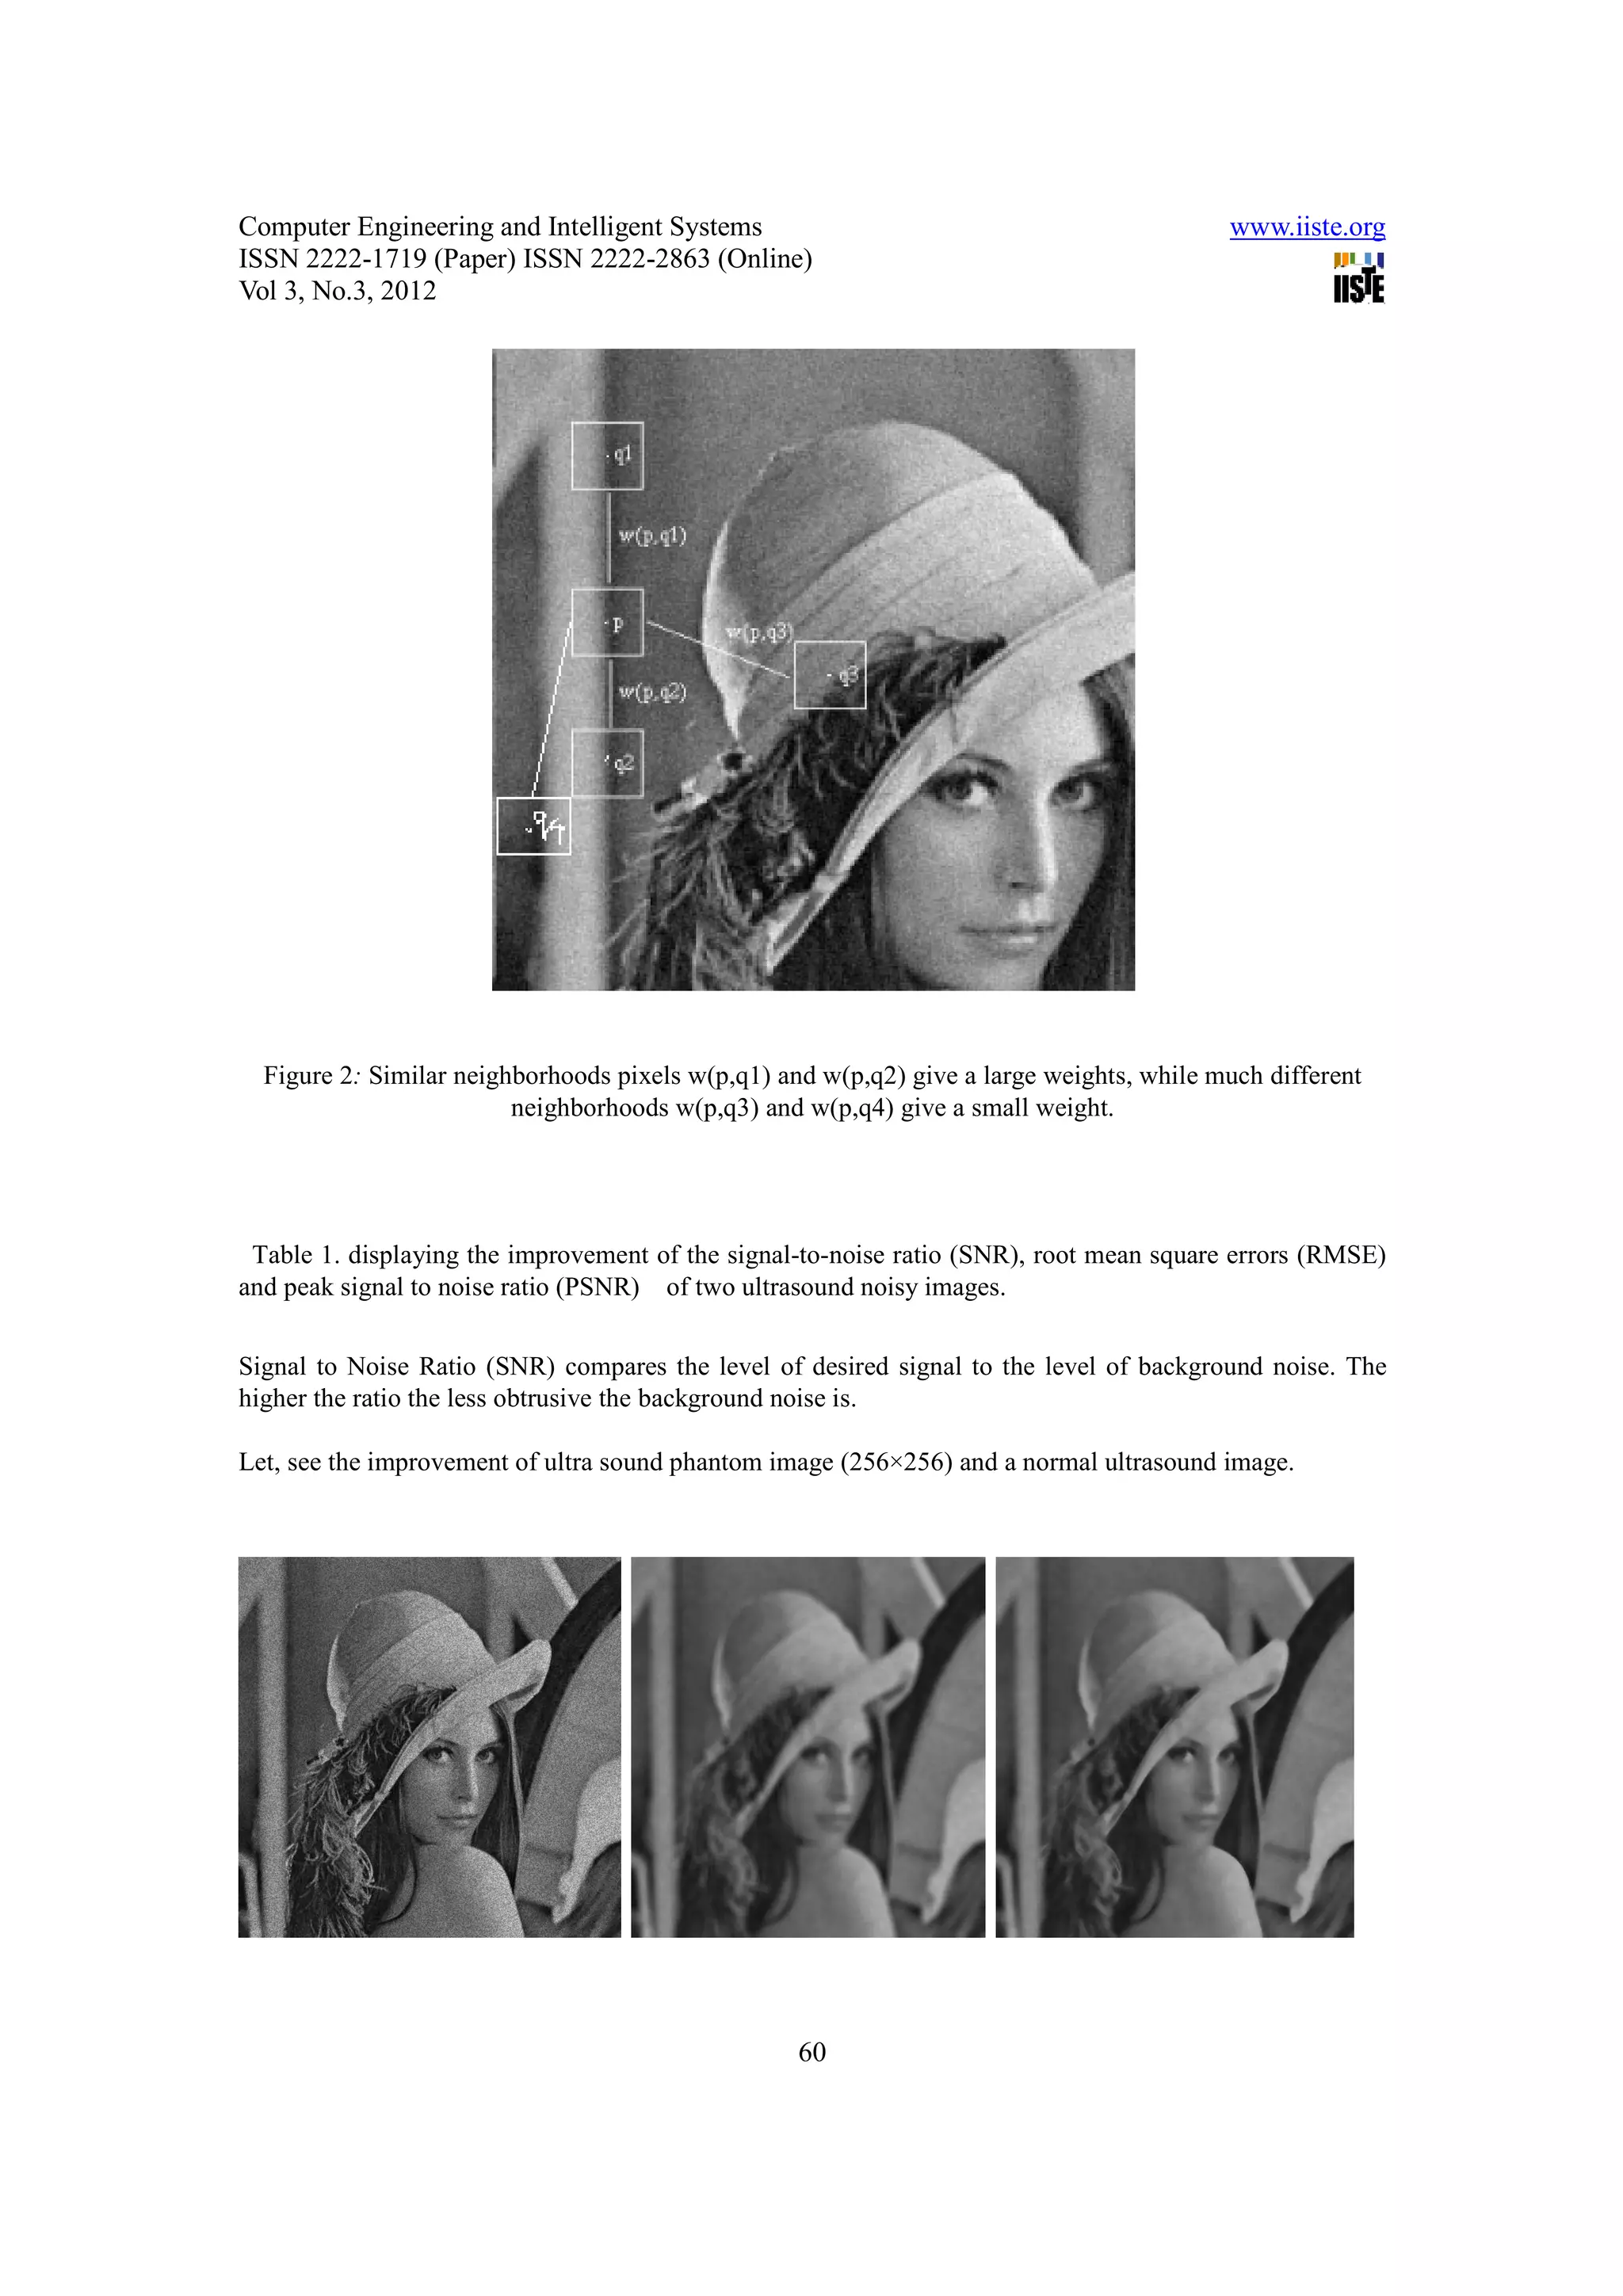
Figure 1: Similar neighborhoods pixels give a large weight, w(p,q1) and w(p,q2), while much
different neighborhoods give a small weight w(p,q3).
Mean ( ||u(Ni)−u(N j)||2,a ) * size(patch)
2
1
W(xi , x j) = exp− 2
..........
........( )
13
Zi h
58](https://image.slidesharecdn.com/11-optimalnonlocalmeansalgorithmfordenoisingultrasoundimage-120513004000-phpapp01/75/11-optimal-nonlocal-means-algorithm-for-denoising-ultrasound-image-3-2048.jpg)
![Computer Engineering and Intelligent Systems www.iiste.org
ISSN 2222-1719 (Paper) ISSN 2222-2863 (Online)
Vol 3, No.3, 2012
After calculating the mean distance of the intensities of the local neighborhoods (patches) Ni and Nj
centered on pixels xi and xj, it need to multiply with the size of local neighborhood, because it need to have
actual distances of all neighborhoods.
From Figure 2. we can read the pixel q4 has the same gray level value of pixel p, but it’s neighborhoods
make the w(p,q4) is smaller weighted. Here our propose NL-means algorithm turn the q4 pixel intensity
less and q3 pixel intensity high [11]. That’s why visually the image is more readable and it makes the noise
removed.
The original NL-means algorithm donoises an image by smoothing and calculating the total distances of
neighborhoods [4]. It improves the visibility of an image than local filters. But the propose algorithm
compute the mean distance of all neighborhoods, then calculate the total and makes the image more visible
and more easily edge detectable [10].
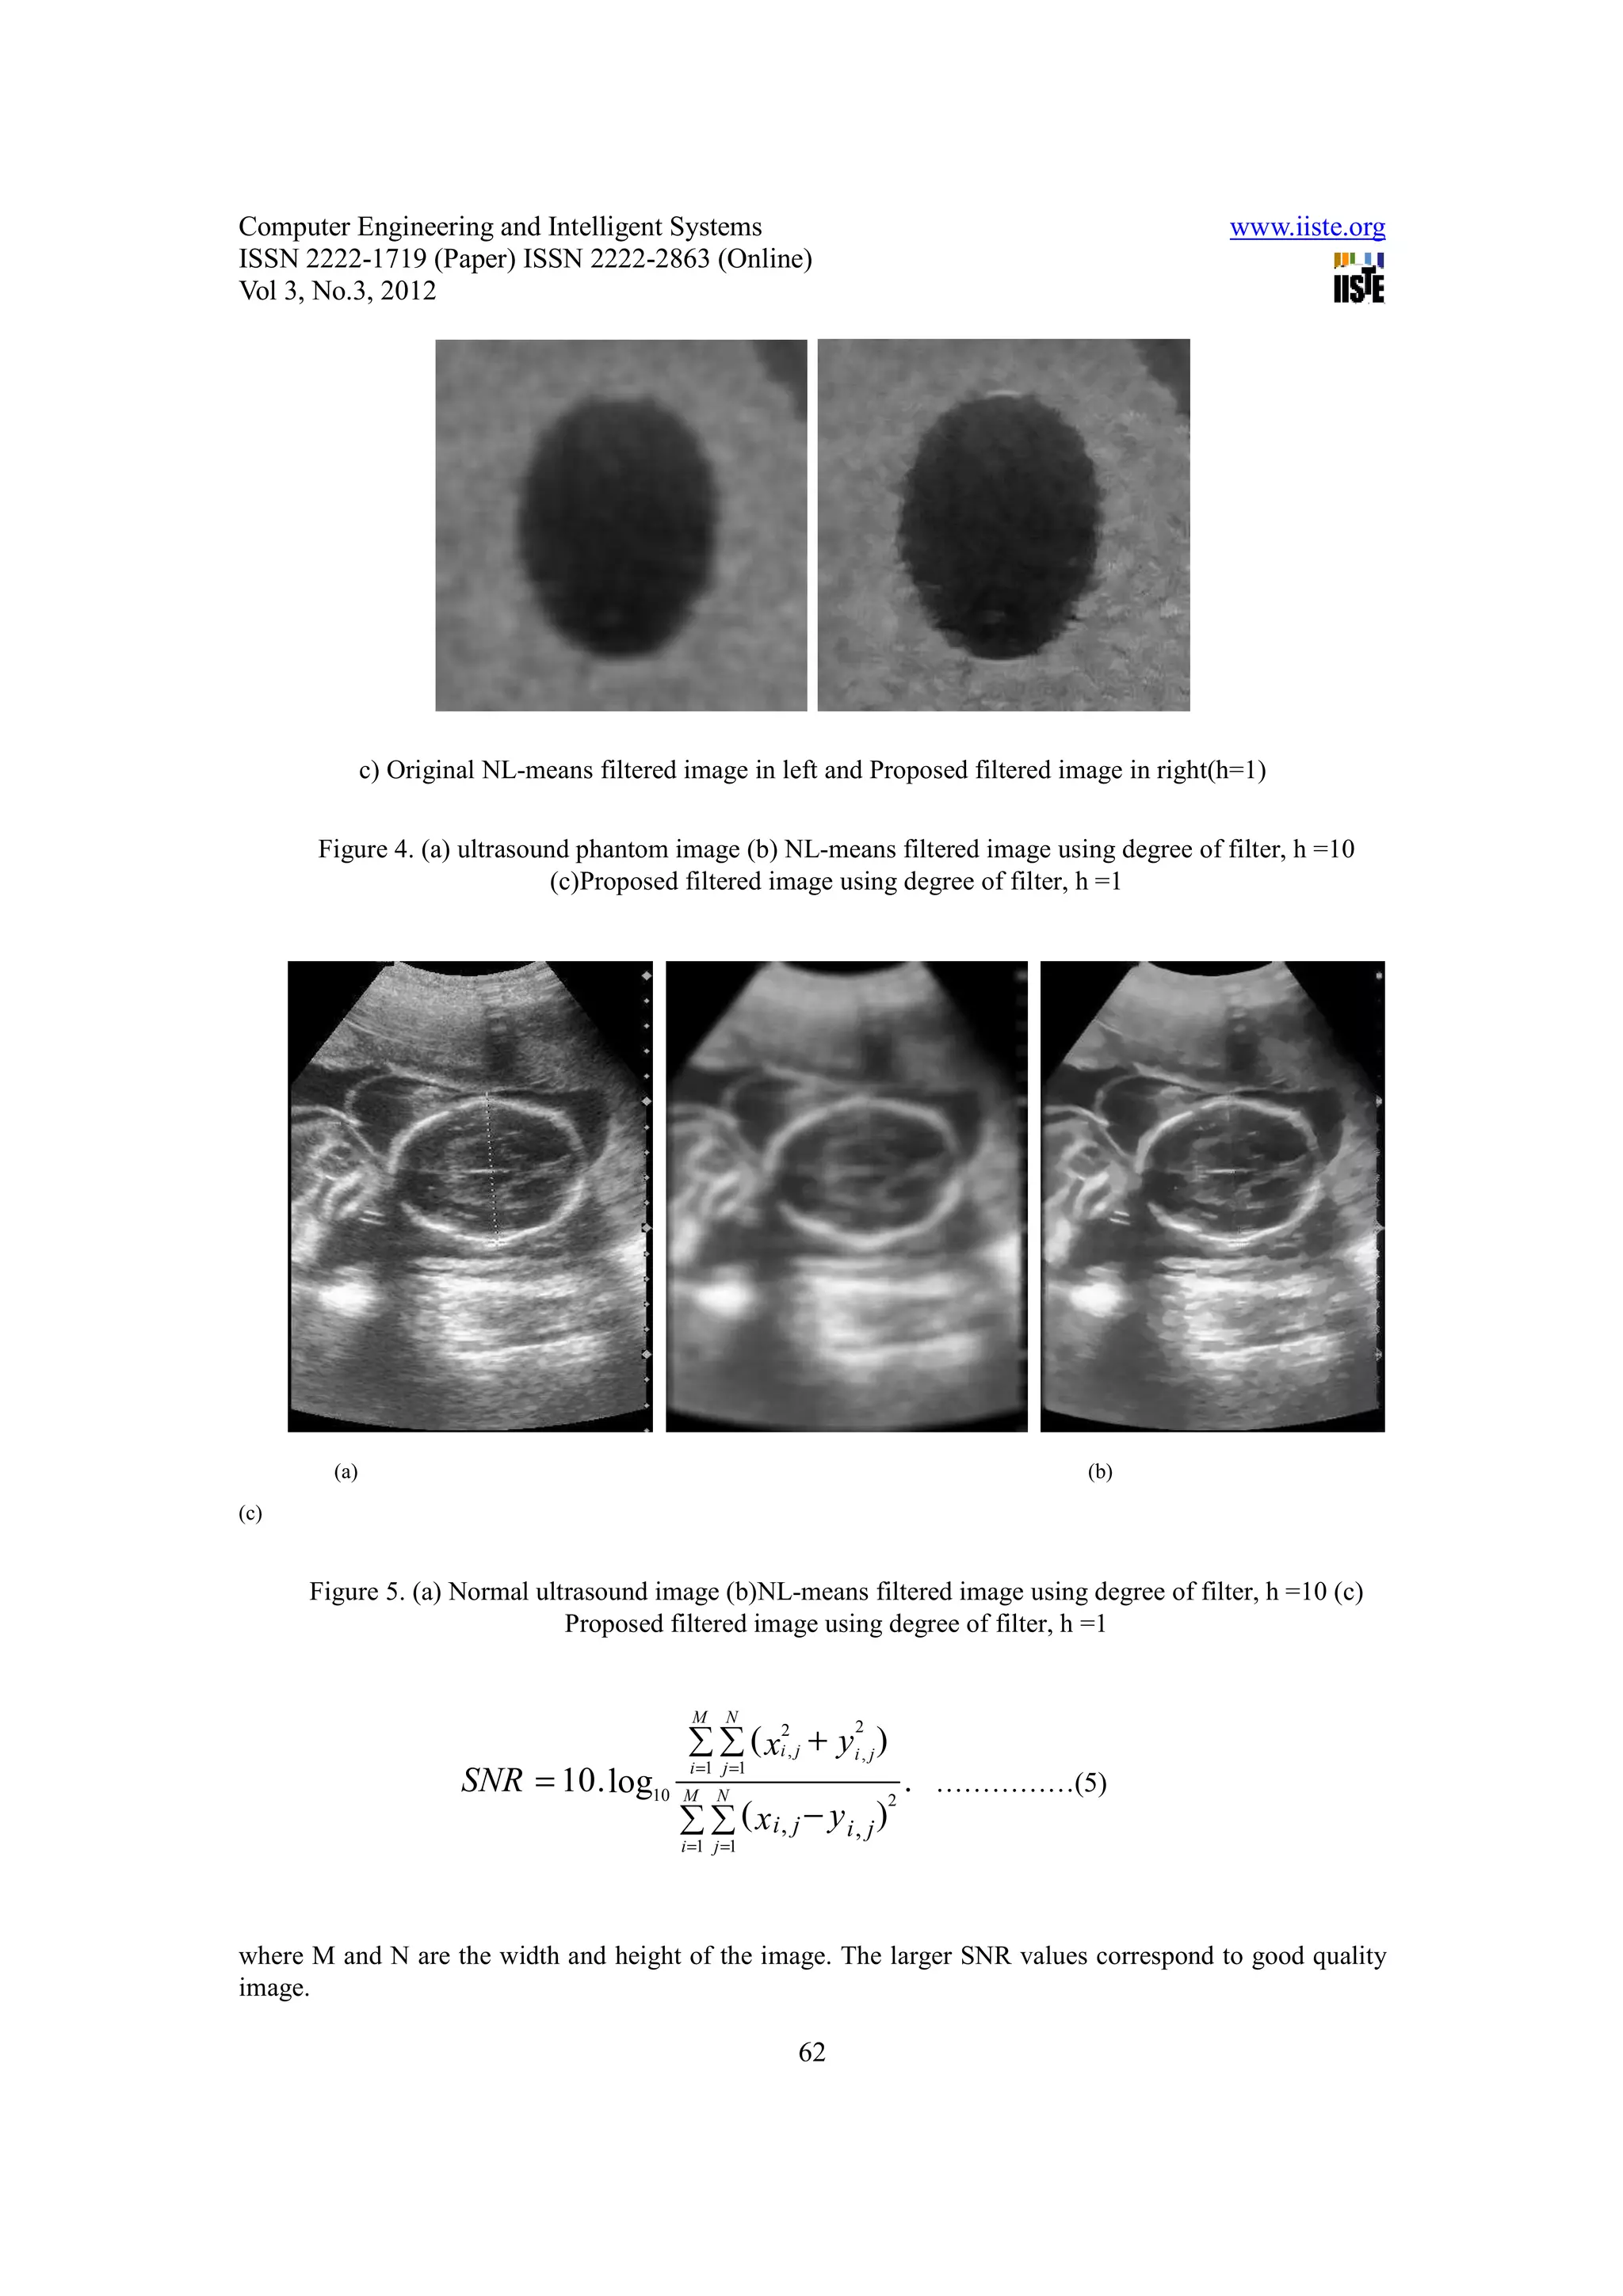
4. Performance and analysis
In this section we will compare NL-means algorithm and proposed algorithm under three well defined
criteria: the noise removing, the visual quality of the restored image and the mean square error, that is, the
Euclidean difference between the restored and original images [5][12].
For programming and calculation purposes of the NL-means algorithm, in a larger “search window” of
size S×S pixels we restrict the search of similar windows [13]. In all the experimentation we have fixed a
similarity square neighborhood Ni of 5×5 pixels and a search window of 11×11 pixels. If N2 is the number
of pixels of the image, then the final complexity of the algorithm is about 25 × 121 × N2 [3].
Large Euclidean distances lead to nearly zero weights acting as an automatic threshold because the fast
decay of the exponential kernel.
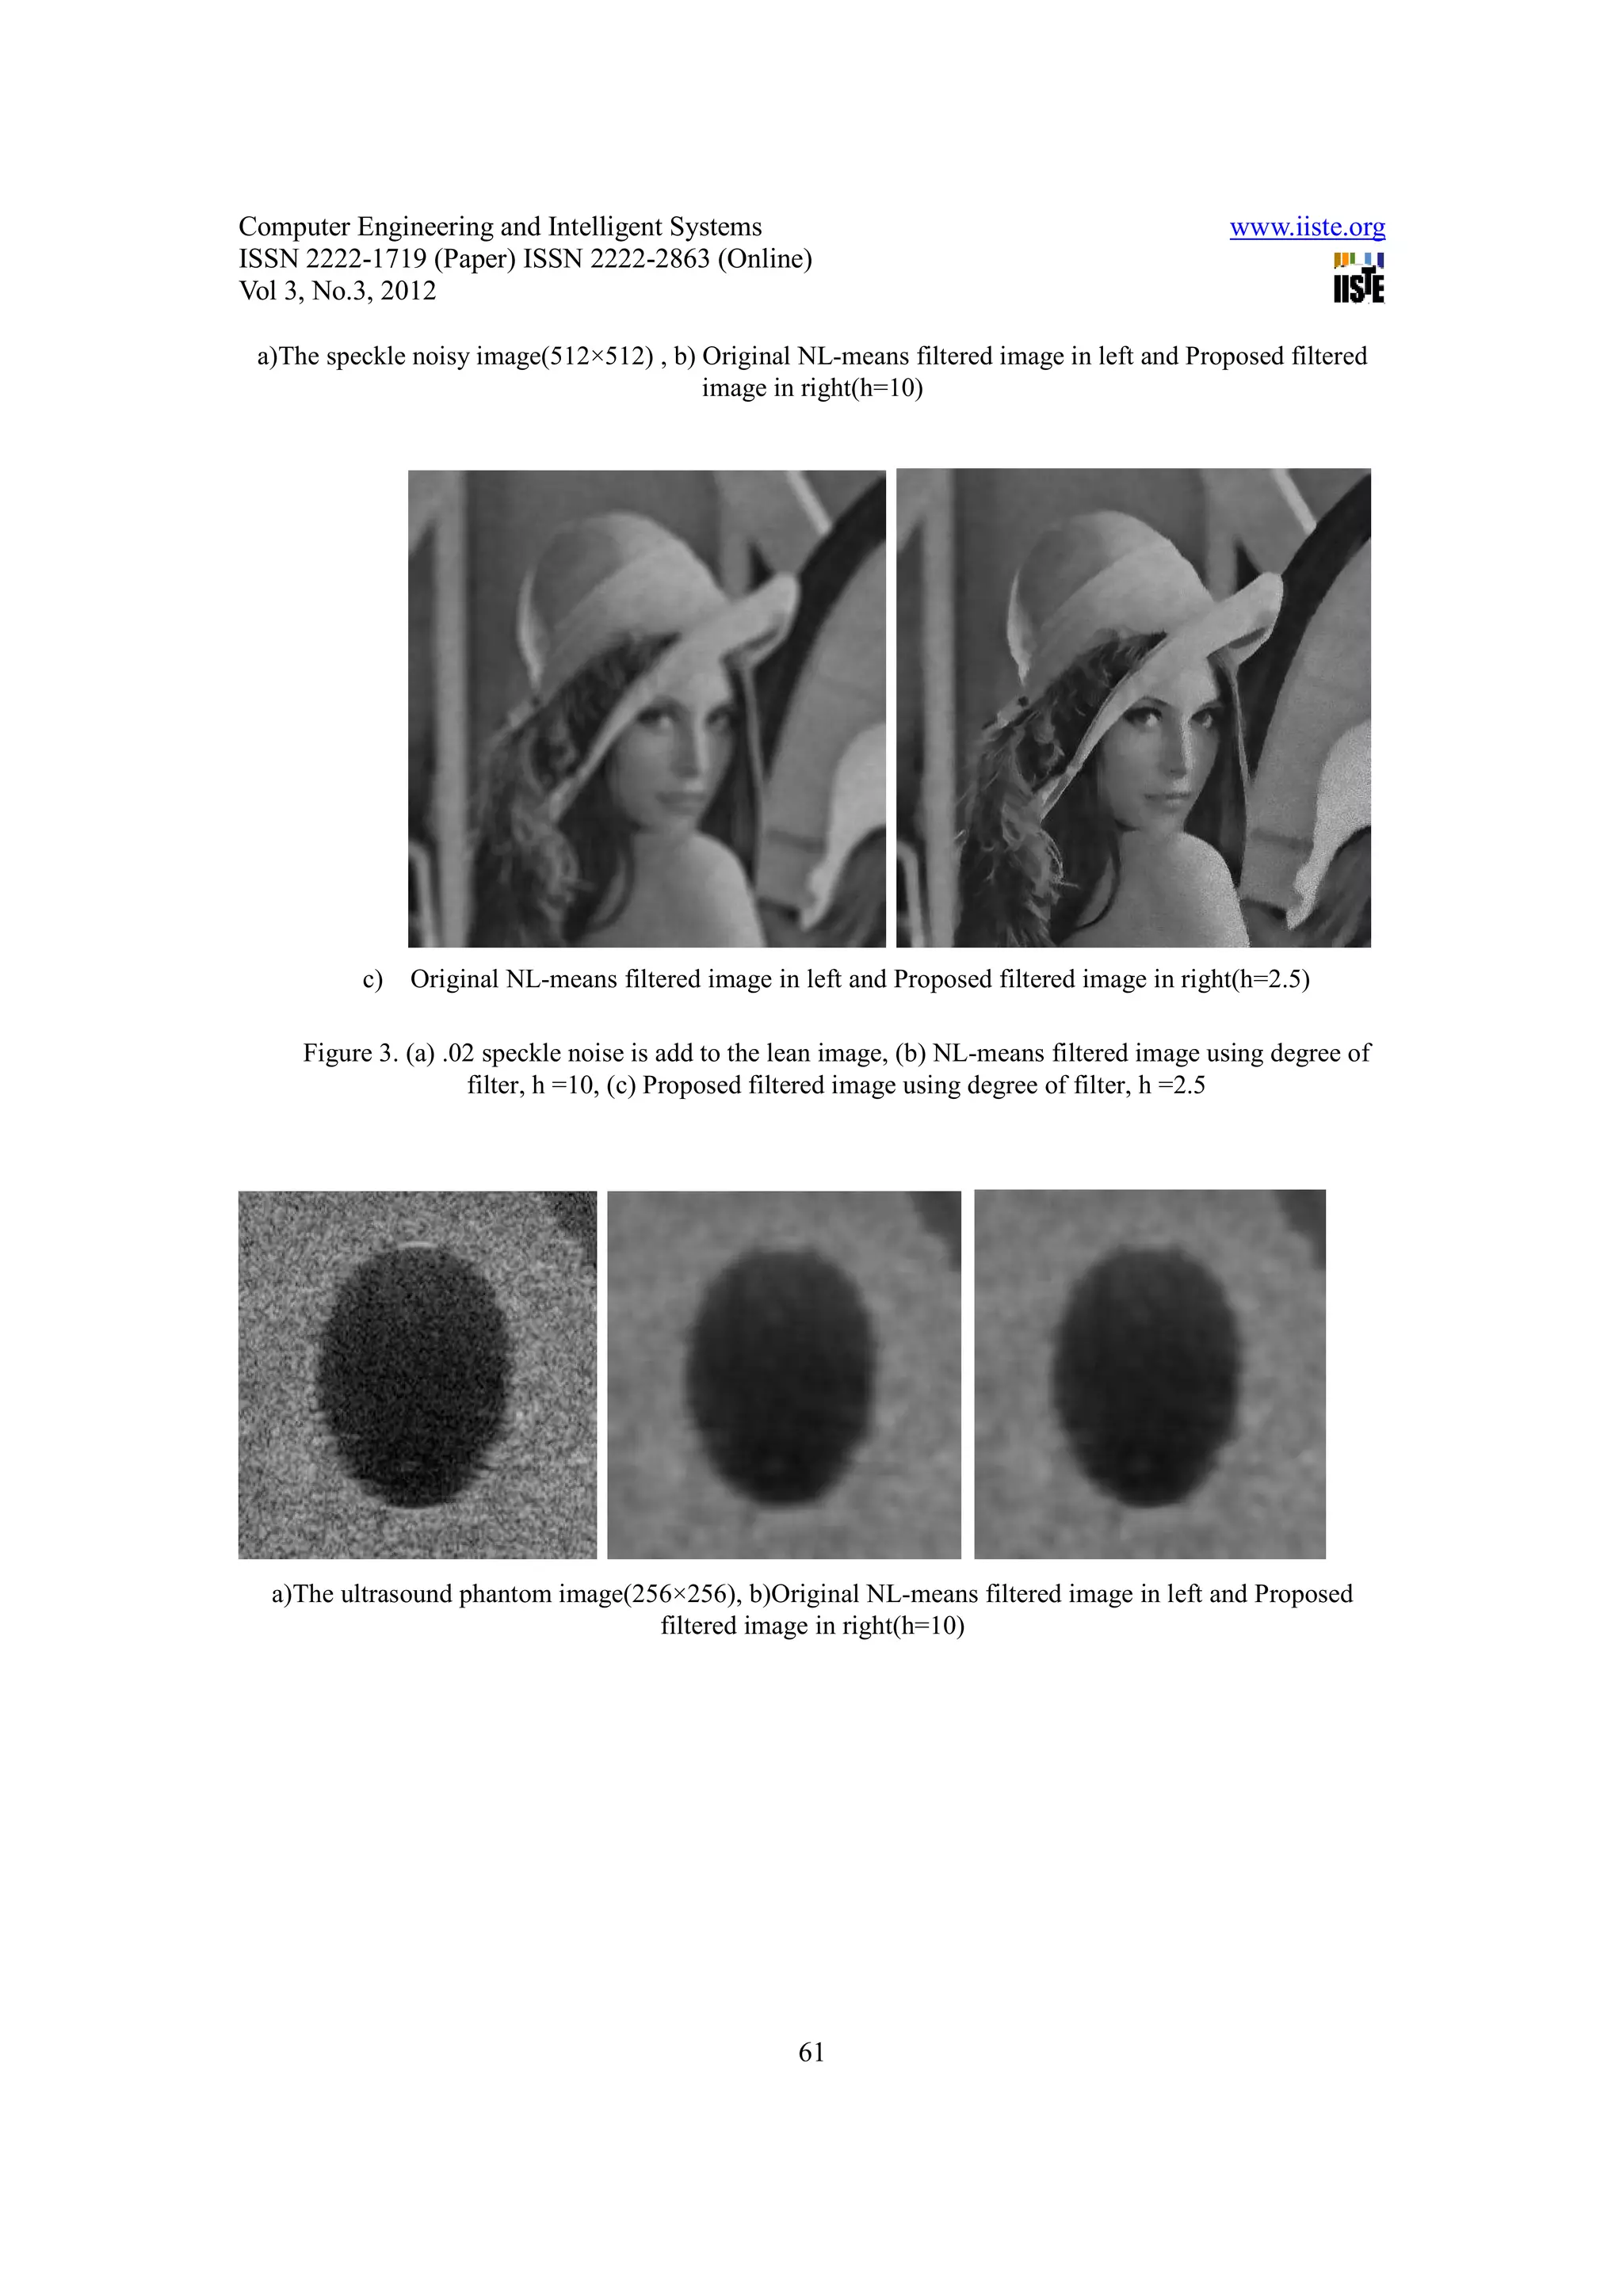
These formulas are corroborated by the visual experiments of Figure 3. This figure displays the visual
different
between those methods for the standard image Lena(512 x 512). In this figure we can identify the
NL-means filter reduce the noise and blur the image and the propose filter reduce the noise [4], blur the
image and detected some edges of the image. It makes the image quality increase and more suitable for
human eyes.
59](https://image.slidesharecdn.com/11-optimalnonlocalmeansalgorithmfordenoisingultrasoundimage-120513004000-phpapp01/75/11-optimal-nonlocal-means-algorithm-for-denoising-ultrasound-image-4-2048.jpg)
![Computer Engineering and Intelligent Systems www.iiste.org
ISSN 2222-1719 (Paper) ISSN 2222-2863 (Online)
Vol 3, No.3, 2012
References
Pierrick Coup´e1,2,4, Pierre Hellier1,2,4, Charles Kervrann3,5 and Christian Barillot 1, 2,
4(2009),“NonLocal Means-based Speckle Filtering for Ultrasound Images”,“IEEE Transactions on
Image Processing 2009;18(10):2221-9", DOI :10.1109/TIP.2024064.
A. Buades, B. Coll, and J. M. Morel(2005) “A review of image denoising algorithms, with a new one,”
Multiscale Modeling & Simulation, vol. 4, no. 2, pp. 490–530.
B. Coll and J.-M. Morel(2004), "A non-local algorithm for image denoising", SIAM J. Multiscale Model.
Simul., vol. 4, pp. 490 .
A. Buades, B. Coll, and J. Morel(2004). On image denoising methods. Technical Report 2004-15, CMLA.
Z. Wang, A. C. Bovik, H. R. Sheikh, and E. P. Simoncelli(2004), "Image quality assessment: From error
visibility to structural similarity", IEEE Transactios on Image Processing, vol. 13, no. 4, pp. 600-612,
Apr. 2004
R C Gonzalez, and R E Woods(2002), “Digital Image Processing”, Pearson Education, India.
A. Buades, B. Coll, and J. Morel(2005). Neighborhood filters and pde’s. Technical Report 2005-04,
CMLA.
H.Q. Luong, A. Ledda, and W. Philips(2006),“Non-local image interpolation,” in IEEE
InternationalConferenceonImageProcessing,pp.693–696.
D. Donoho(1995). De-noising by soft-thresholding. IEEE Transactions on Information Theory,
41:613–627.
S Sudha , GR Suresh , R Sukanesh (2009), “Speckle Noise Reduction in Ultrasound Images Using
Context-based Adaptive Wavelet Thresholding”, IETE Journal of Research, Volume: 55, Issue:
3, Page: 135-143.
S W Smith, and H Lopez(1982), “A contrast-detail analysis of diagnostic ultrasound imaging”, Med. Phy,
Vol. 9, pp. 4-12.
J.S.Lee(1980),“Digital image enhancement and noise filtering by use of local statistics,” IEEET
ransactionson Pattern Analysis and Machine Intelligence, vol.2, pp.165 168. [Online]. Available:
http://adsabs.harvard.edu/cgi-bin/nph-bibquery?bibcode=1980ITPAM...2..165L
Tay, P.C. Acton, S.T. Hossack, J.A.(2006) “Ultrasound despeckling using an adaptive window stochastic
approach,” in IEEE International Conferenceon Image Processing,pp.2549–2552. [Online].
Available: http://ieeexplore.ieee.org/xpls/ abs all.jsp?arnumber=4107088
Authors
Md. Motiur Rahman received the B.Sc Engg. & M.S degree in Computer Science & Engineering
from Jahangir Nagar University,Dhaka, Bangladesh, in 1995 & 2001, Where he is currently pursuing the
Ph.D. degree. His research interests include digital image processing, medical image processing,
computer vision & digital electronics.
Md. Gauhar Arefin was born in Nilphamari, Bangladesh in 1990. Currently he is the student of the
department of Computer Science & Engineering in Mawlana Bhashani Science & Technology University,
64](https://image.slidesharecdn.com/11-optimalnonlocalmeansalgorithmfordenoisingultrasoundimage-120513004000-phpapp01/75/11-optimal-nonlocal-means-algorithm-for-denoising-ultrasound-image-9-2048.jpg)


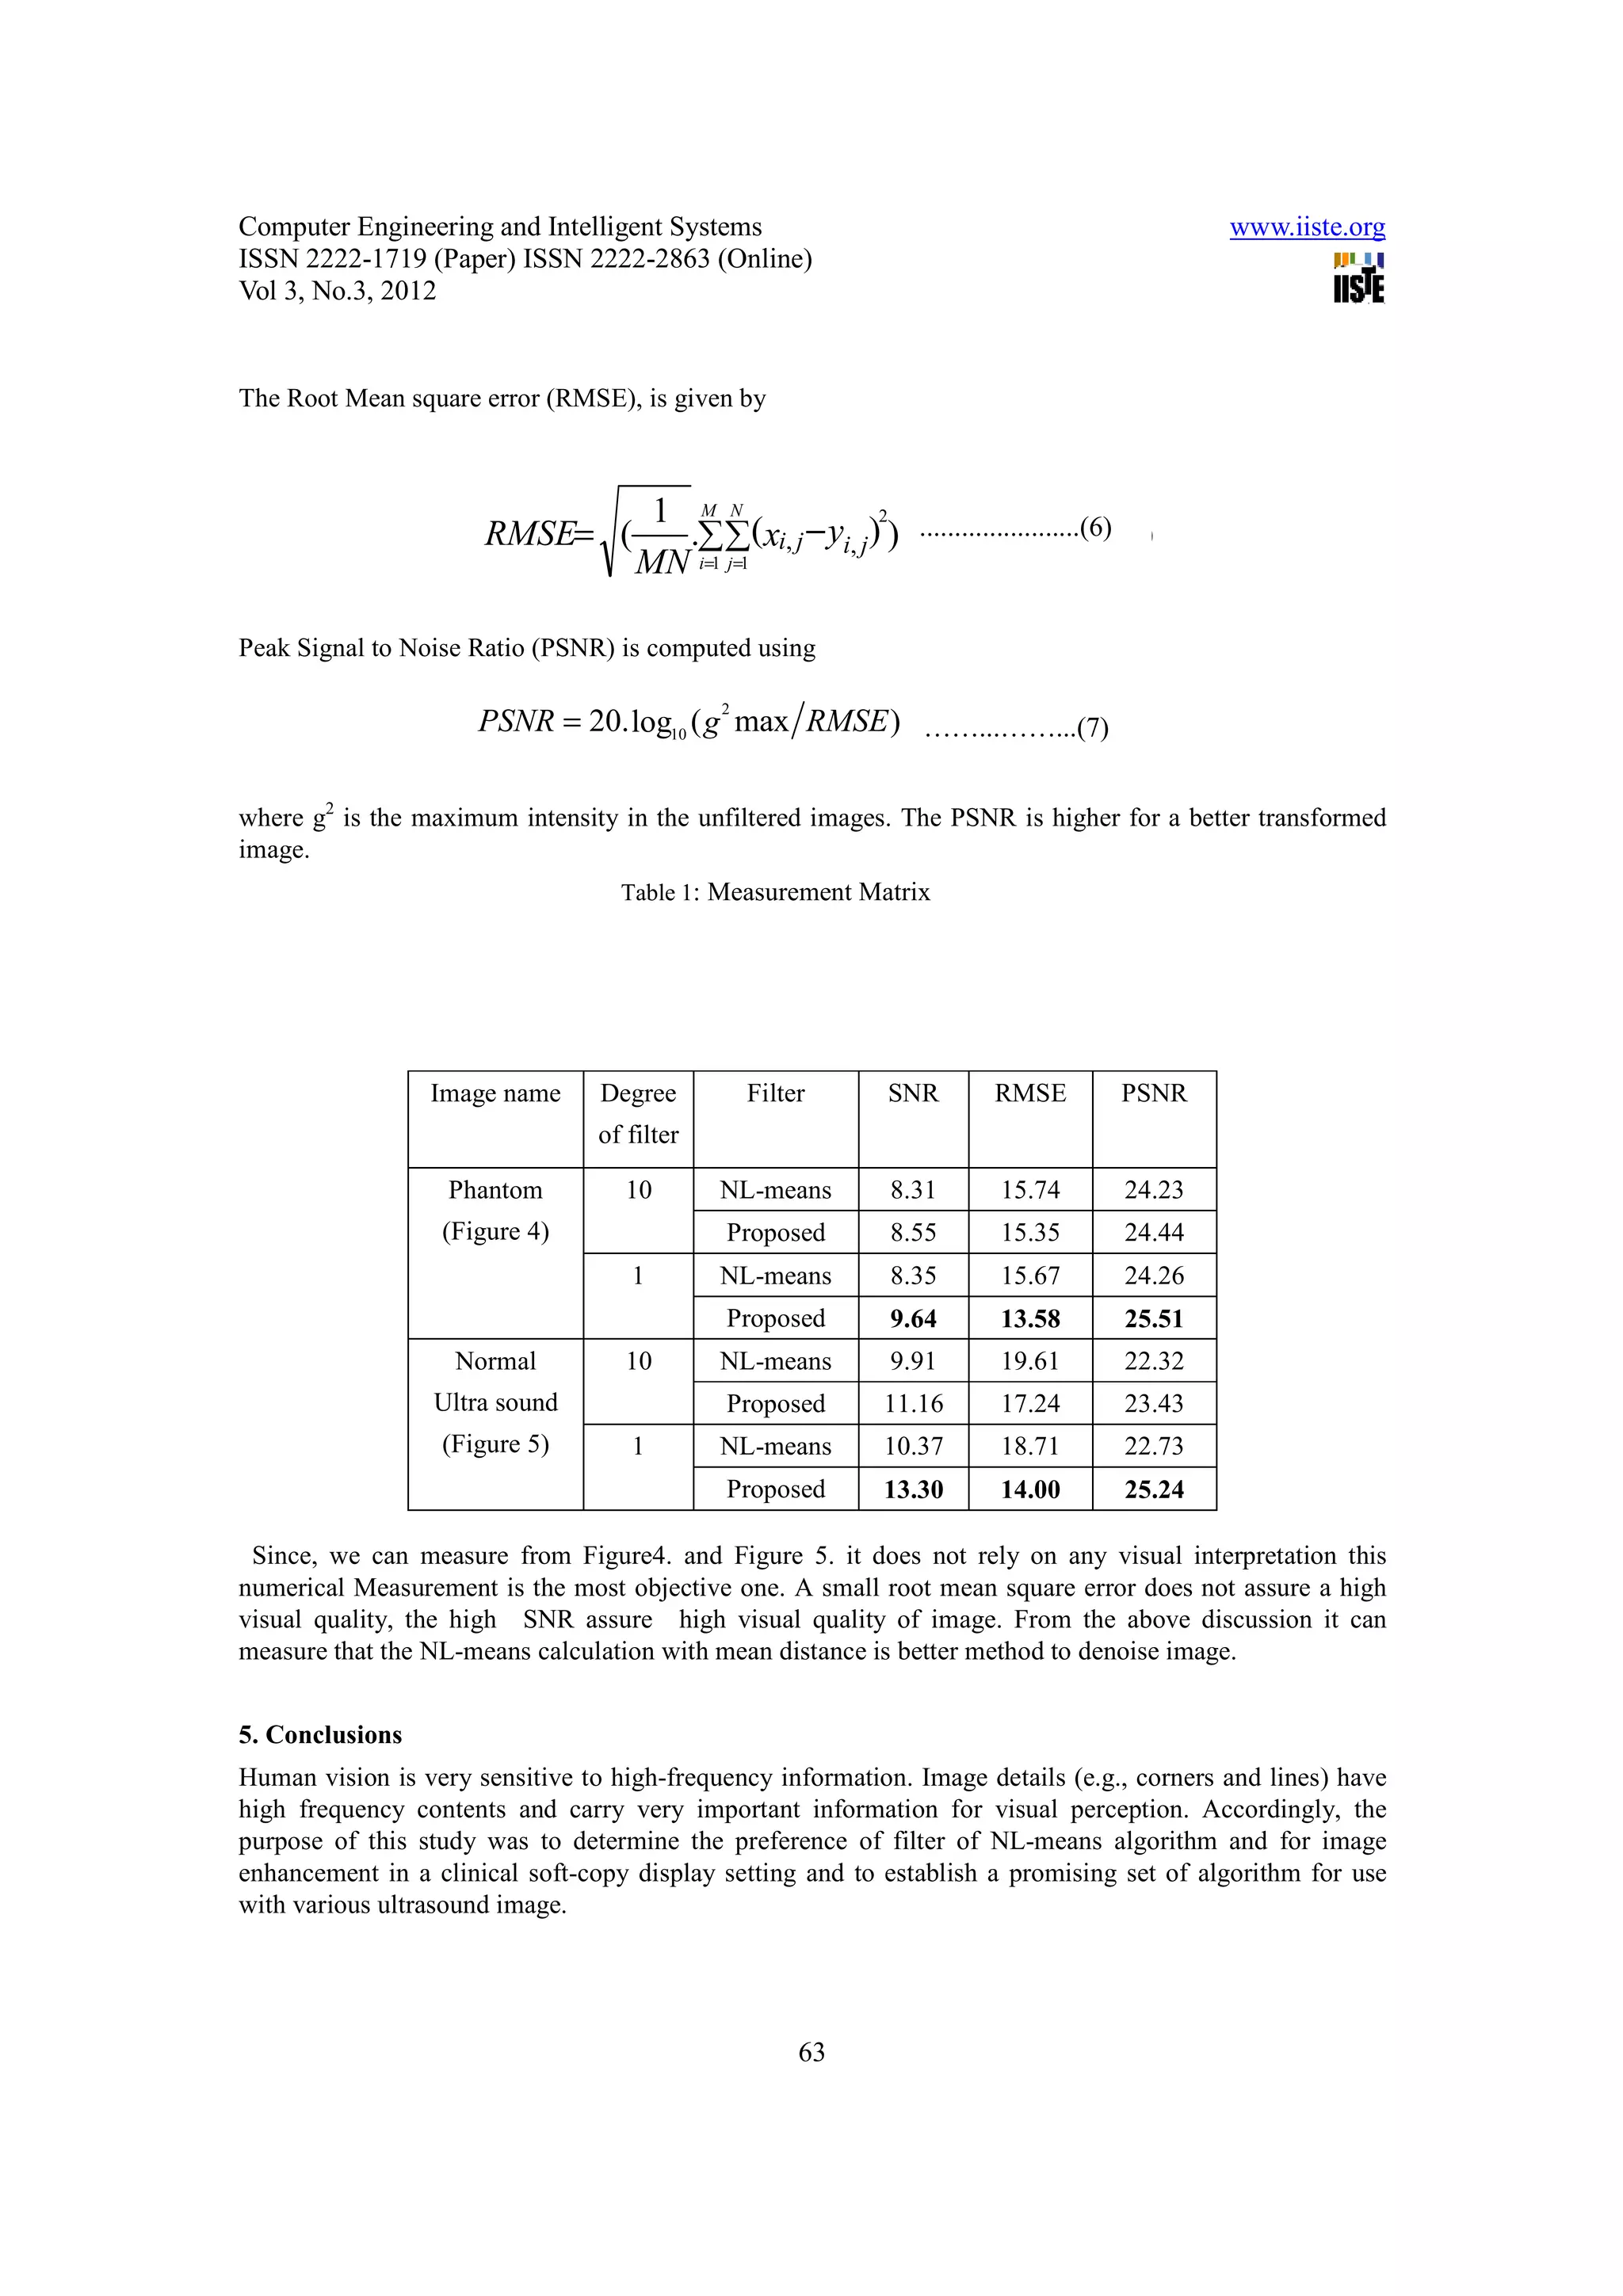
The document presents a new algorithm for denoising ultrasound images called the optimal nonlocal means algorithm. It calculates the mean distance of all pixel neighborhoods in the image, rather than totaling all neighborhood distances as in the original nonlocal means algorithm. The proposed algorithm exhibits better performance in noise removal, visual quality of restored images, and mean square error compared to the original algorithm, as evidenced by experiments on phantom and normal ultrasound images. Numerical measurements of SNR, RMSE, and PSNR support that calculating nonlocal means with mean neighborhood distances provides a better method for image denoising.