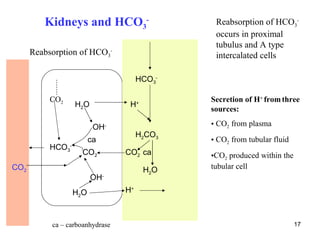
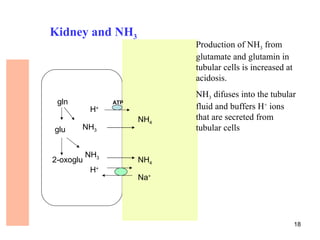
The document summarizes acid-base balance in the body. It discusses metabolic processes that produce acids and buffer systems that regulate pH. The lungs and kidneys help control acid-base balance by removing carbon dioxide and regulating bicarbonate levels respectively. Chemoreceptors in the body sense changes in acidity and signal the respiratory system to adjust ventilation and maintain pH within a narrow range.


![The limit value of pH (blood)
Although there is a large
production of acidic
metabolites in the body, pH = 7,40
concentrations of H+
ions in biological fluids
[H+] ≅ 40 nmol . l-1
are maintained in the The human body is
very more tolerant of
narrow range: acidaemia (acidosis)
than of alkalaemia
(alkalosis).
pH = 6,80 pH = 7,70
[H ] ≅ 160 nmol . l
+ -1 [H+] ≅ 20 nmol . l-1
4
Steep decrease or increase of pH may be life-threatening](https://image.slidesharecdn.com/11-acidbaseregulation-110920061433-phpapp01/85/11-acid-base-regulation-4-320.jpg)

![Buffer systems in blood
Hydrogen carbonate buffer - the most important buffer in blood
CO2 + H2O H2CO3 H+ + HCO3–
− −
[HCO3 ] [HCO3 ]
pH = pK (H 2CO3 ) + log = 6,1 + log
[CO 2 + H 2 CO 3 ] [ H 2CO3 ] ef
Effective concentration of carbonic acid [CO2 + H2CO3] = 0,23 x pCO2
0,23 is the coefficient of solubility of
CO2 for pCO2 in kPa
Physiological values:
pCO2 5,3 kPa ± 0,5 kPa. HCO3- 24 ± 2 mmol/l
In these equations, the concentrations [HCO3-] and [CO2+H2CO3] are expressed in 6
mmol/l, not in the basal SI unit mol/l !](https://image.slidesharecdn.com/11-acidbaseregulation-110920061433-phpapp01/85/11-acid-base-regulation-6-320.jpg)
![Hydrogen carbonate buffer
Metabolic component
−
[HCO 3 ]
pH = 6,1 + log
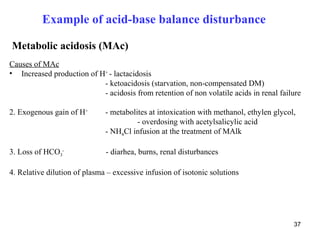
[ H 2CO3 ] ef
Respiratory component
7](https://image.slidesharecdn.com/11-acidbaseregulation-110920061433-phpapp01/85/11-acid-base-regulation-7-320.jpg)


![The respiratory system regulates acid base
balance by controlling the rate of CO2 removal
Peripheral chemoreceptors in arterial walls and central
chemoreceptors in brain
Increase of [H+] in arterias at metabolic disturbances, or ↑of pCO2
in CNS activates medullary respiratory center that stimulates
increased ventilation promoting elimination of CO2
Conversely, the peripheral chemoreceptors reflexely suppres
respiratory activity in response to a fall in arterial H+ concentration
resulting from non-respiratory causes.
13](https://image.slidesharecdn.com/11-acidbaseregulation-110920061433-phpapp01/85/11-acid-base-regulation-13-320.jpg)


![The complementary calculations are derived from
principle of plasma electroneutrality
[Na+] + [K+] + [Ca2+] + [Mg2+] = ([Cl-] + [HCO3-] + [albx-] + [Piy-] + [UA-])
UA- - unmeasured anions (see later)
25](https://image.slidesharecdn.com/11-acidbaseregulation-110920061433-phpapp01/85/11-acid-base-regulation-25-320.jpg)
![Some complementary calculations
Anion gap 150
AG = [Na+] + [K+] − ([Cl−] + [HCO3−]) Na+
Cl-
Cl-
16 ± 2 mmol/l 100
HCO3-
Higher value of AG indicates the presence of extra
K+
unmeasured anions e.g. lactate, acetoacetate, 3- 50
Albx-
hydroxybutyrate.
Ca2+ AG
Piy-
The value is often corrected on serum albumin Mg2+
UA-
concentration:
*AGkorig=AG + 0.25 x ([Alb]norm- [Alb]zjišt
* Information about empirical formulas are given only for ilustration, students need
not to know them 26](https://image.slidesharecdn.com/11-acidbaseregulation-110920061433-phpapp01/85/11-acid-base-regulation-26-320.jpg)
![Some complementary calculations
Albumin charge Albx-
It is calcultaed from albumin concentration (g/l) and pH
11,2 mmol/l at pH =7,4 a [alb]= 40 g/l
Phosphate charge Piy-
It is calculated from pH and concentration of phosphates
1,8 mmol/l at pH =7,4 a [Pi]=1 mmol/l
Corrected chloride ion concentration
correcting the chloride concentration for changes in Na+
[Cl]kor = [Cl]zjišt.x [Nanorm.] / [Nazjišt]
27](https://image.slidesharecdn.com/11-acidbaseregulation-110920061433-phpapp01/85/11-acid-base-regulation-27-320.jpg)
![Some complementary calculations
Unmeasured anions
[UA] = ([Na+] + [K+] + [Ca2+] + [Mg2+]) – ([Cl−] + [HCO3−] +[Albx-] +[Piy-] )
6-10 mmol/l
UA expresses the concentration of other 150
anions that are not included in the
equation of electroneutrality (e.g.lactate, Na+
Cl-
Cl-
keton bodie, glycolate at poisonning with
ethylene glycol, formiate at poisonning 100
with methanol, salicylates etc.)
Increased value of UA is compensated by HCO3-
K +
decrease of concetration of other anions
or mainly HCO3- 50
Albx-
Ca2+
Piy-
Mg2+ 28
UA-](https://image.slidesharecdn.com/11-acidbaseregulation-110920061433-phpapp01/85/11-acid-base-regulation-28-320.jpg)
![Some complementary calculations
SID (strong ion difference)
SIDeff = [Na+] + [K+] + [Ca2+] + [Mg2+] – ([Cl-] + [UA-])
38–40 mmol/l
150
Accurate measurement of SID is
complicated by difficulties with Cl-
Cl-
Na +
determination of UA (unmeasured
100
anions), empirical relation is therefore
used
HCO3-
SIDeff = [HCO3−] + 0,28∙[albumin] + 1,8∙[Pi] K+
[Pi] and [HCO3-] are in mmol/l and albumin in SID
50
g/l Albx-
Ca2+
Piy-
Mg2+
UA- 29](https://image.slidesharecdn.com/11-acidbaseregulation-110920061433-phpapp01/85/11-acid-base-regulation-29-320.jpg)
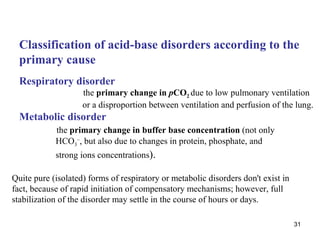
![Classification of acid-base disorders
„acidosis“ (pH < 7,36) metabolic disorder
[HCO3-]
pH = pK H CO + log
2 3
[CO2 + H2CO3 ]
„alkalosis“ (pH > 7,44) respiratory disorder
30
Disturbances are often combined.](https://image.slidesharecdn.com/11-acidbaseregulation-110920061433-phpapp01/85/11-acid-base-regulation-30-320.jpg)


![Acidosis
cause – production of lactate, keton bodies, formiate,
salicylate etc.
Due to buffering reaction 150
concentration of [HCO3-],
event. Albx- a Piy- is decreased Na + Cl
Cl-
-
Concentration of
unmeasured anions (UA)
increases HCO3-
Concentration of chlorides
K+ SID ↓
50
is not changed –
Albx-
normochloremic acidosis Ca2+
Piy-
Mg2+
UA-
UA ↑
AG ↑ 41](https://image.slidesharecdn.com/11-acidbaseregulation-110920061433-phpapp01/85/11-acid-base-regulation-41-320.jpg)
![The classification of acid-base disorders :
Disorder acidosis alkalosis
I. respiratory pCO2 pCO2
II. metabolic (nonrespiratory)
1. abnormal SID SID
a/ water (excess/deficit) [Na+]
b/ imbalance of strong anions SID SID
chlorides (excess/deficit) [Cl-] [Cl-]
unidentified anions (excess) SID
SID
[UA-]
[Na+]
2. weak nonvolatile acids
a/ serum albumin [Alb-] [Alb-]
b/ inorganic phosphate [Pi-] [Pi-]
43](https://image.slidesharecdn.com/11-acidbaseregulation-110920061433-phpapp01/85/11-acid-base-regulation-43-320.jpg)

![Evaluation of acid –base parameters (2)
2/ recalculation of laboratory results
• calculation of [Albx-] and [Piy-]
• calculation of unmeasured anions [UA-]
• correction of Cl- to actual content of water
46](https://image.slidesharecdn.com/11-acidbaseregulation-110920061433-phpapp01/85/11-acid-base-regulation-46-320.jpg)
![Evaluation of acid –base parameters (2)
the deviations of patient values from the reference values are
filed to the columns „acidosis“ / „alkalosis“
(according to their signs: „+“ for increase, „−“ for decrease)
mmol . l-1 patient acidosis alkalosis
[Na+] 140 − +
[Cl-]correc 100 + −
[UA-]correc 8 + −
[Pi-] 2 + −
[Alb-] 12 + −
47](https://image.slidesharecdn.com/11-acidbaseregulation-110920061433-phpapp01/85/11-acid-base-regulation-47-320.jpg)
![Evaluation of acid –base parameters (1)
3/ quantitative evaluation
pH= 7,367, pCO2 = 5,25 kPa, BE = - 2,5 mmol.l-1
mmol . l-1 patient acidosis alkalosis
[Na+] 140 129 − 11 +
[Cl-]correc 100 111 + 11 −
[UA-]correc 8 9 + 1 −
[Pi-] 2 1,7 + − 0,3
[Alb-] 12 1,9 + − 10,1
= combined metabolic disorder with normal ABE parameters
48
„hypoalbuminemic MAlk+ hyponatremic MAc“](https://image.slidesharecdn.com/11-acidbaseregulation-110920061433-phpapp01/85/11-acid-base-regulation-48-320.jpg)


