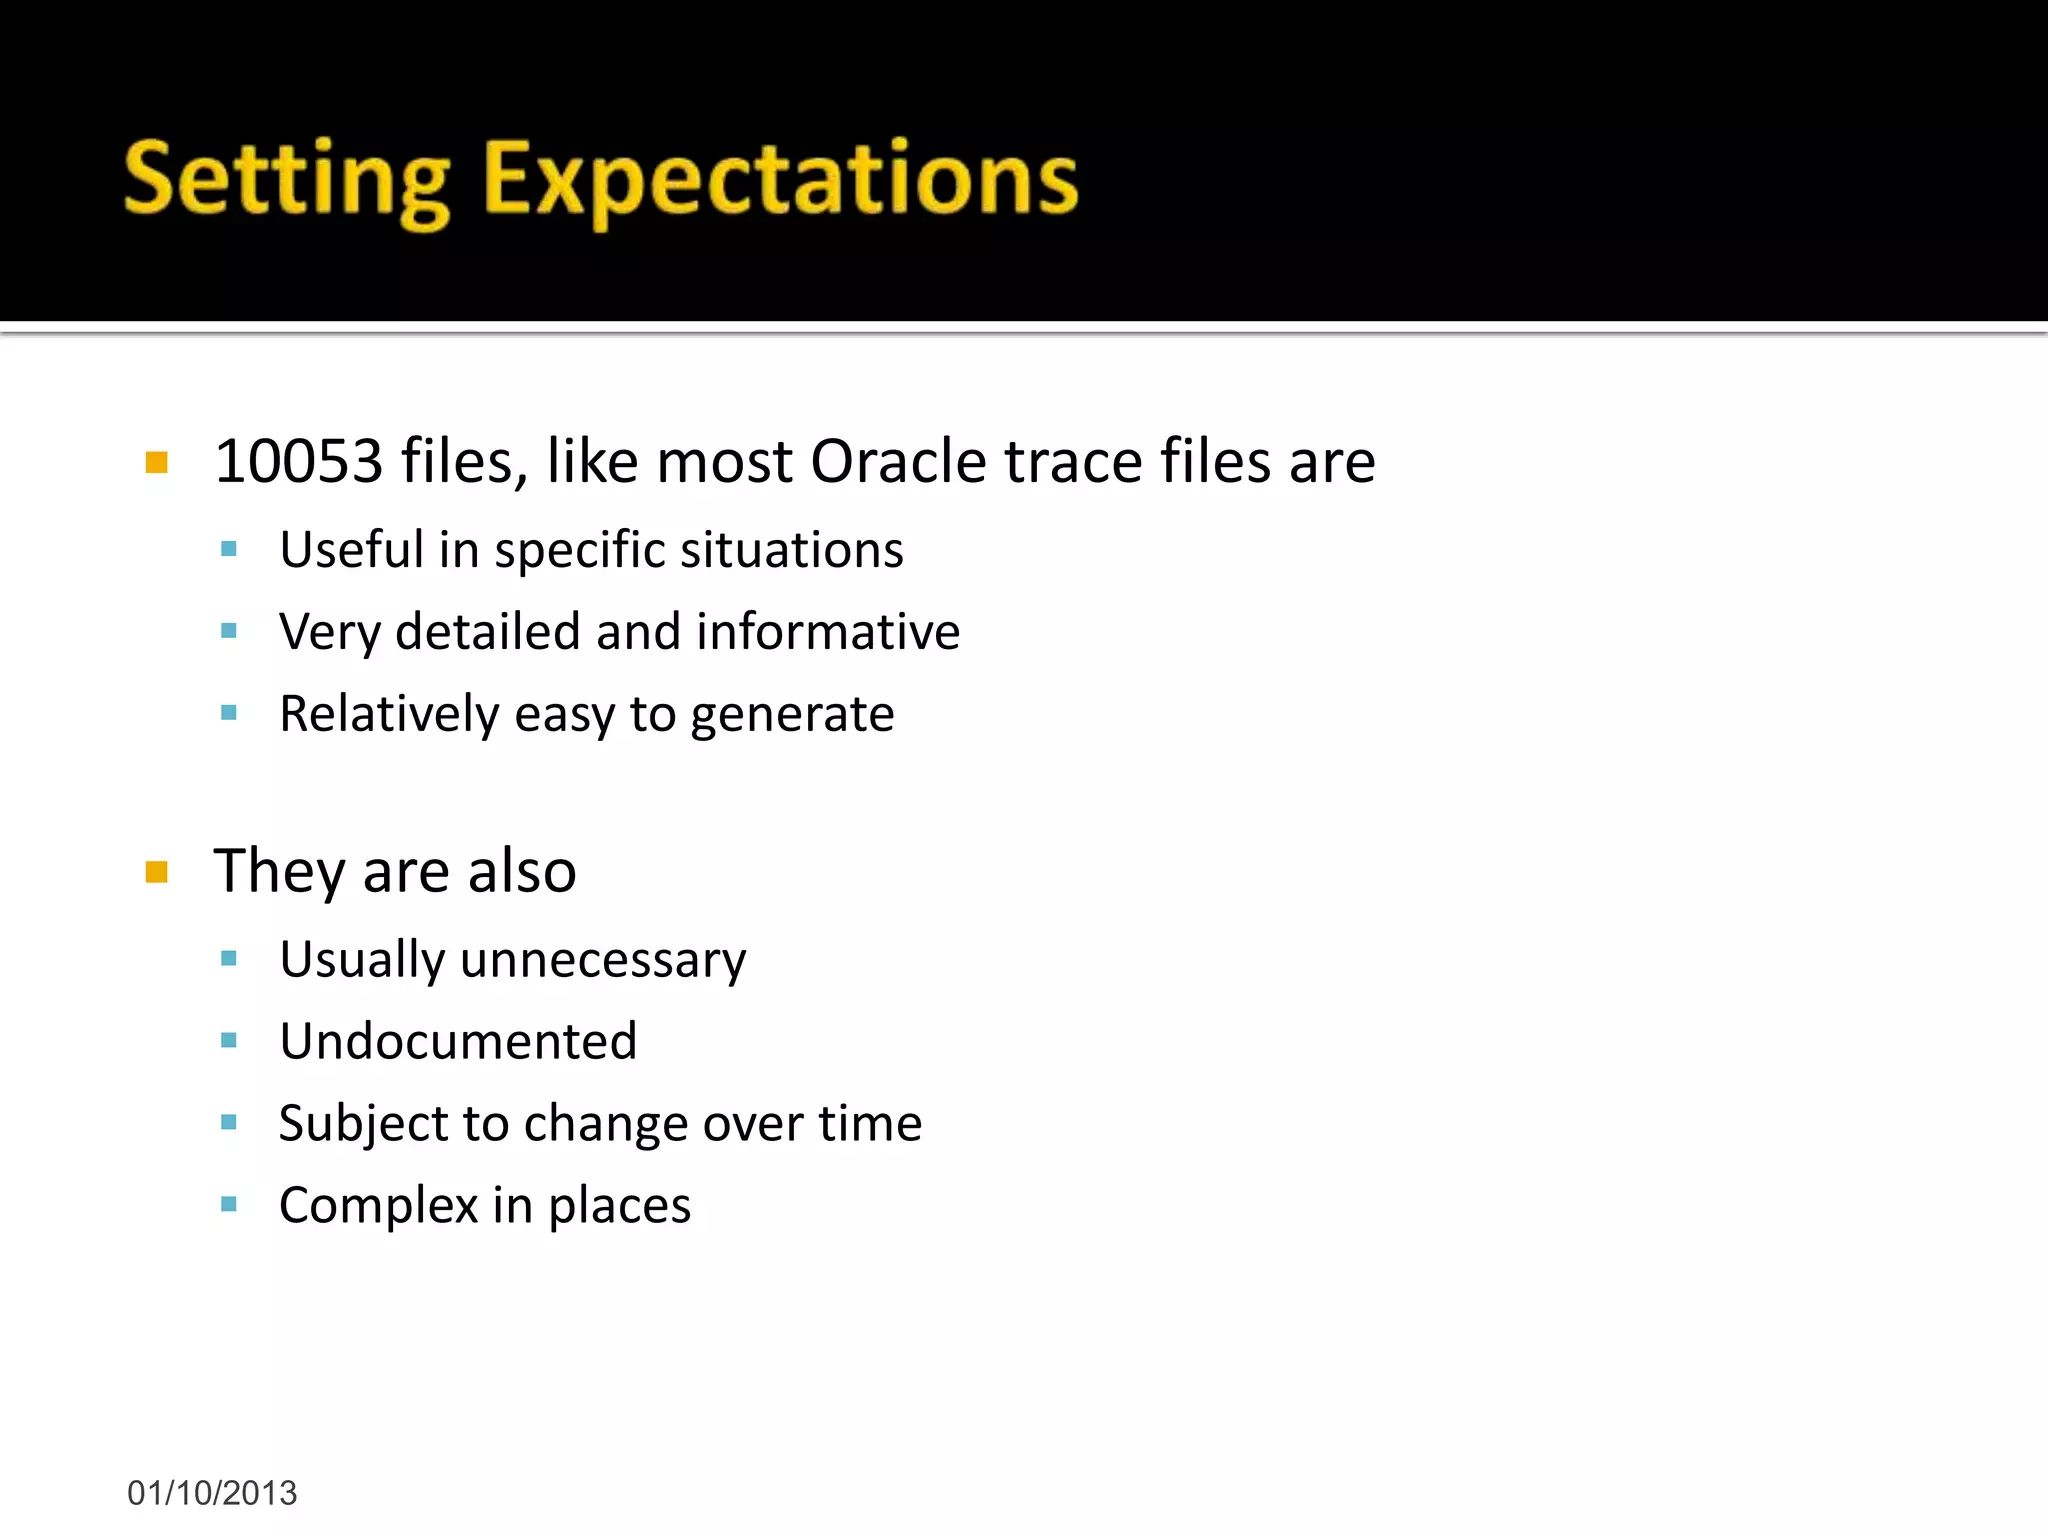
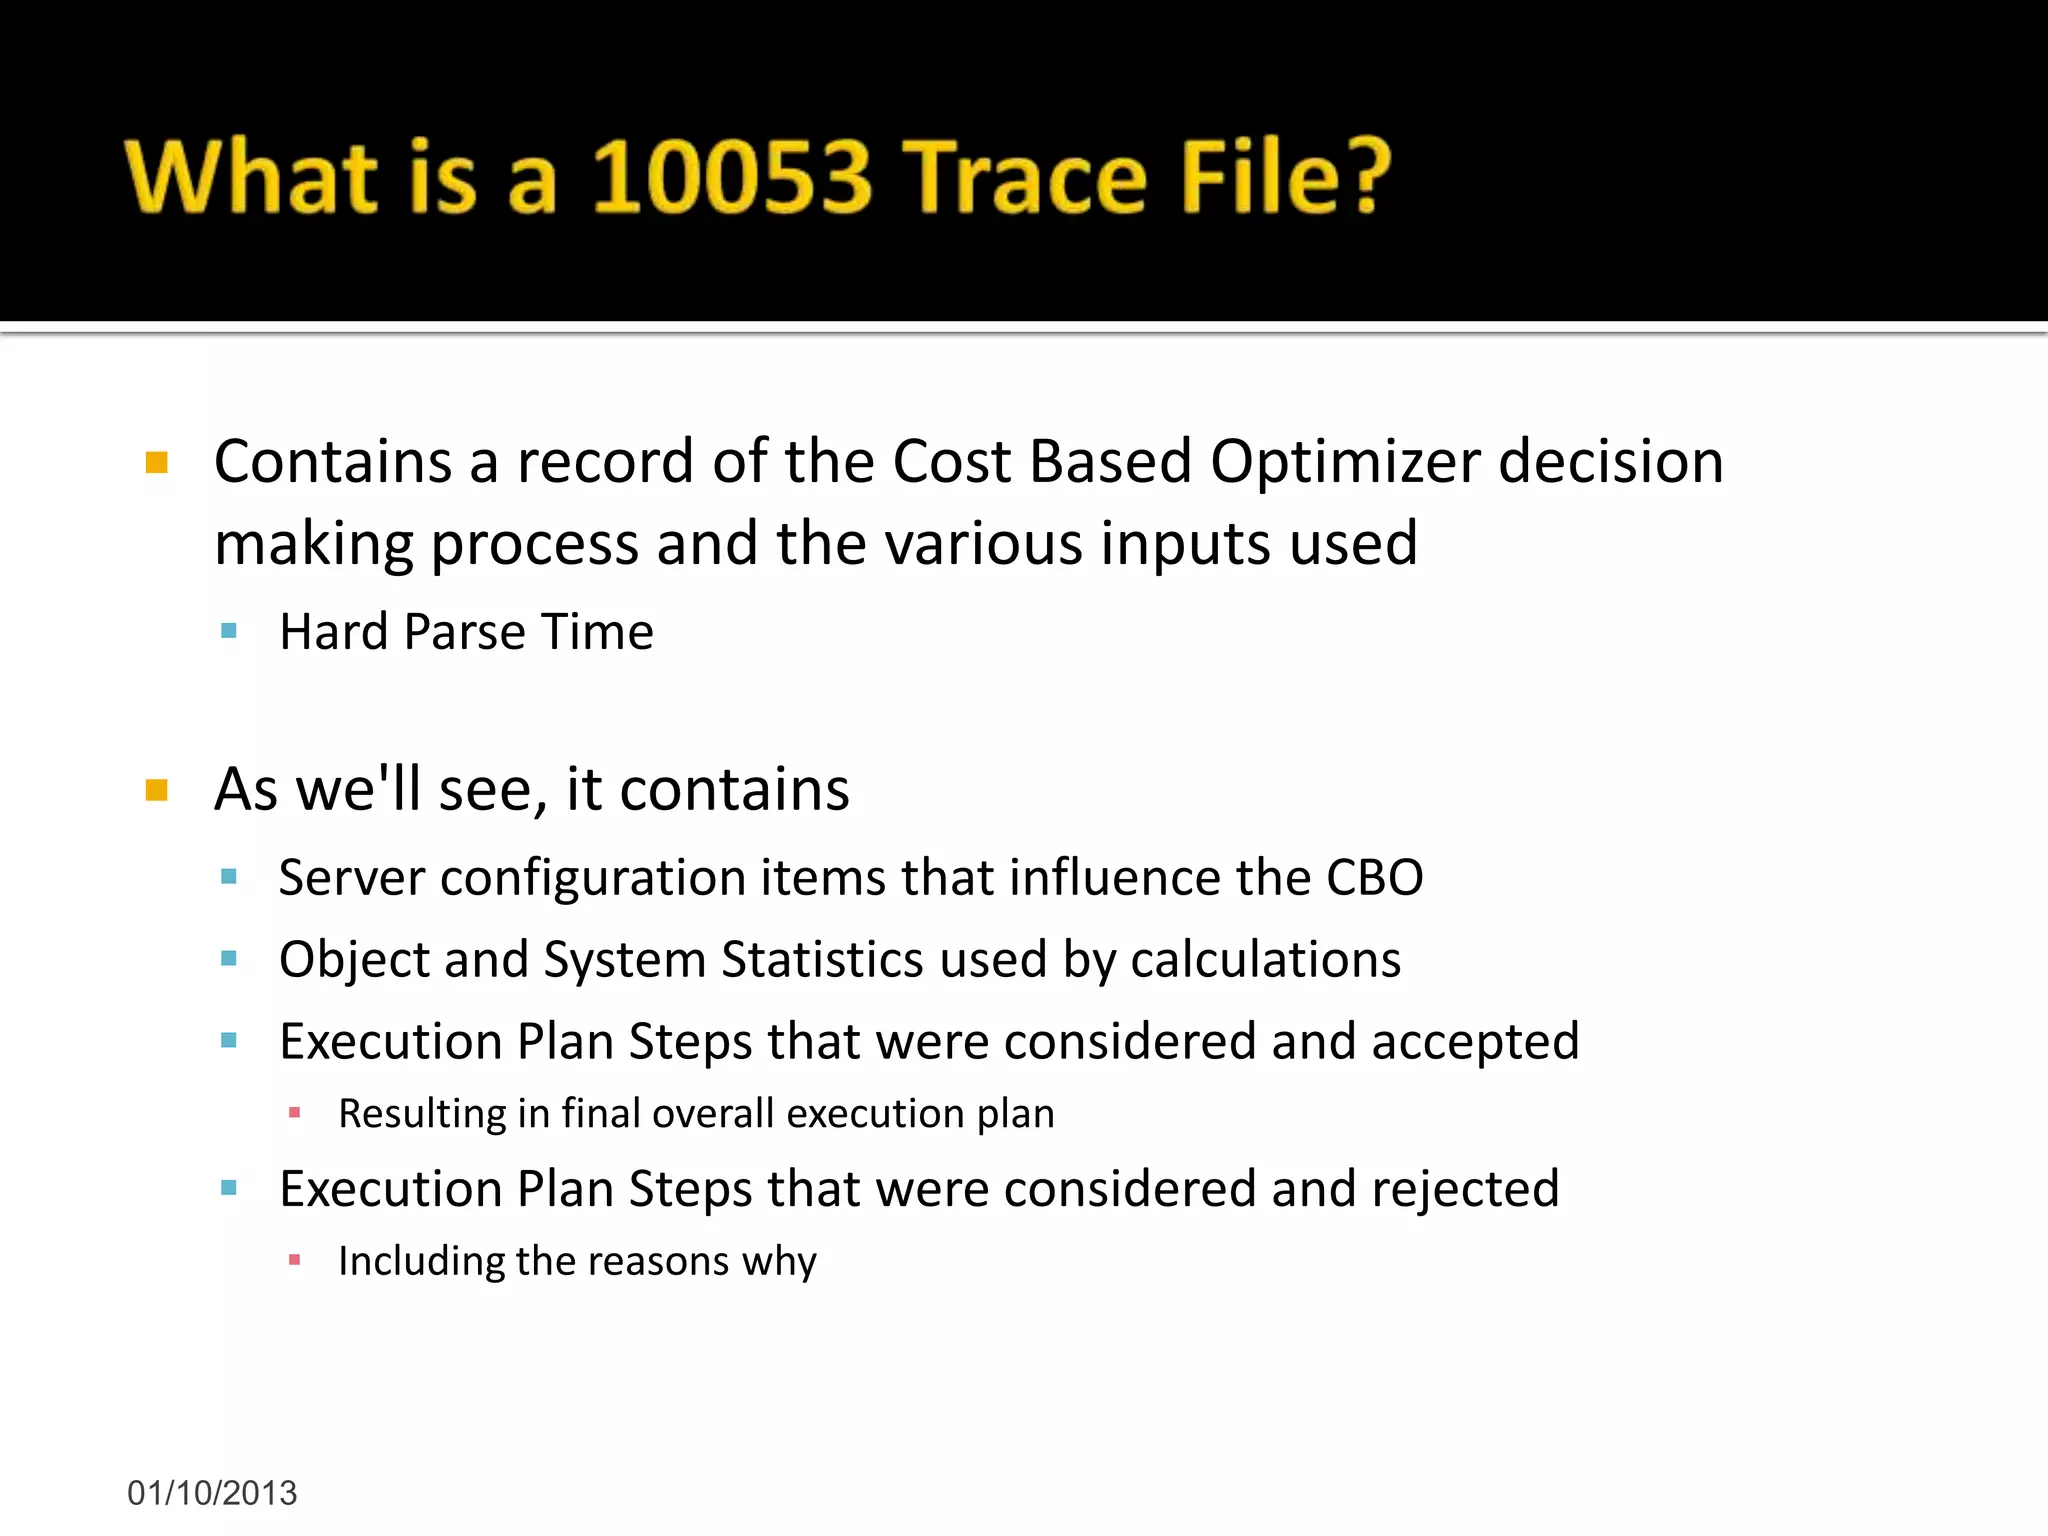
The document discusses using Oracle 10053 trace files to analyze the Cost Based Optimizer's decision making process. It provides information on enabling 10053 traces, the structure and contents of 10053 trace files, and examples of using traces to understand why a particular execution plan was chosen. The document also covers newer tracing options introduced in Oracle 11g and how 10053 traces can help optimize SQL statements and learn about the CBO.


![ Replacement for original method of setting event 10053
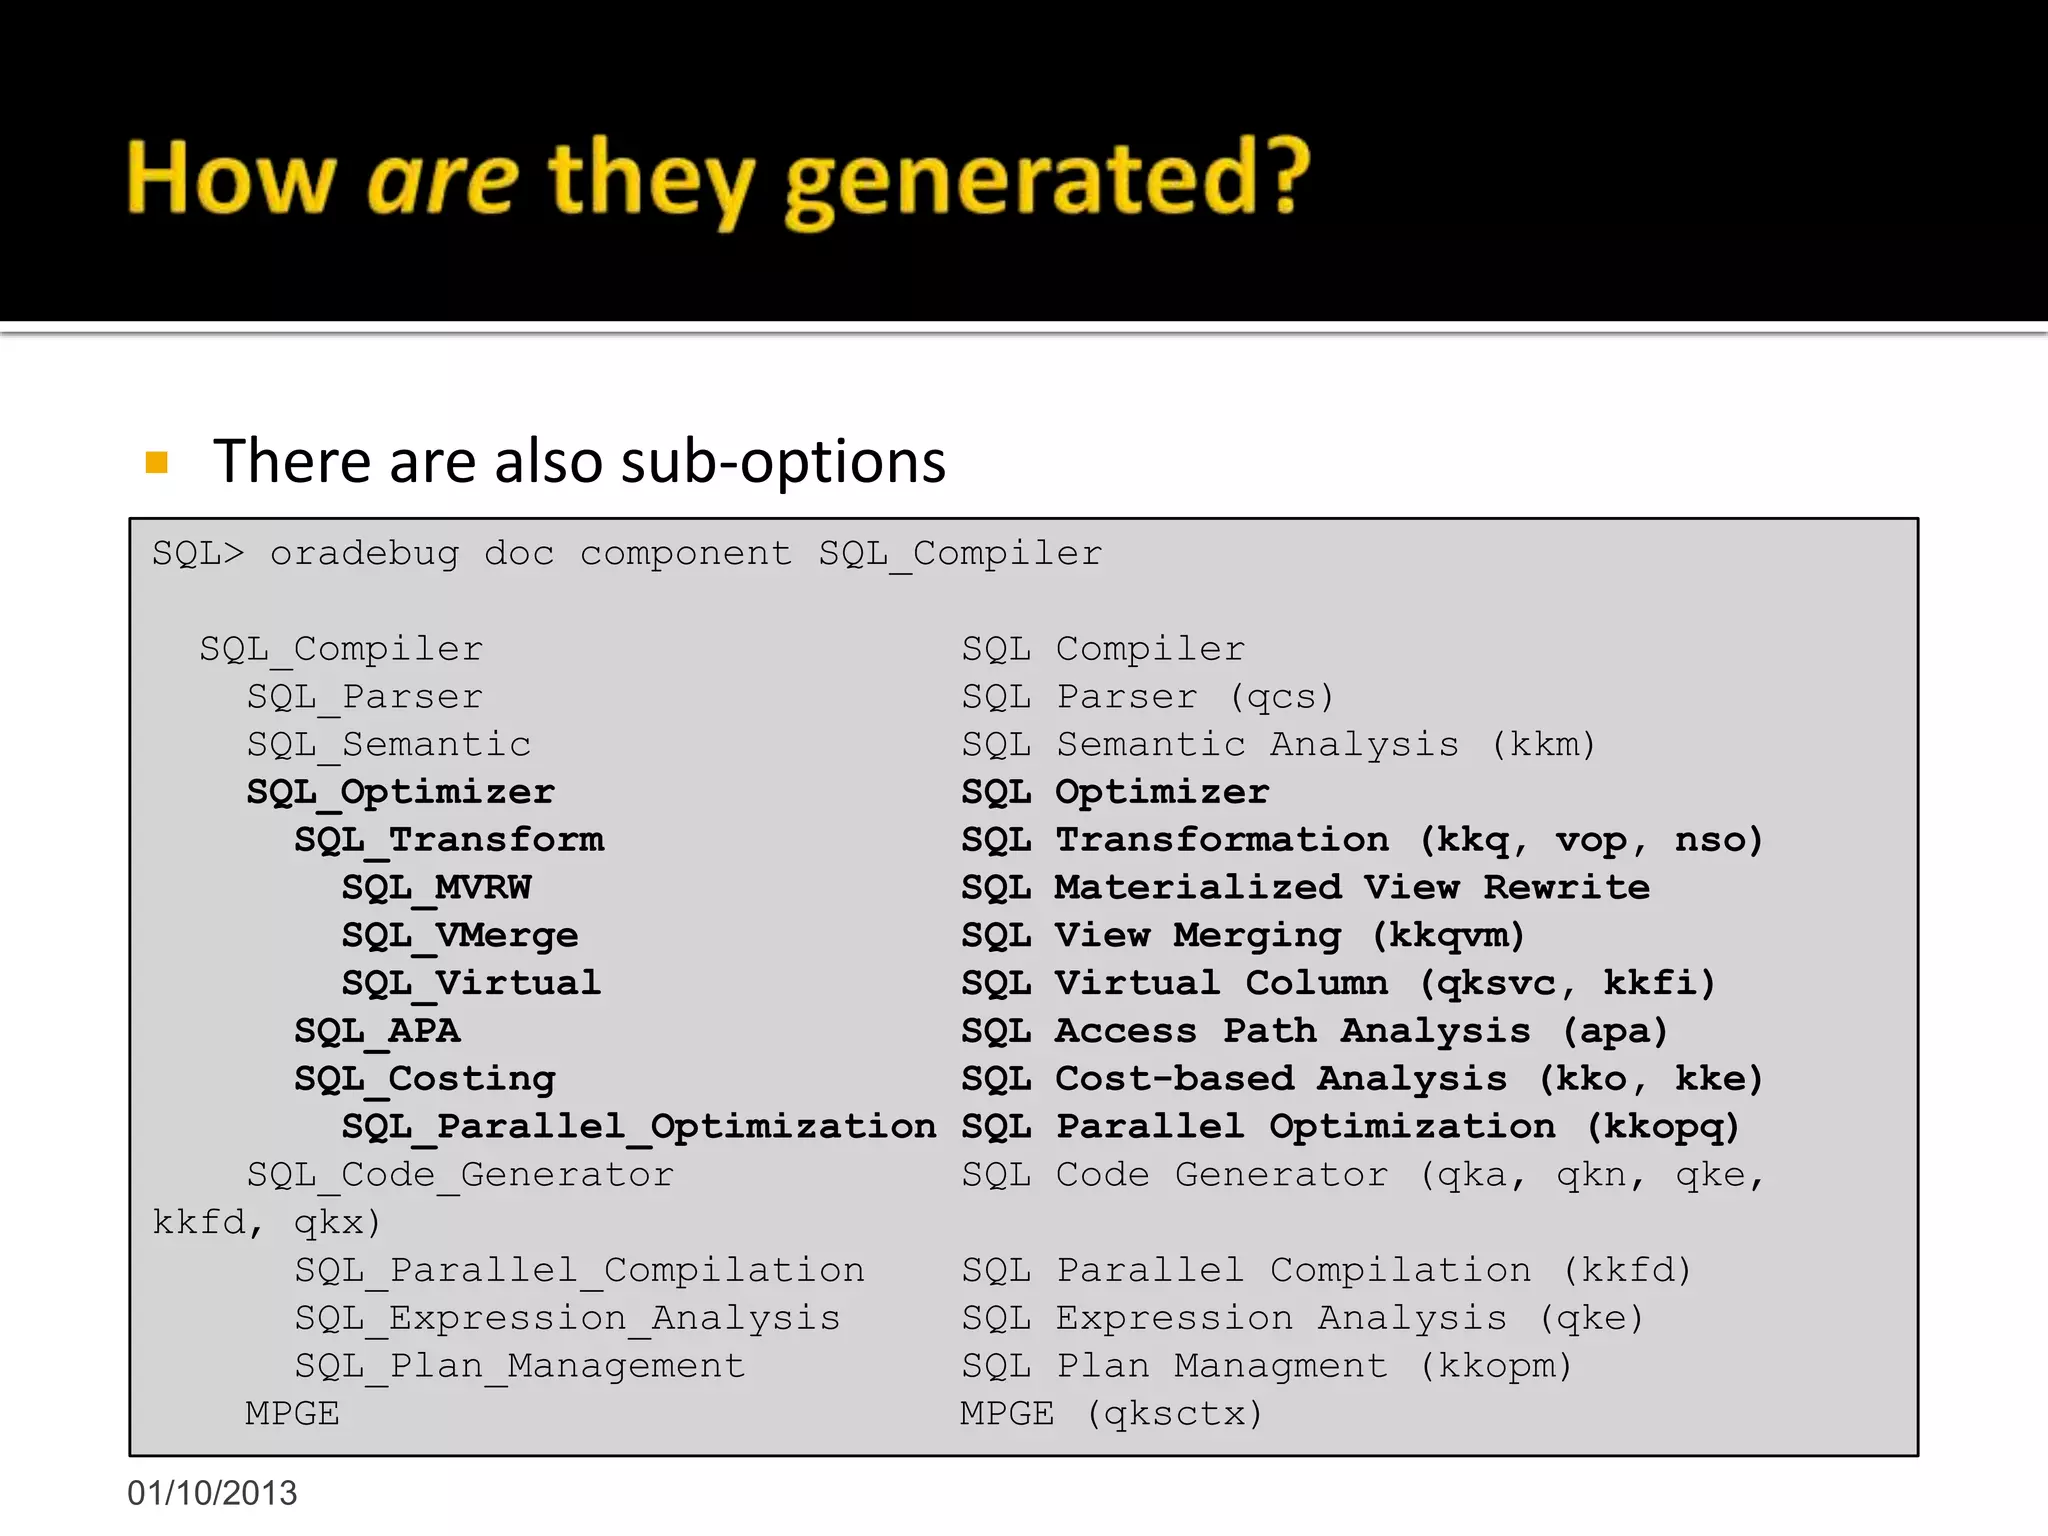
Main 10053-related Options
SQL_Compiler and SQL_Optimizer
01/10/2013
show parameter user_dump_dest
ALTER SESSION SET tracefile_identifier='EXAMPLE1_2_OPTTRACE';
ALTER SESSION SET events 'trace [SQL_Compiler.*]';
SELECT /* EXAMPLE1_2 */ * FROM dual;
ALTER SESSION SET events 'trace [SQL_Compiler.*] off';](https://image.slidesharecdn.com/10053otw-131001200252-phpapp01/75/10053-otw-17-2048.jpg)
![ What if you want to trace just one SQL statement that a
Session executes?
Perhaps inside a PL/SQL procedure or function
Can also specify SQL_ID
Still relies on Hard Parse
01/10/2013
show parameter user_dump_dest
ALTER SESSION SET tracefile_identifier='EXAMPLE2_OPTTRACE';
ALTER SESSION SET events 'trace [SQL_Compiler.*][sql:37cv4d33vbu8h]';
SELECT /* EXAMPLE1_2 */ * FROM dual;
ALTER SESSION SET events 'trace [SQL_Compiler.*] off';](https://image.slidesharecdn.com/10053otw-131001200252-phpapp01/75/10053-otw-19-2048.jpg)
![ What if you want to trace just one SQL statement and you
don't know which session will execute it?
Can enable System-wide tracing using ALTER SYSTEM
Still relies on Hard Parse
01/10/2013
show parameter user_dump_dest
ALTER SYSTEM SET events 'trace [SQL_Compiler.*][sql:bhqn6d93r5r03]';
ALTER SYSTEM SET events 'trace [SQL_Compiler.*] off';](https://image.slidesharecdn.com/10053otw-131001200252-phpapp01/75/10053-otw-20-2048.jpg)


![01/10/2013
SYSTEM STATISTICS INFORMATION
-----------------------------
Using NOWORKLOAD Stats
CPUSPEEDNW: 1416 millions instructions/sec (default is 100)
IOTFRSPEED: 4096 bytes per millisecond (default is 4096)
IOSEEKTIM: 10 milliseconds (default is 10)
MBRC: -1 blocks (default is 32)
***************************************
BASE STATISTICAL INFORMATION
***********************
Table Stats::
Table: DUAL Alias: DUAL
#Rows: 1 #Blks: 1 AvgRowLen: 2.00 ChainCnt: 0.00
Access path analysis for DUAL
***************************************
SINGLE TABLE ACCESS PATH
Single Table Cardinality Estimation for DUAL[DUAL]
Table: DUAL Alias: DUAL
Card: Original: 1.000000 Rounded: 1 Computed: 1.00 Non Adjusted: 1.00
Access Path: TableScan
Cost: 2.00 Resp: 2.00 Degree: 0
Cost_io: 2.00 Cost_cpu: 9893
Resp_io: 2.00 Resp_cpu: 9893
Best:: AccessPath: TableScan
Cost: 2.00 Degree: 1 Resp: 2.00 Card: 1.00 Bytes: 0](https://image.slidesharecdn.com/10053otw-131001200252-phpapp01/75/10053-otw-36-2048.jpg)
![01/10/2013
OPTIMIZER STATISTICS AND COMPUTATIONS
***************************************
GENERAL PLANS
***************************************
Considering cardinality-based initial join order.
Permutations for Starting Table :0
Join order[1]: DUAL[DUAL]#0
***********************
Best so far: Table#: 0 cost: 2.0005 card: 1.0000 bytes: 2
***********************
(newjo-stop-1) k:0, spcnt:0, perm:1, maxperm:2000
*********************************
Number of join permutations tried: 1
*********************************
This is the section that gets very complicated very quickly!](https://image.slidesharecdn.com/10053otw-131001200252-phpapp01/75/10053-otw-37-2048.jpg)


![Understanding Oracle RAC 12c Internals OOW13 [CON8806]](https://cdn.slidesharecdn.com/ss_thumbnails/understandingoraclerac12cinternalsoow13con8806-131001010807-phpapp02-thumbnail.jpg?width=640&height=640&fit=bounds)