Download as PDF, PPTX
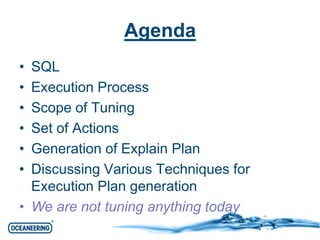
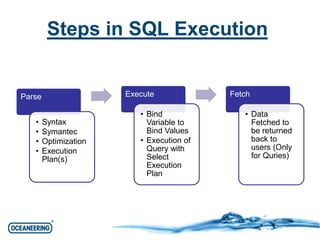
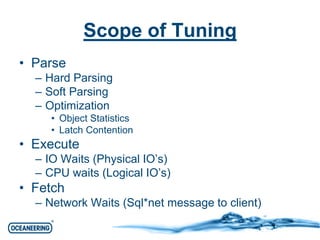
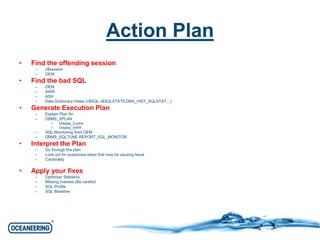
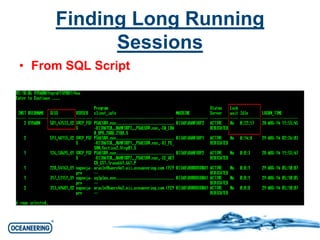
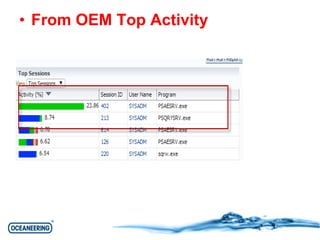
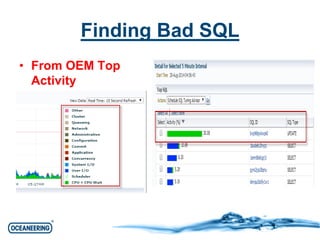
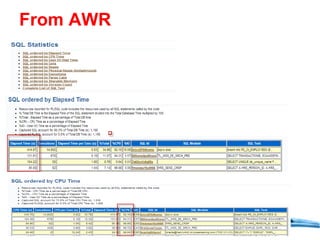
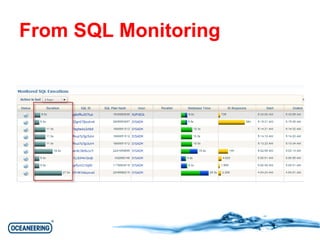
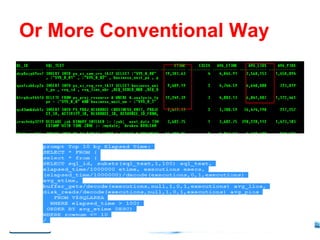
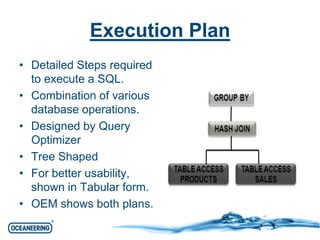
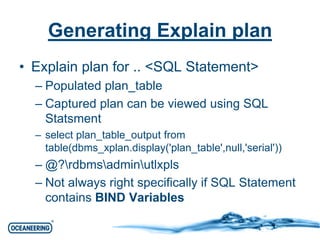
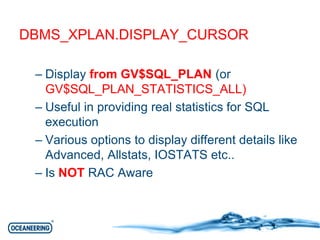
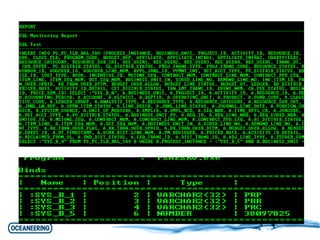
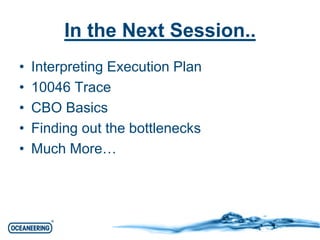


This document discusses SQL tuning and provides an overview of the SQL execution process. It outlines the steps to identify and analyze poorly performing SQL, including using views like v$session to find long running sessions, AWR to find top SQL, and generating execution plans using EXPLAIN PLAN or DBMS_XPLAN to interpret execution plans and identify bottlenecks. The next session will cover interpreting execution plans in more detail as well as additional techniques for SQL tuning.