Downloaded 108 times

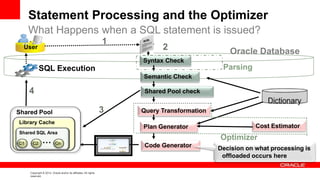

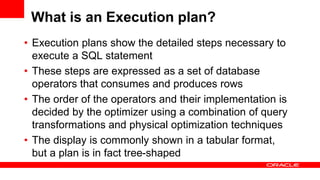
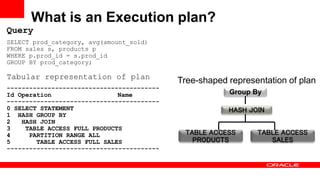
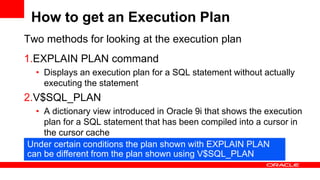
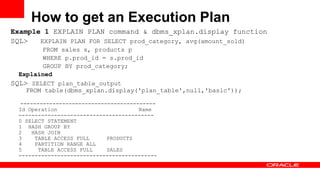
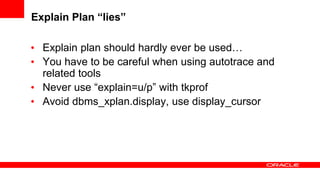
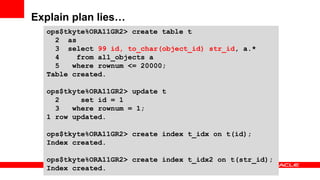
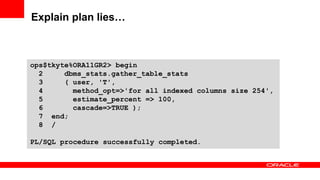
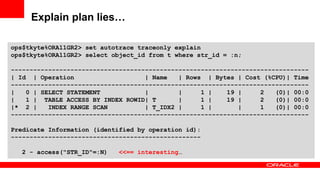
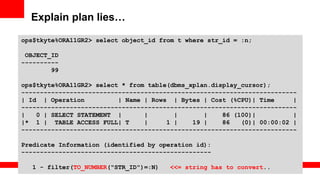
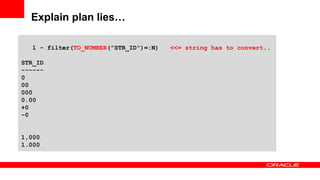
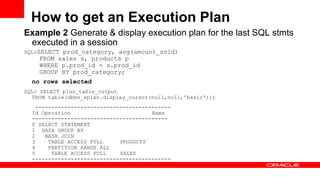
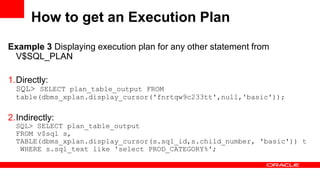
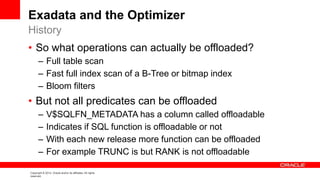
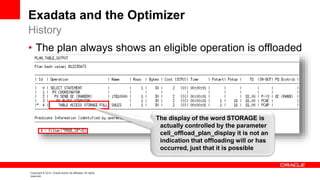
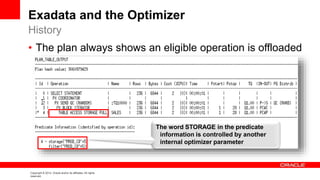

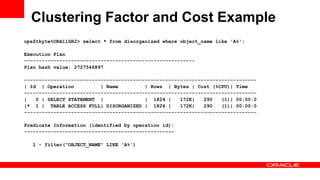
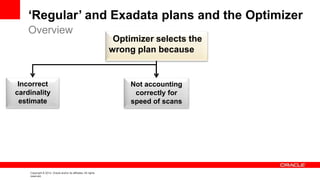
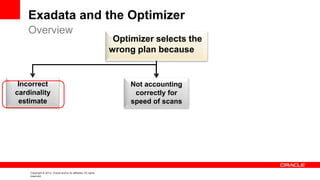

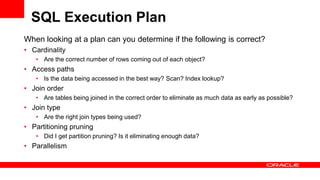

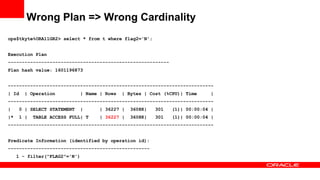
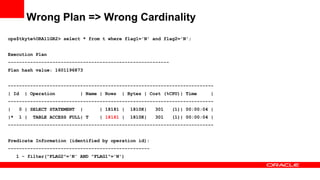
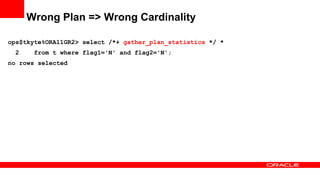
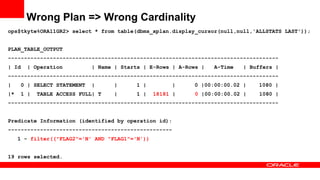
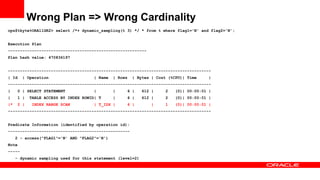
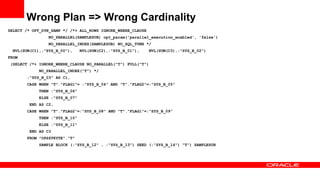
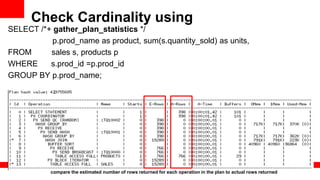
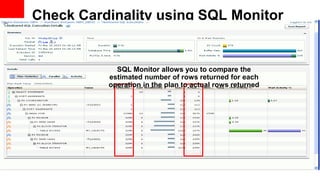


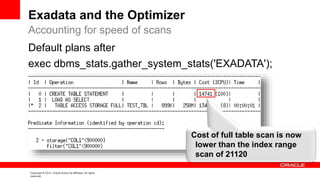
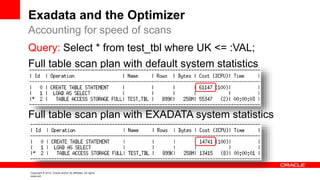

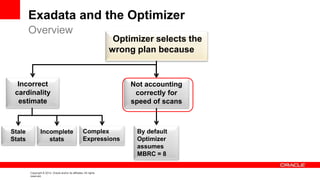
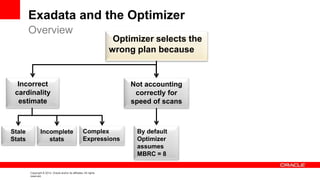


The document discusses query optimization with regular Oracle databases and Exadata databases. It explains what happens when a SQL statement is issued, including parsing, optimization, and execution. It describes what an execution plan is and how it can be generated and displayed. It discusses how operations can be offloaded to storage cells on Exadata and factors the optimizer considers for determining a good execution plan.