AWR Ambiguity: 

Performance reasoning when the
numbers don’t add up
John Beresniewicz
Oak table founding member

Oracle Performance maven, ASH expert, bodyboarder
an Oaktable inquiry…
Oaktable member
(I didn’t really understand the question)
…can you send me the AWR?
Top 10 Foreground Events by Total Wait Time
~~~~~~~~~~~~~~~~~~~~~~~~~~~~~~~~~~~~~~~~~~~
Total Wait Wait % DB Wait
Event Waits Time (sec) Avg(ms) time Class
------------------------------ ----------- ---------- ---------- ------ --------
db file parallel read 139,819 469.8 3.36 78.1 User I/O
DB CPU 243 40.4
db file sequential read 201,921 52.4 0.26 8.7 User I/O
db file scattered read 221 .5 2.21 .1 User I/O
kksfbc child completion 4 .2 37.85 .0 Other
control file sequential read 249 0 0.10 .0 System I
Disk file Mirror Read 61 0 0.21 .0 User I/O
library cache load lock 19 0 0.60 .0 Concurre
cursor: pin S wait on X 4 0 1.61 .0 Concurre
Disk file operations I/O 140 0 0.03 .0 User I/O
CPU + Wait = DB Time
40.4 + 86.8 = 127.2% ( > 100% WTF??? )
Quick Review
The Model
• Summed over all foreground sessions
• Wait time is active wait time (non-idle waits)
• CPU and Wait time are non-overlapping
DB Time = DB CPU time + Wait time
The Method
• Account for DB Time accurately
• Reduce DB Time spent doing the same work
• focus on large chunks of similarly spent time
• If system is CPU-bound, reduce CPU time first
• wait times are inaccurate and wait tuning irrelevant
DB Time
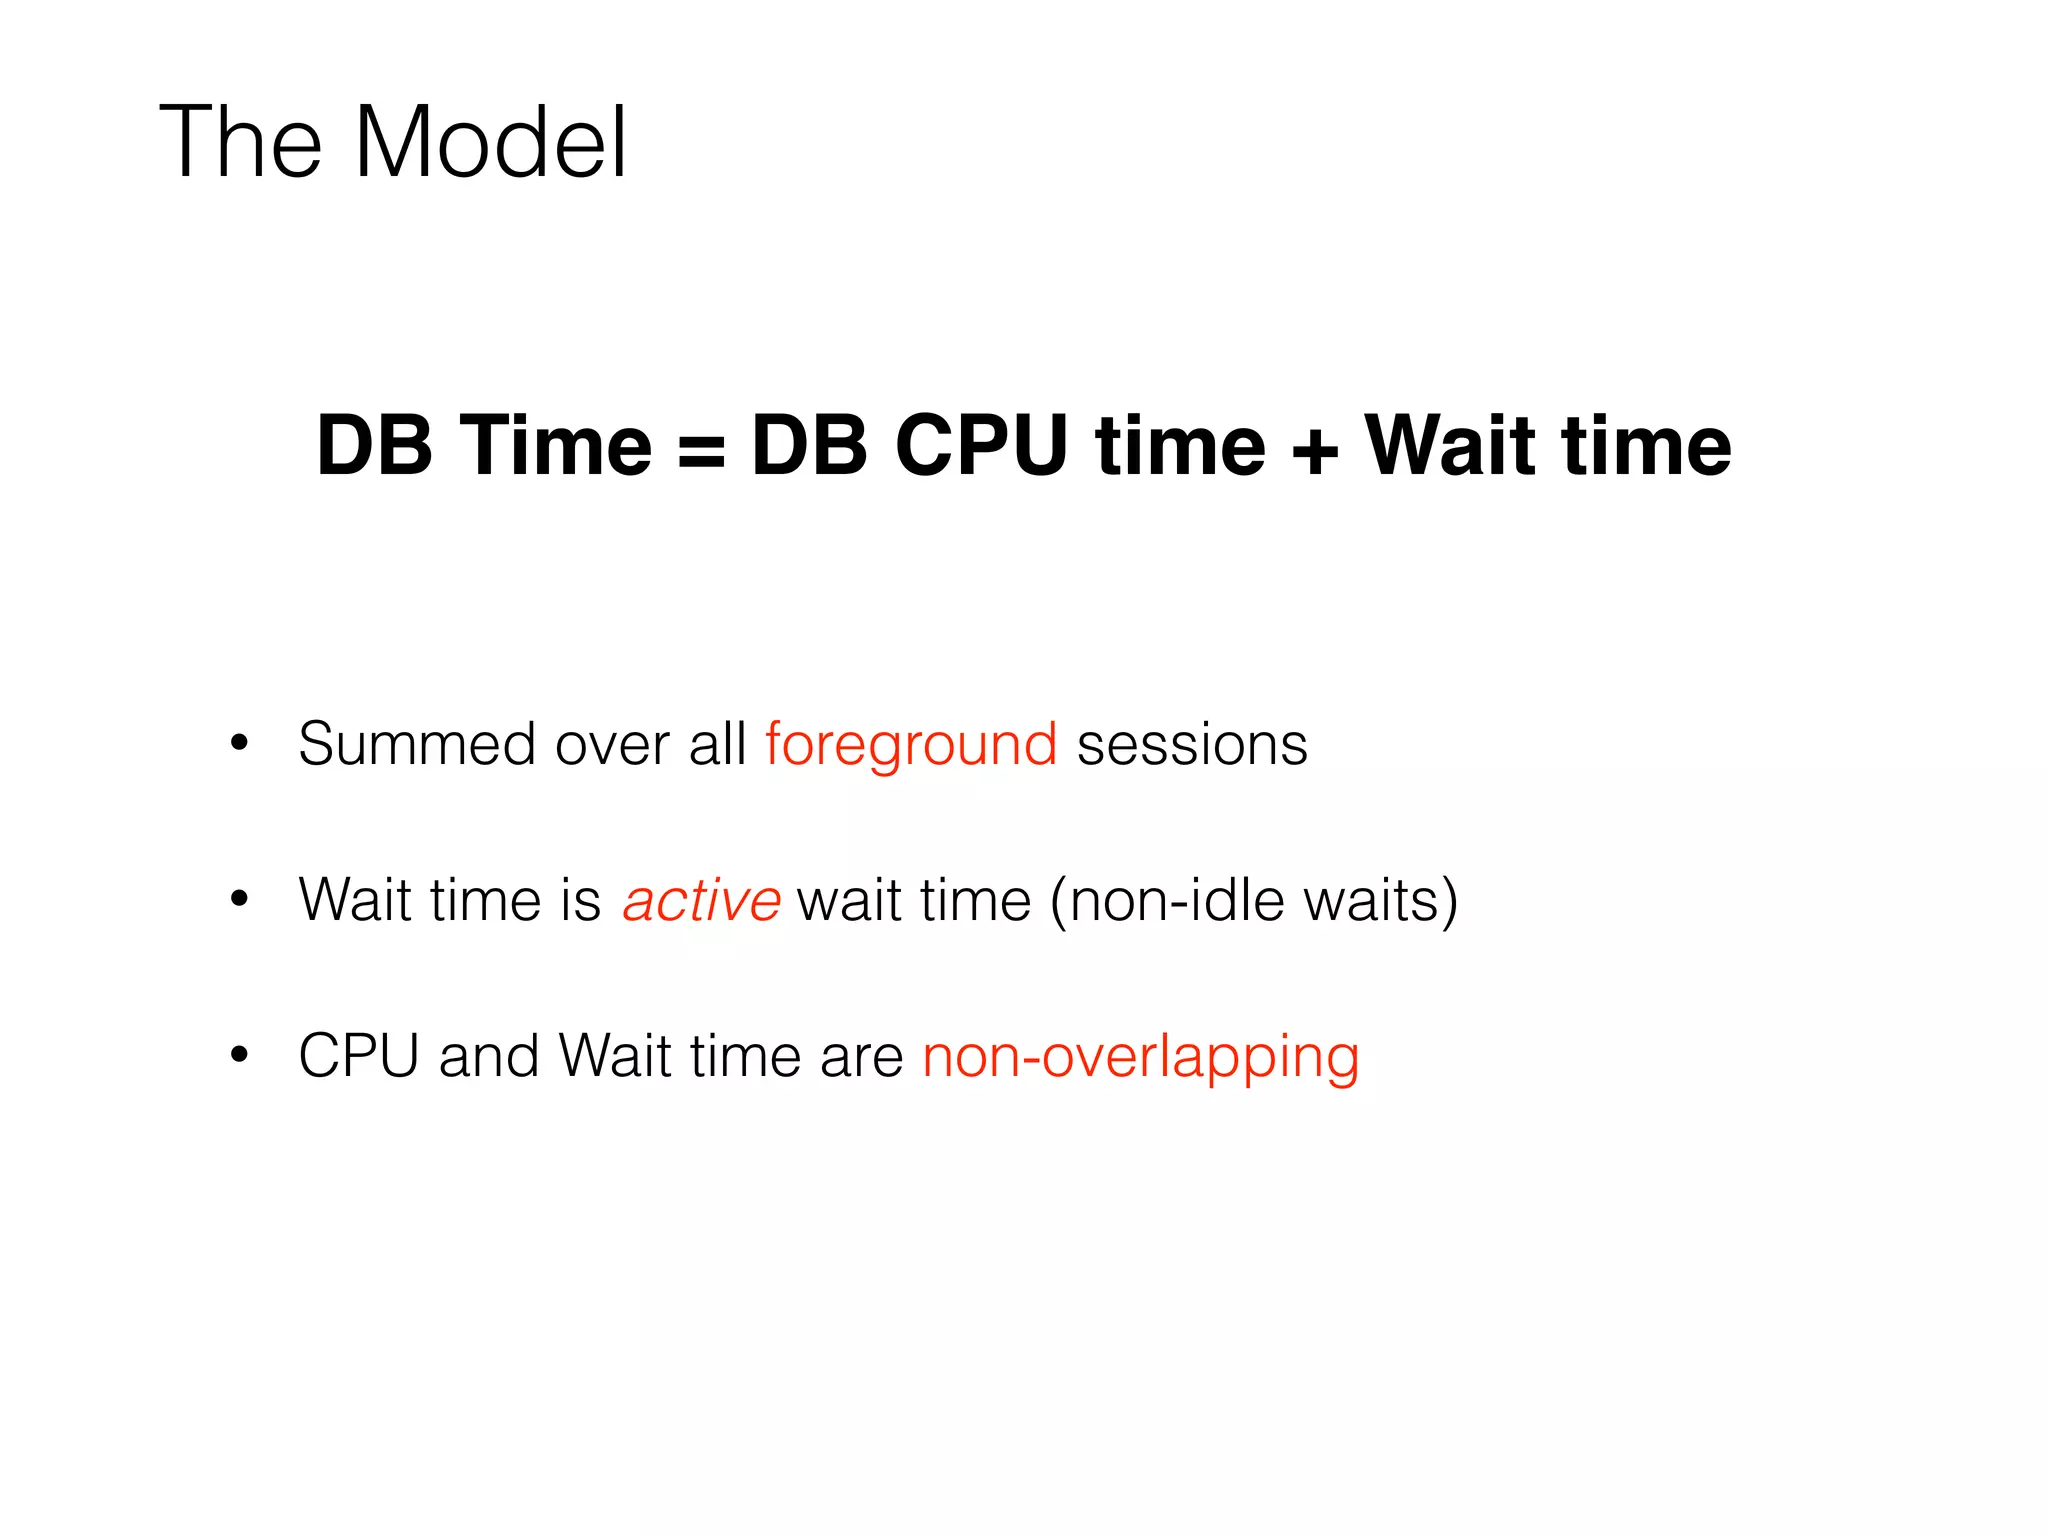
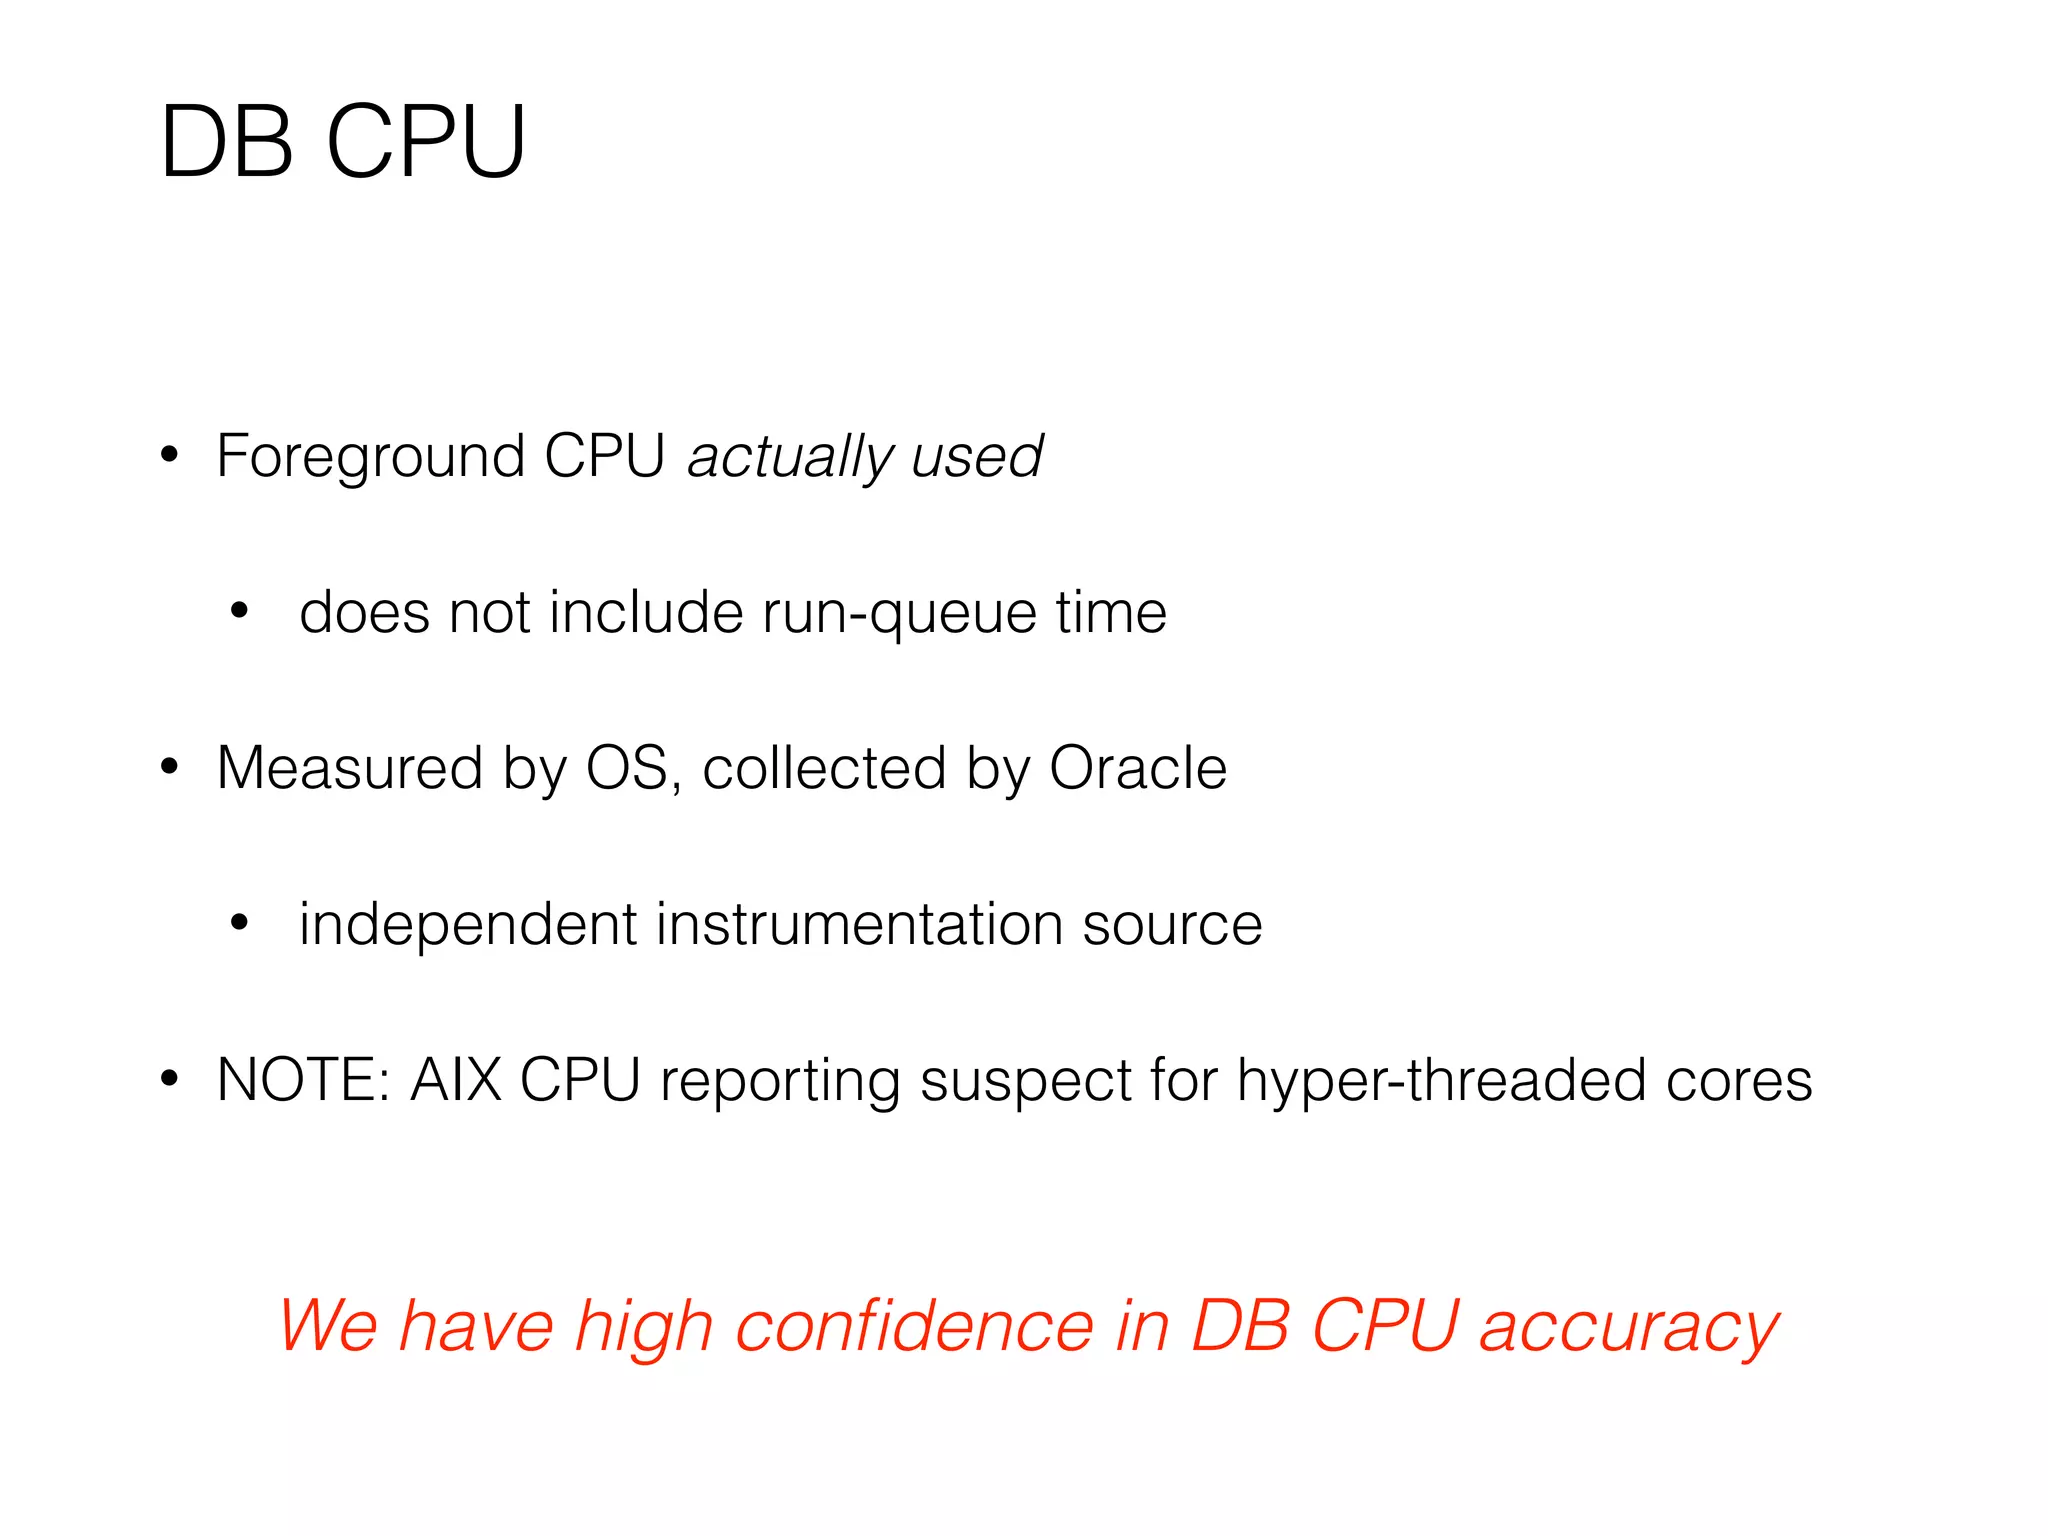
• Foreground session time in database calls
• Measured by DB code using clear instrumentation points:
• [call entry:start timer]
• [call exit:stop timer]
• System DB Time = SUM(Session DB Time)
We trust DB Time accuracy implicitly
DB CPU
• Foreground CPU actually used
• does not include run-queue time
• Measured by OS, collected by Oracle
• independent instrumentation source
• NOTE: AIX CPU reporting suspect for hyper-threaded cores
We have high confidence in DB CPU accuracy
ASH and DB Time
DB Time ~ COUNT(sampled sessions) * interval
• “ON CPU”: session in a call and not waiting
• this is derived, not “observed”
• ASH always conforms to the model:
• every sample is either ON CPU or WAITING
Sessions using CPU in a wait will not show as ON CPU
Be mindful that…
• AWR report presumes accurate instrumentation
• ADDM presumes accurate instrumentation
• Instrumentation is not always accurate
• ergo, AWR report and ADDM may be misleading
AWR and ADDM could (should) do some sanity checks
Back to Problem AWR
First questions
• Elapsed time of report?
• Version of Oracle DB?
• bug lookup, report contents, available data
• System CPU-bound?
Begin at the beginning…
WORKLOAD REPOSITORY report for
DB Name DB Id Instance Inst Num Startup Time Release RAC
------------ ----------- ------------ -------- --------------- ----------- ---
DB12C 1329819247 db12cn1 1 04-Apr-15 06:19 12.1.0.2.0 NO
Host Name Platform CPUs Cores Sockets Memory(GB)
---------------- -------------------------------- ---- ----- ------- ----------
ora1.dssdhop.lab Linux x86 64-bit 72 36 2 252.17
Snap Id Snap Time Sessions Curs/Sess
--------- ------------------- -------- ---------
Begin Snap: 410 04-Apr-15 06:22:16 61 .8
End Snap: 411 04-Apr-15 06:24:18 56 .7
Elapsed: 2.02 (mins)
DB Time: 10.03 (mins)
DB version?
Elapsed time
CPU bound?
12.1.0.2
2 minutes (120 secs)
NO (36 >> 5 ; Cores >> AAS)
Next questions
• What is DB Time over interval?
• What is DB CPU over interval?
• What is (expected) Wait Time over interval?
• DB Time - DB CPU = Wait Time (expected)
• What does ASH indicate?
Load Profile
Load Profile Per Second Per Transaction Per Exec Per Call
~~~~~~~~~~~~~~~ --------------- --------------- --------- ---------
DB Time(s): 5.0 150.4 0.01 3.13
DB CPU(s): 2.0 60.8 0.00 1.27
Background CPU(s): 0.0 0.4 0.00 0.00
Time(seconds)
0
150
300
450
600
DB Time DB CPU
600
240
Wait Time
360
DB Time = 600 secs
( 5 * 120 )
DB CPU = 240 secs
( 2 * 120 )
Wait Time = 360 secs
( 600 - 240 )
Adding measured wait times…
Time(seconds)
0
200
400
600
800
DB Time CPU+Wait
52
470
600
240
excess wait
162
Top 10 Foreground Events by Total Wait Time
~~~~~~~~~~~~~~~~~~~~~~~~~~~~~~~~~~~~~~~~~~~
Total Wait Wait % DB Wait
Event Waits Time (sec) Avg(ms) time Class
------------------------------ ----------- ---------- ---------- ------ --------
db file parallel read 139,819 469.8 3.36 78.1 User I/O
db file sequential read 201,921 52.4 0.26 8.7 User I/O
What does ASH say?
Time(seconds)
0
200
400
600
800
DB Time CPU+Wait ASH
80
52
410
470
600
60
240 CPU in
wait
Slot Event
Slot Time (Duration) Count Event Count % Event
-------------------- -------- ------------------------------ -------- -------
06:22:16 (2.0 min) 55 db file parallel read 41 74.55
db file sequential read 8 14.55
CPU + Wait for CPU 6 10.91
ASH DB Time ~ 550
ASH CPU way off
What is our conclusion?
• “db file parallel read” is consuming significant CPU under wait
• 162 / 470 ~ 34% of the “wait” is actually CPU
• 162 * 1000 / 139,819 ~ 1.16 ms/wait
• block counts >>100 blocks ~ 1MB ~ 300 MB/sec
• Not technically a bug
Total Wait Wait % DB Wait
Event Waits Time (sec) Avg(ms) time Class
------------------------------ ----------- ---------- ---------- ------ --------
db file parallel read 139,819 469.8 3.36 78.1 User I/O
The model and reality do not always agree so well
Digging a bit further…OSSTAT
Operating System Statistics DB/Inst: DB12C/db12cn1
Statistic Value End Value
------------------------- ---------------------- ----------------
BUSY_TIME 72,614
IDLE_TIME 795,376
IOWAIT_TIME 36,343
SYS_TIME 45,030
USER_TIME 27,559
LOAD 7 9
Time(seconds)
0
300
600
900
1200
Oracle AWR OSSTAT
450
363360
275240
DB CPU
DB IOwait
USER_TIME
IOWAIT_TIME
SYS_TIME?
1088 / 120 = 8.3 AAS
}Non-Oracle process
CPU doing I/O?
So what is Mr SLOB up to?
• Benchmarking: pounding on parallel read wait event
• Testing advanced I/O interfaces servicing this event?
• SSD storage using I/O slaves perhaps? (non-DB sys time)
• If we factor in ALL reads and ALL CPU:
• 1000 * (450+275 tot CPU secs) / 15,496,576 tot reads
• ~ 0.05 milliseconds CPU per random read
Instrumentation issues and symptoms
Symptom Possible issue
DB CPU >> ASH CPU
(and significant wait time)
CPU used within wait
(this was the issue here)
ASH CPU >> DB CPU
System CPU-bound
(ASH includes run-queue)
DB Time >> DB CPU + Wait
(and not CPU-bound)
Un-instrumented wait
(in call, not in wait, not on CPU)
DB Time >> ASH DB Time
1. Double-counted DB Time
2. ASH dropped samples
Final advice
• Don’t believe the unbelievable
• Trust DB Time and DB CPU the most
• Be wary of ASH CPU and measured Wait times
• Always get ASH Report with AWR Report
• Don’t ponder details if the big picture is not clear
AWR Ambiguity: Performance reasoning when the numbers don't add up

AWR Ambiguity: Performance reasoning when the numbers don't add up

  • 1.
    AWR Ambiguity: 
 Performancereasoning when the numbers don’t add up John Beresniewicz Oak table founding member
 Oracle Performance maven, ASH expert, bodyboarder
  • 2.
    an Oaktable inquiry… Oaktablemember (I didn’t really understand the question)
  • 3.
    …can you sendme the AWR? Top 10 Foreground Events by Total Wait Time ~~~~~~~~~~~~~~~~~~~~~~~~~~~~~~~~~~~~~~~~~~~ Total Wait Wait % DB Wait Event Waits Time (sec) Avg(ms) time Class ------------------------------ ----------- ---------- ---------- ------ -------- db file parallel read 139,819 469.8 3.36 78.1 User I/O DB CPU 243 40.4 db file sequential read 201,921 52.4 0.26 8.7 User I/O db file scattered read 221 .5 2.21 .1 User I/O kksfbc child completion 4 .2 37.85 .0 Other control file sequential read 249 0 0.10 .0 System I Disk file Mirror Read 61 0 0.21 .0 User I/O library cache load lock 19 0 0.60 .0 Concurre cursor: pin S wait on X 4 0 1.61 .0 Concurre Disk file operations I/O 140 0 0.03 .0 User I/O CPU + Wait = DB Time 40.4 + 86.8 = 127.2% ( > 100% WTF??? )
  • 4.
  • 5.
    The Model • Summedover all foreground sessions • Wait time is active wait time (non-idle waits) • CPU and Wait time are non-overlapping DB Time = DB CPU time + Wait time
  • 6.
    The Method • Accountfor DB Time accurately • Reduce DB Time spent doing the same work • focus on large chunks of similarly spent time • If system is CPU-bound, reduce CPU time first • wait times are inaccurate and wait tuning irrelevant
  • 7.
    DB Time • Foregroundsession time in database calls • Measured by DB code using clear instrumentation points: • [call entry:start timer] • [call exit:stop timer] • System DB Time = SUM(Session DB Time) We trust DB Time accuracy implicitly
  • 8.
    DB CPU • ForegroundCPU actually used • does not include run-queue time • Measured by OS, collected by Oracle • independent instrumentation source • NOTE: AIX CPU reporting suspect for hyper-threaded cores We have high confidence in DB CPU accuracy
  • 9.
    ASH and DBTime DB Time ~ COUNT(sampled sessions) * interval • “ON CPU”: session in a call and not waiting • this is derived, not “observed” • ASH always conforms to the model: • every sample is either ON CPU or WAITING Sessions using CPU in a wait will not show as ON CPU
  • 10.
    Be mindful that… •AWR report presumes accurate instrumentation • ADDM presumes accurate instrumentation • Instrumentation is not always accurate • ergo, AWR report and ADDM may be misleading AWR and ADDM could (should) do some sanity checks
  • 11.
  • 12.
    First questions • Elapsedtime of report? • Version of Oracle DB? • bug lookup, report contents, available data • System CPU-bound?
  • 13.
    Begin at thebeginning… WORKLOAD REPOSITORY report for DB Name DB Id Instance Inst Num Startup Time Release RAC ------------ ----------- ------------ -------- --------------- ----------- --- DB12C 1329819247 db12cn1 1 04-Apr-15 06:19 12.1.0.2.0 NO Host Name Platform CPUs Cores Sockets Memory(GB) ---------------- -------------------------------- ---- ----- ------- ---------- ora1.dssdhop.lab Linux x86 64-bit 72 36 2 252.17 Snap Id Snap Time Sessions Curs/Sess --------- ------------------- -------- --------- Begin Snap: 410 04-Apr-15 06:22:16 61 .8 End Snap: 411 04-Apr-15 06:24:18 56 .7 Elapsed: 2.02 (mins) DB Time: 10.03 (mins) DB version? Elapsed time CPU bound? 12.1.0.2 2 minutes (120 secs) NO (36 >> 5 ; Cores >> AAS)
  • 14.
    Next questions • Whatis DB Time over interval? • What is DB CPU over interval? • What is (expected) Wait Time over interval? • DB Time - DB CPU = Wait Time (expected) • What does ASH indicate?
  • 15.
    Load Profile Load ProfilePer Second Per Transaction Per Exec Per Call ~~~~~~~~~~~~~~~ --------------- --------------- --------- --------- DB Time(s): 5.0 150.4 0.01 3.13 DB CPU(s): 2.0 60.8 0.00 1.27 Background CPU(s): 0.0 0.4 0.00 0.00 Time(seconds) 0 150 300 450 600 DB Time DB CPU 600 240 Wait Time 360 DB Time = 600 secs ( 5 * 120 ) DB CPU = 240 secs ( 2 * 120 ) Wait Time = 360 secs ( 600 - 240 )
  • 16.
    Adding measured waittimes… Time(seconds) 0 200 400 600 800 DB Time CPU+Wait 52 470 600 240 excess wait 162 Top 10 Foreground Events by Total Wait Time ~~~~~~~~~~~~~~~~~~~~~~~~~~~~~~~~~~~~~~~~~~~ Total Wait Wait % DB Wait Event Waits Time (sec) Avg(ms) time Class ------------------------------ ----------- ---------- ---------- ------ -------- db file parallel read 139,819 469.8 3.36 78.1 User I/O db file sequential read 201,921 52.4 0.26 8.7 User I/O
  • 17.
    What does ASHsay? Time(seconds) 0 200 400 600 800 DB Time CPU+Wait ASH 80 52 410 470 600 60 240 CPU in wait Slot Event Slot Time (Duration) Count Event Count % Event -------------------- -------- ------------------------------ -------- ------- 06:22:16 (2.0 min) 55 db file parallel read 41 74.55 db file sequential read 8 14.55 CPU + Wait for CPU 6 10.91 ASH DB Time ~ 550 ASH CPU way off
  • 18.
    What is ourconclusion? • “db file parallel read” is consuming significant CPU under wait • 162 / 470 ~ 34% of the “wait” is actually CPU • 162 * 1000 / 139,819 ~ 1.16 ms/wait • block counts >>100 blocks ~ 1MB ~ 300 MB/sec • Not technically a bug Total Wait Wait % DB Wait Event Waits Time (sec) Avg(ms) time Class ------------------------------ ----------- ---------- ---------- ------ -------- db file parallel read 139,819 469.8 3.36 78.1 User I/O The model and reality do not always agree so well
  • 19.
    Digging a bitfurther…OSSTAT Operating System Statistics DB/Inst: DB12C/db12cn1 Statistic Value End Value ------------------------- ---------------------- ---------------- BUSY_TIME 72,614 IDLE_TIME 795,376 IOWAIT_TIME 36,343 SYS_TIME 45,030 USER_TIME 27,559 LOAD 7 9 Time(seconds) 0 300 600 900 1200 Oracle AWR OSSTAT 450 363360 275240 DB CPU DB IOwait USER_TIME IOWAIT_TIME SYS_TIME? 1088 / 120 = 8.3 AAS }Non-Oracle process CPU doing I/O?
  • 20.
    So what isMr SLOB up to? • Benchmarking: pounding on parallel read wait event • Testing advanced I/O interfaces servicing this event? • SSD storage using I/O slaves perhaps? (non-DB sys time) • If we factor in ALL reads and ALL CPU: • 1000 * (450+275 tot CPU secs) / 15,496,576 tot reads • ~ 0.05 milliseconds CPU per random read
  • 21.
    Instrumentation issues andsymptoms Symptom Possible issue DB CPU >> ASH CPU (and significant wait time) CPU used within wait (this was the issue here) ASH CPU >> DB CPU System CPU-bound (ASH includes run-queue) DB Time >> DB CPU + Wait (and not CPU-bound) Un-instrumented wait (in call, not in wait, not on CPU) DB Time >> ASH DB Time 1. Double-counted DB Time 2. ASH dropped samples
  • 22.
    Final advice • Don’tbelieve the unbelievable • Trust DB Time and DB CPU the most • Be wary of ASH CPU and measured Wait times • Always get ASH Report with AWR Report • Don’t ponder details if the big picture is not clear