Downloaded 120 times

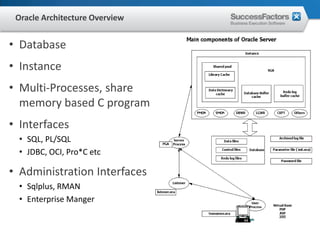
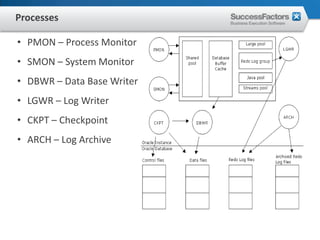
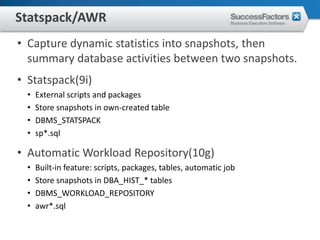
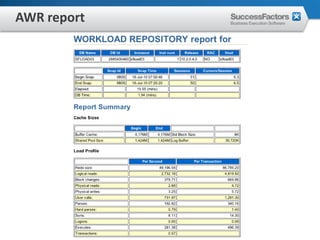
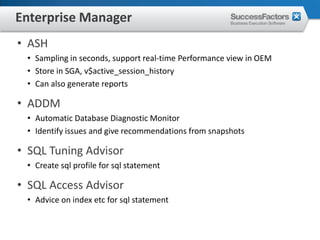
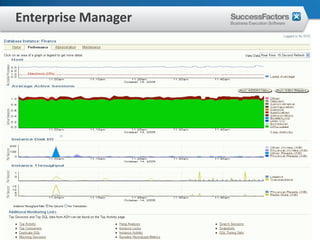


This document provides an overview of Oracle performance tuning. It discusses Oracle architecture including processes, wait events, dynamic views, and tools for performance analysis like Statspack, AWR, Enterprise Manager, SQL tracing and tuning. Key aspects of performance tuning covered include statistics, hints, query rewrite, indexing, and application-level tuning for OLTP workloads.