Downloaded 36 times


![Tracing Individual SQL Statements
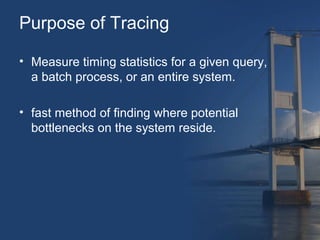
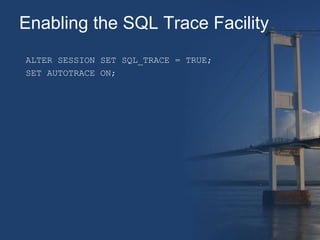
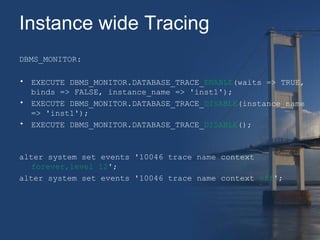
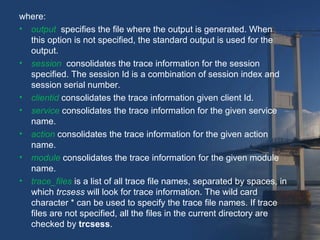
• SQL trace can be initiated for an individual SQL statement
by substituting the required SQL_ID into the following
statement.
ALTER SESSION SET EVENTS
'trace[rdbms.SQL_Optimizer.*][sql:sql_id]';
ALTER SESSION SET EVENTS
'trace[rdbms.SQL_Optimizer.*] off';
• The SQL_ID of a statement can be found in the V$SQL or
V$SQLSTAT view for recent SQL, or from the
DBA_HIST_SQLSTAT view from the AWR repository for
historical statements.](https://image.slidesharecdn.com/oracletracingsession-141122083854-conversion-gate02/85/Oracle-Tracing-14-320.jpg)
![Trcsess
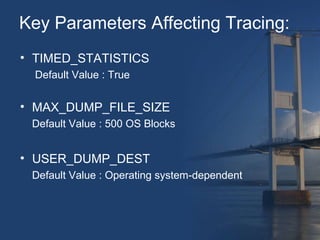
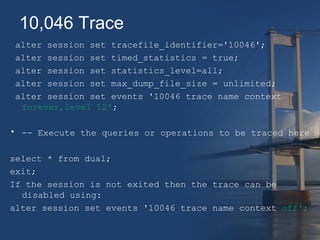
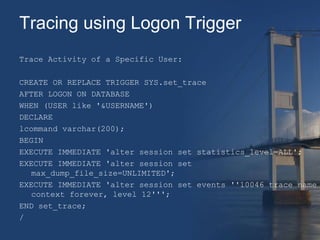
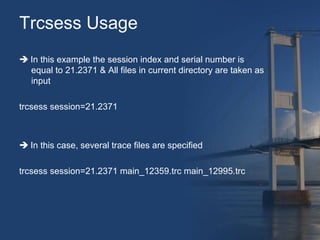
• TRCSESS is the tool offered from Oracle to consolidate
trace files. This is needed on shared server installations as
sessions are executed from different processes writing the
sql trace to different log files.
• Consolidates trace output based on Session ID, Client ID,
Service name, Action name, Module name
• After trcsess merges the trace information into a single
output file, the output file could be processed by TKPROF.
trcsess [output=output_file_name]
[session=session_id]
[clientid=client_id]
[service=service_name]
[action=action_name]
[module=module_name]
[trace_files]](https://image.slidesharecdn.com/oracletracingsession-141122083854-conversion-gate02/85/Oracle-Tracing-17-320.jpg)
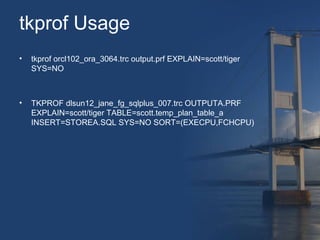
![tkprof
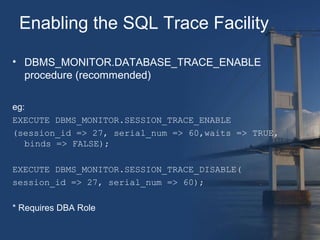
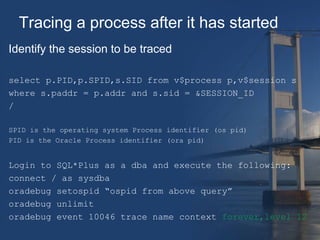
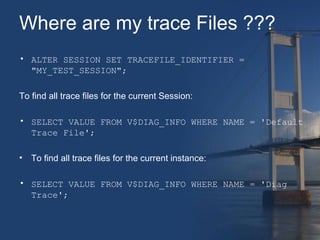
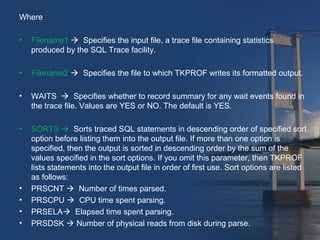
• SQL traces files are produced in raw form.
• tkprof utility can be used to translate it to more Human
Readable form
• Tkprof does not control the contents of a trace file, it simply
formats them
Usage: tkprof tracefile outputfile [explain= ] [table= ]
[print= ] [insert= ] [sys= ] [sort= ]](https://image.slidesharecdn.com/oracletracingsession-141122083854-conversion-gate02/85/Oracle-Tracing-20-320.jpg)
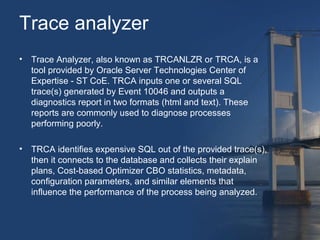
![Trace analyzer Output
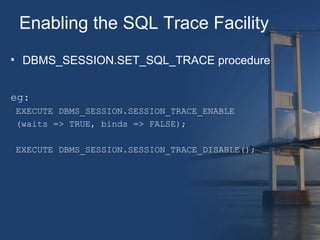
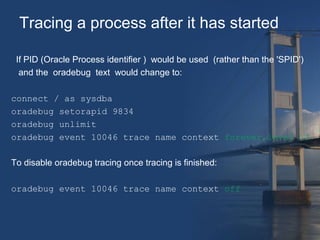
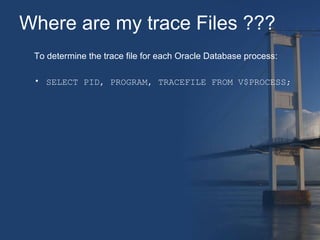
• TRCANLZR (TRCA): SQL_TRACE/Event 10046 Trace
File Analyzer - Tool for Interpreting Raw SQL Traces [ID
224270.1]
HTML Document](https://image.slidesharecdn.com/oracletracingsession-141122083854-conversion-gate02/85/Oracle-Tracing-26-320.jpg)

![Reference
• Oracle® Database Administrator's Guide 11g Release 1 (11.1) -
chapter 21 Using Application Tracing Tools
• How To Collect 10046 Trace (SQL_TRACE) Diagnostics for
Performance Issues [ID 376442.1]
• http://www.oracle-base.com/articles/misc/sql-trace-10046-trcsess-and-tkprof.• http://docs.oracle.com/cd/B19306_01/appdev.102/b14258/d_monitor.htm
• TRCANLZR (TRCA): SQL_TRACE/Event 10046 Trace File
Analyzer - Tool for Interpreting Raw SQL Traces [ID 224270.1]](https://image.slidesharecdn.com/oracletracingsession-141122083854-conversion-gate02/85/Oracle-Tracing-28-320.jpg)


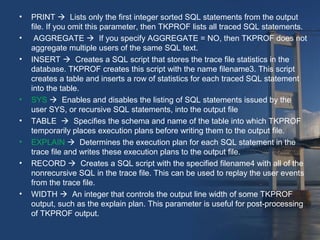
This document provides an overview of Oracle tracing tools and techniques. It discusses general Oracle tracing, 10,046 tracing, and the trace analyzer. It covers enabling tracing at the session and system level using procedures like DBMS_MONITOR and ALTER SESSION. Key trace files and parameters are also explained. Tools for analyzing trace files like TKPROF and TRCANLZR are described. The document provides examples of using tracing tools to diagnose performance issues.