The document discusses the Oracle database optimizer, detailing its evolution from a rule-based optimizer (RBO) to a cost-based optimizer (CBO), which considers various factors for determining efficient SQL execution plans. It outlines the significance of object and system statistics in optimizing SQL performance, highlights the limitations of the CBO, and introduces features from Oracle 12c that enhance query optimization. The document also addresses statistical gathering practices for tables and indexes to maintain performance efficiency.
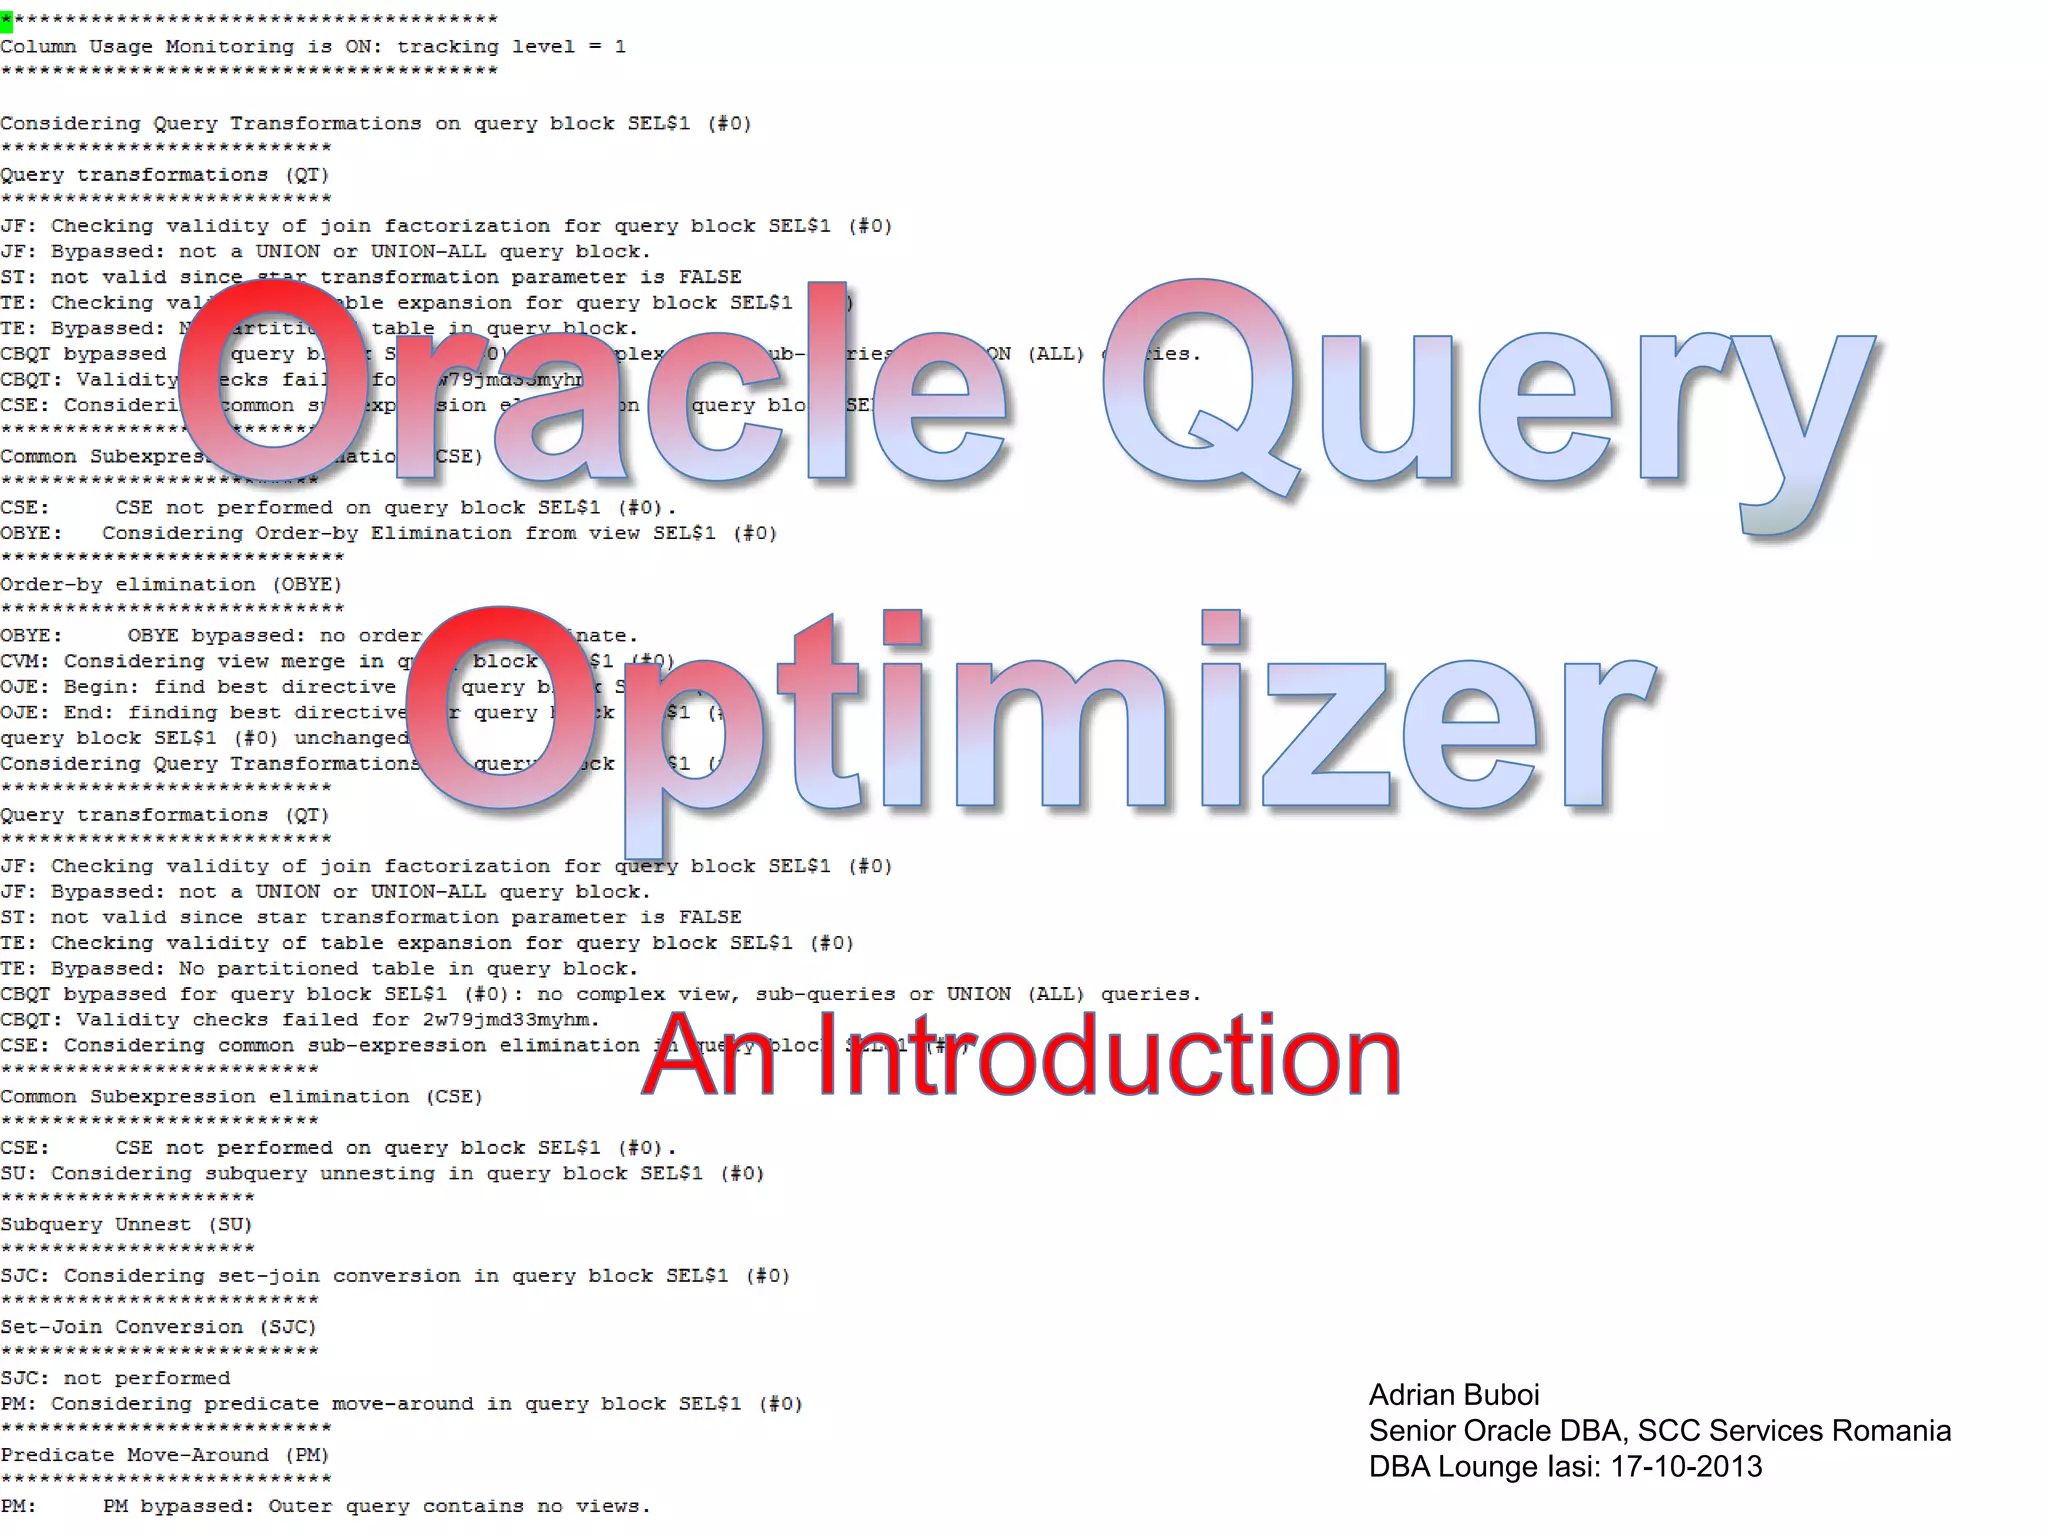


![• Oracle 10053 Event trace = generates a trace file containing Optimizer’s actions when
generating an Execution Plan
• Traced simple query: SELECT … FROM on Oracle 11.2.0.3 EE 64bit on top of Oracle
Linux Server 6.3
DBMS_SYSTEM.SET_EV(si=>123, se=>1234, ev=>10053, le=>1, nm=>' ');
ALTER SESSION SET events '10053 trace name context forever, level 1';
ALTER SESSION SET events 'trace[rdbms.SQL_Optimizer.*][sql:SQL_ID]';
• Sections of interest from the trace file:
• Legend = abbreviations used by optimizer trace
• Parameters used by the optimizer [including Bug Fix Control Environment]
• Query Transformations
• Peeked values of the binds in SQL statement
• System statistics information
• Base statistical information [Object statistics]
• Access path analysis (includes Cost)
• Optimizer statistics and computations [General Plans, Join Permutations,
Execution Plan – includes Cost]
6](https://image.slidesharecdn.com/the-20oracle-20query-20optimizer-131018075817-phpapp01/75/Oracle-Query-Optimizer-An-Introduction-6-2048.jpg)


![321 parameters in the 10053 Optimizer trace file
• 64 we can fiddle with on prod without asking Oracle Support
• 257 hidden
•
•
•
•
•
•
•
•
OPTIMIZER_MODE [default: ALL_ROWS; other values: first_rows_[1 | 10 | 100 | 1000] | first_rows]
DB_FILE_MULTIBLOCK_READ_COUNT [see next slides]
OPTIMIZER_DYNAMIC_SAMPLING [default value: 2; range of values: 0 - 10]
OPTIMIZER_FEATURES_ENABLE [default value: 11.2.0.1; range of values: 8.0.0 … 11.2.0.1]
QUERY_REWRITE_ENABLED [default: true]
QUERY_REWRITE_INTEGRITY [default: enforced]
STAR_TRANSFORMATION_ENABLED [default: false]
PGA_AGGREGATE_TARGET (WORKAREA_SIZE_POLICY = AUTO) [default: MAX(10Mb,
20% of SGA size)]
• BITMAP_MERGE_AREA_SIZE, HASH_AREA_SIZE , SORT_AREA_SIZE,
SORT_AREA_RETAIN (WORKAREA_SIZE_POLICY = MANUAL)
• OPTIMIZER_INDEX_CACHING [default: 0, range of values: 0 - 100]
• OPTIMIZER_INDEX_COST_ADJ [default: 100, range of values: 1 - 10000]
• PARALLEL_*
13](https://image.slidesharecdn.com/the-20oracle-20query-20optimizer-131018075817-phpapp01/75/Oracle-Query-Optimizer-An-Introduction-13-2048.jpg)
![The DB_FILE_MULTIBLOCK_READ_COUNT Odyssey
Official documentation quotes:
<q>
DB_FILE_MULTIBLOCK_READ_COUNT is one of the parameters you can use to minimize
I/O during table scans. It specifies the maximum number of blocks read in one I/O
operation during a sequential scan.
[…]
As of Oracle Database 10g release 2, the default value of this parameter is a value that
corresponds to the maximum I/O size that can be performed efficiently. This value is
platform-dependent and is 1MB for most platforms.
[…]
Note that if the number of sessions is extremely large the multiblock read count value is
decreased to avoid the buffer cache getting flooded with too many table scan buffers.
[…]
Even though the default value may be a large value, the optimizer will not favor large
plans if you do not set this parameter. It would do so only if you explicitly set this
parameter to a large value.
</q>
Oracle® Database Reference 11g Release 2 (11.2)
14](https://image.slidesharecdn.com/the-20oracle-20query-20optimizer-131018075817-phpapp01/75/Oracle-Query-Optimizer-An-Introduction-14-2048.jpg)

![The DB_FILE_MULTIBLOCK_READ_COUNT Odyssey
From OS
strace –pPID
readv(258, [{"624200253001~213*00024210223001000-410v213*0"..., 8192},
{"624200254001~213*00024k1001000-410v213*0"..., 8192}, {"624200255001~213*00024372323001000410v213*0"..., 8192}, {"624200256001~213*00024G.001000-410v213*0"..., 8192},
{"624200257001~213*00024272212001000-410v213*0"..., 8192}], 5) = 40960
readv(258, [{"624200260001~213*00024@=001000-410v213*0"..., 8192},
{"624200261001~213*00024315324001000-410v213*0"..., 8192},
{"624200262001~213*0002417722001000-410v213*0"..., 8192},
{"624200263001~213*00024214235001000-410v213*0"..., 8192}, {"624200264001~213*00024l25001000410v213*0"..., 8192}, {"624200265001~213*00020045W001000-410v213*0"..., 8192},
{"624200266001~213*00024235274001000-410v213*0"..., 8192}, {"624200267001~213*00024A9001000410v213*0"..., 8192}], 8) = 65536
readv(258, [{"624200271001200213*00024255352001000-410v213*0"..., 8192},
{"624200272001200213*00024~U001000-410v213*0"..., 8192},
{"624200273001200213*00024355263001000-410v213*0"..., 8192},
{"624200274001200213*00024[l001000-410v213*0"..., 8192},
{"624200275001200213*00024222310001000-410v213*0"..., 8192},
{"624200276001200213*00024Y364001000-410v213*0"..., 8192},
{"624200277001200213*000242720001000-410v213*0"..., 8192}], 7) = 57344
readv(258, […], 8) = 65536
readv(258, […], 7) = 57344
readv(258, […], 8) = 65536
readv(258, […], 7) = 57344
readv(258, […], 8) = 65536
readv(258, […], 7) = 57344
readv(258, […], 8) = 65536
readv(258, […], 7) = 57344
readv(258, […], 8) = 65536
readv(258, […], 7) = 57344
readv(258, […], 8) = 65536
readv(258, […], 7) = 57344
readv(258, […], 8) = 65536
pread(258, "624200202101231213*00014>277001000-410v213*0"..., 81920, 3162112) = 81920
pread(258, "624200214101231213*00014333177001000-410v213*0"..., 81920, 3244032) = 81920
pread(258, "624200226101231213*00010041264001000-410v213*0"..., 81920, 3325952) = 81920
pread(258, "624200240101231213*00024305u001000-410v213*0"..., 81920, 3407872) = 81920
pread(258, "624200252101231213*000240251001000-410v213*0"..., 81920, 3489792) = 81920
pread(258, "624200252101231213*000240251001000-410v213*0"..., 81920, 3489792) = 81920
readv(258, [{"624200276101231213*00024273-001000-410v213*0"..., 8192}, {"624200277101231213*000200
40223001000-410v213*0"..., 8192}, {"624200300101231213*00024331,001000-410v213*0"..., 8192}, {"6242
00301101231213*00024b235001000-410v213*0"..., 8192}, {"624200302101231213*00024u262001000-41
16
0v213*0"..., 8192}, {"624200303101231213*00024356H001000-410v213*0"..., 8192}, {"624200304101231213*
000242720001000-410v213*0"..., 8192}], 7) = 57344](https://image.slidesharecdn.com/the-20oracle-20query-20optimizer-131018075817-phpapp01/75/Oracle-Query-Optimizer-An-Introduction-16-2048.jpg)


![I/O cost of multiblock read
Fairly common SETUP:
•
NOWORKLOAD statistics, db_block_size = 8k
•
db_file_multiblock_read_count set to 128 in spfile: ALTER SESSION SET db_file_multiblock_read_count = 128
* ensure MBRC comes from an explicit setting in parameter file, not from the automatically Oracle-computed one when MRBC is not explicitly set
10053 CBO Trace
PLAN_TABLE_OUTPUT
---------------------------------------------------------------------------SQL_ID 2w79jmd33myhm, child number 0
------------------------------------select * from people
Plan hash value: 2528372185
---------------------------------------------------------------------------| Id | Operation
| Name
| Rows | Bytes | Cost (%CPU)| Time
|
---------------------------------------------------------------------------|
0 | SELECT STATEMENT |
|
|
|
36 (100)|
|
|
1 | TABLE ACCESS FULL| PEOPLE | 10000 | 1240K|
36
(0)| 00:00:01 |
---------------------------------------------------------------------------delete plan_table;
explain plan for select * from people;
select io_cost, cpu_cost from plan_table where
id=1;
IO_COST CPU_COST
------- -------36 3902924
select blocks from user_tables where
table_name='PEOPLE';
BLOCKS
ceil ( blocks
-----197
Access path analysis for PEOPLE
***************************************
SINGLE TABLE ACCESS PATH
Single Table Cardinality Estimation for PEOPLE[PEOPLE]
Table: PEOPLE Alias: PEOPLE
Card: Original: 10000.000000 Rounded: 10000 Computed:
10000.00 Non Adjusted: 10000.00
Access Path: TableScan
Cost: 36.19 Resp: 36.19 Degree: 0
Cost_io: 36.00 Cost_cpu: 3902924
Resp_io: 36.00 Resp_cpu: 3902924
Best:: AccessPath: TableScan
Cost: 36.19 Degree: 1 Resp: 36.19 Card: 10000.00
Bytes: 0
***************************************
CPU cost transformed to number of single-block reads per second
cpu_cost/(cpuspeed*sredtim*1000)
COST = I/O cost + CPU cost
/ db_file_multiblock_read_count * mreadtim / sreadtim ) + 1
ioseektim + db_block_size/iotfrspeed
ioseektim + db_file_multiblock_read_count * db_block_size/iotfrspeed
select * from
SNAME
------------SYSSTATS_MAIN
SYSSTATS_MAIN
SYSSTATS_MAIN
sys.aux_stats$ where pname in ('CPUSPEEDNW', 'IOSEEKTIM', 'IOTFRSPEED');
PNAME
PVAL1 PVAL2
---------- ---------- ----CPUSPEEDNW 1751.75879
IOSEEKTIM
10
IOTFRSPEED
4096
CPU
sreadtim = 10 + 8192 / 4096 = 12
mreadtim = 10 + 128 * 8192 / 4096 = 266
IO cost = ceil (197 / 128 * 266 / 12) + 1 = 36
20
cost = (3902924/(1751.75879 * 12 * 1000)) = .185666924
* COST formula from Christian Antognini, after unsuccessfullly using the formula from Oracle 9i Performance Tuning Guide](https://image.slidesharecdn.com/the-20oracle-20query-20optimizer-131018075817-phpapp01/75/Oracle-Query-Optimizer-An-Introduction-20-2048.jpg)