The document provides a comprehensive overview of execution plans in SQL, specifically focusing on how to gather, display, and interpret these plans. It outlines key concepts such as row sources, hierarchical plan tables, and various commands like EXPLAIN PLAN for analyzing SQL statements. Additionally, it discusses tools like AWR and specific SQL views that assist in managing and optimizing execution plans.
![Copyright © 2012, Oracle and/or its affiliates. All rights reserved.
6 - 13
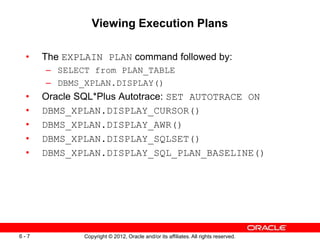
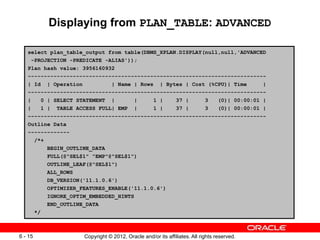
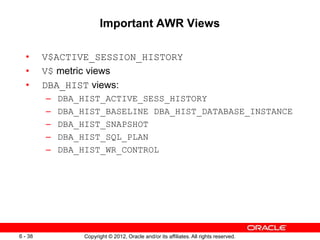
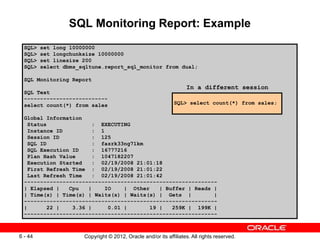
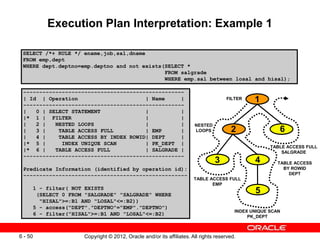
Displaying from PLAN_TABLE: ALL
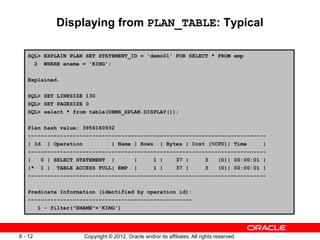
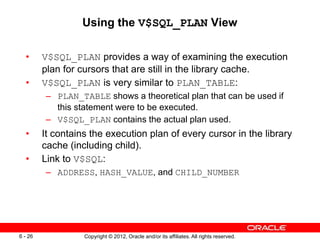
SQL> select * from table(DBMS_XPLAN.DISPLAY(null,null,'ALL'));
Plan hash value: 3956160932
--------------------------------------------------------------------------
| Id | Operation | Name | Rows | Bytes | Cost (%CPU)| Time |
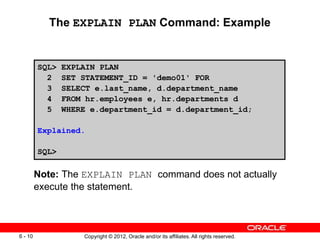
--------------------------------------------------------------------------
| 0 | SELECT STATEMENT | | 1 | 37 | 3 (0)| 00:00:01 |
|* 1 | TABLE ACCESS FULL| EMP | 1 | 37 | 3 (0)| 00:00:01 |
--------------------------------------------------------------------------
Query Block Name / Object Alias (identified by operation id):
-------------------------------------------------------------
1 - SEL$1 / EMP@SEL$1
Predicate Information (identified by operation id):
---------------------------------------------------
1 - filter("ENAME"='KING')
Column Projection Information (identified by operation id):
-----------------------------------------------------------
1 - "EMP"."EMPNO"[NUMBER,22], "ENAME"[VARCHAR2,10], "EMP"."JOB"[VARCHAR2,9],
"EMP"."MGR"[NUMBER,22], "EMP"."HIREDATE"[DATE,7], "EMP"."SAL"[NUMBER,22],
"EMP"."COMM"[NUMBER,22], "EMP"."DEPTNO"[NUMBER,22]](https://image.slidesharecdn.com/d73549gc1006-230419073918-070c60b5/85/D73549GC10_06-pptx-12-320.jpg)
![Copyright © 2012, Oracle and/or its affiliates. All rights reserved.
6 - 20
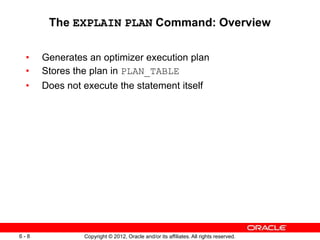
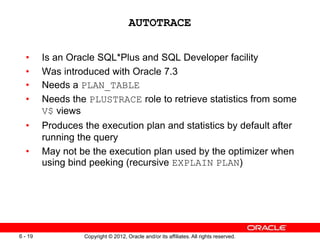
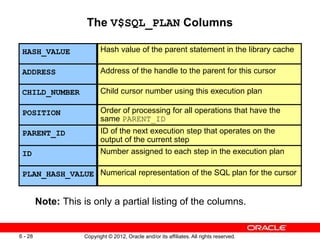
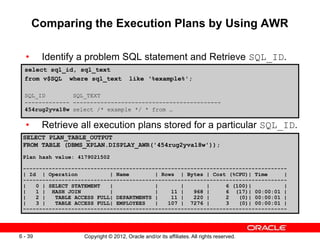
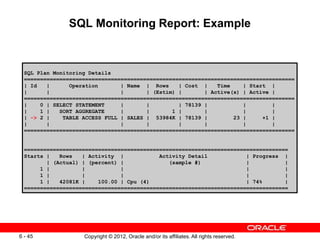
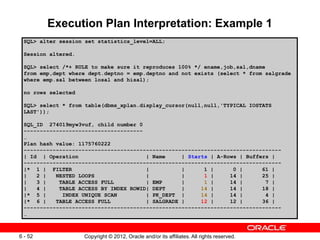
The AUTOTRACE Syntax
OFF
TRACE[ONLY]
EXPLAIN
STATISTICS
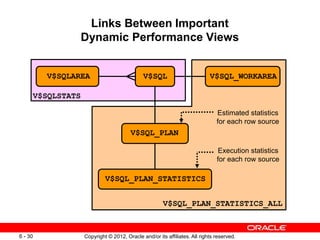
SHOW AUTOTRACE
SET AUTOTRACE ON](https://image.slidesharecdn.com/d73549gc1006-230419073918-070c60b5/85/D73549GC10_06-pptx-19-320.jpg)


![[DSC Europe 25] Elena Menshikova - AI-Powered Operational Excellence: Revolut...](https://cdn.slidesharecdn.com/ss_thumbnails/es6nholbqy3zaao2c2yd-2-elena-menshikova-data-ai-in-decision-making-260115093812-4fba8b38-thumbnail.jpg?width=640&height=640&fit=bounds)


![[DSC Europe 25] Ivan Lukovic & Marija Djukic - From Data to Value: Why Maturi...](https://cdn.slidesharecdn.com/ss_thumbnails/ahrfps8xr6knowwhacxh-1-ivan-marija-dsc-2025-ld-v1-presentation-260115093812-be21adfc-thumbnail.jpg?width=640&height=640&fit=bounds)


![[DSC Europe 25] Slobodan Dolinic - Smart and Intelligent Green Region.pptx](https://cdn.slidesharecdn.com/ss_thumbnails/0bribinjsp6ghwtvsvor-2-sigre-slobodan-dolinic-260115093812-c9c10e90-thumbnail.jpg?width=640&height=640&fit=bounds)


