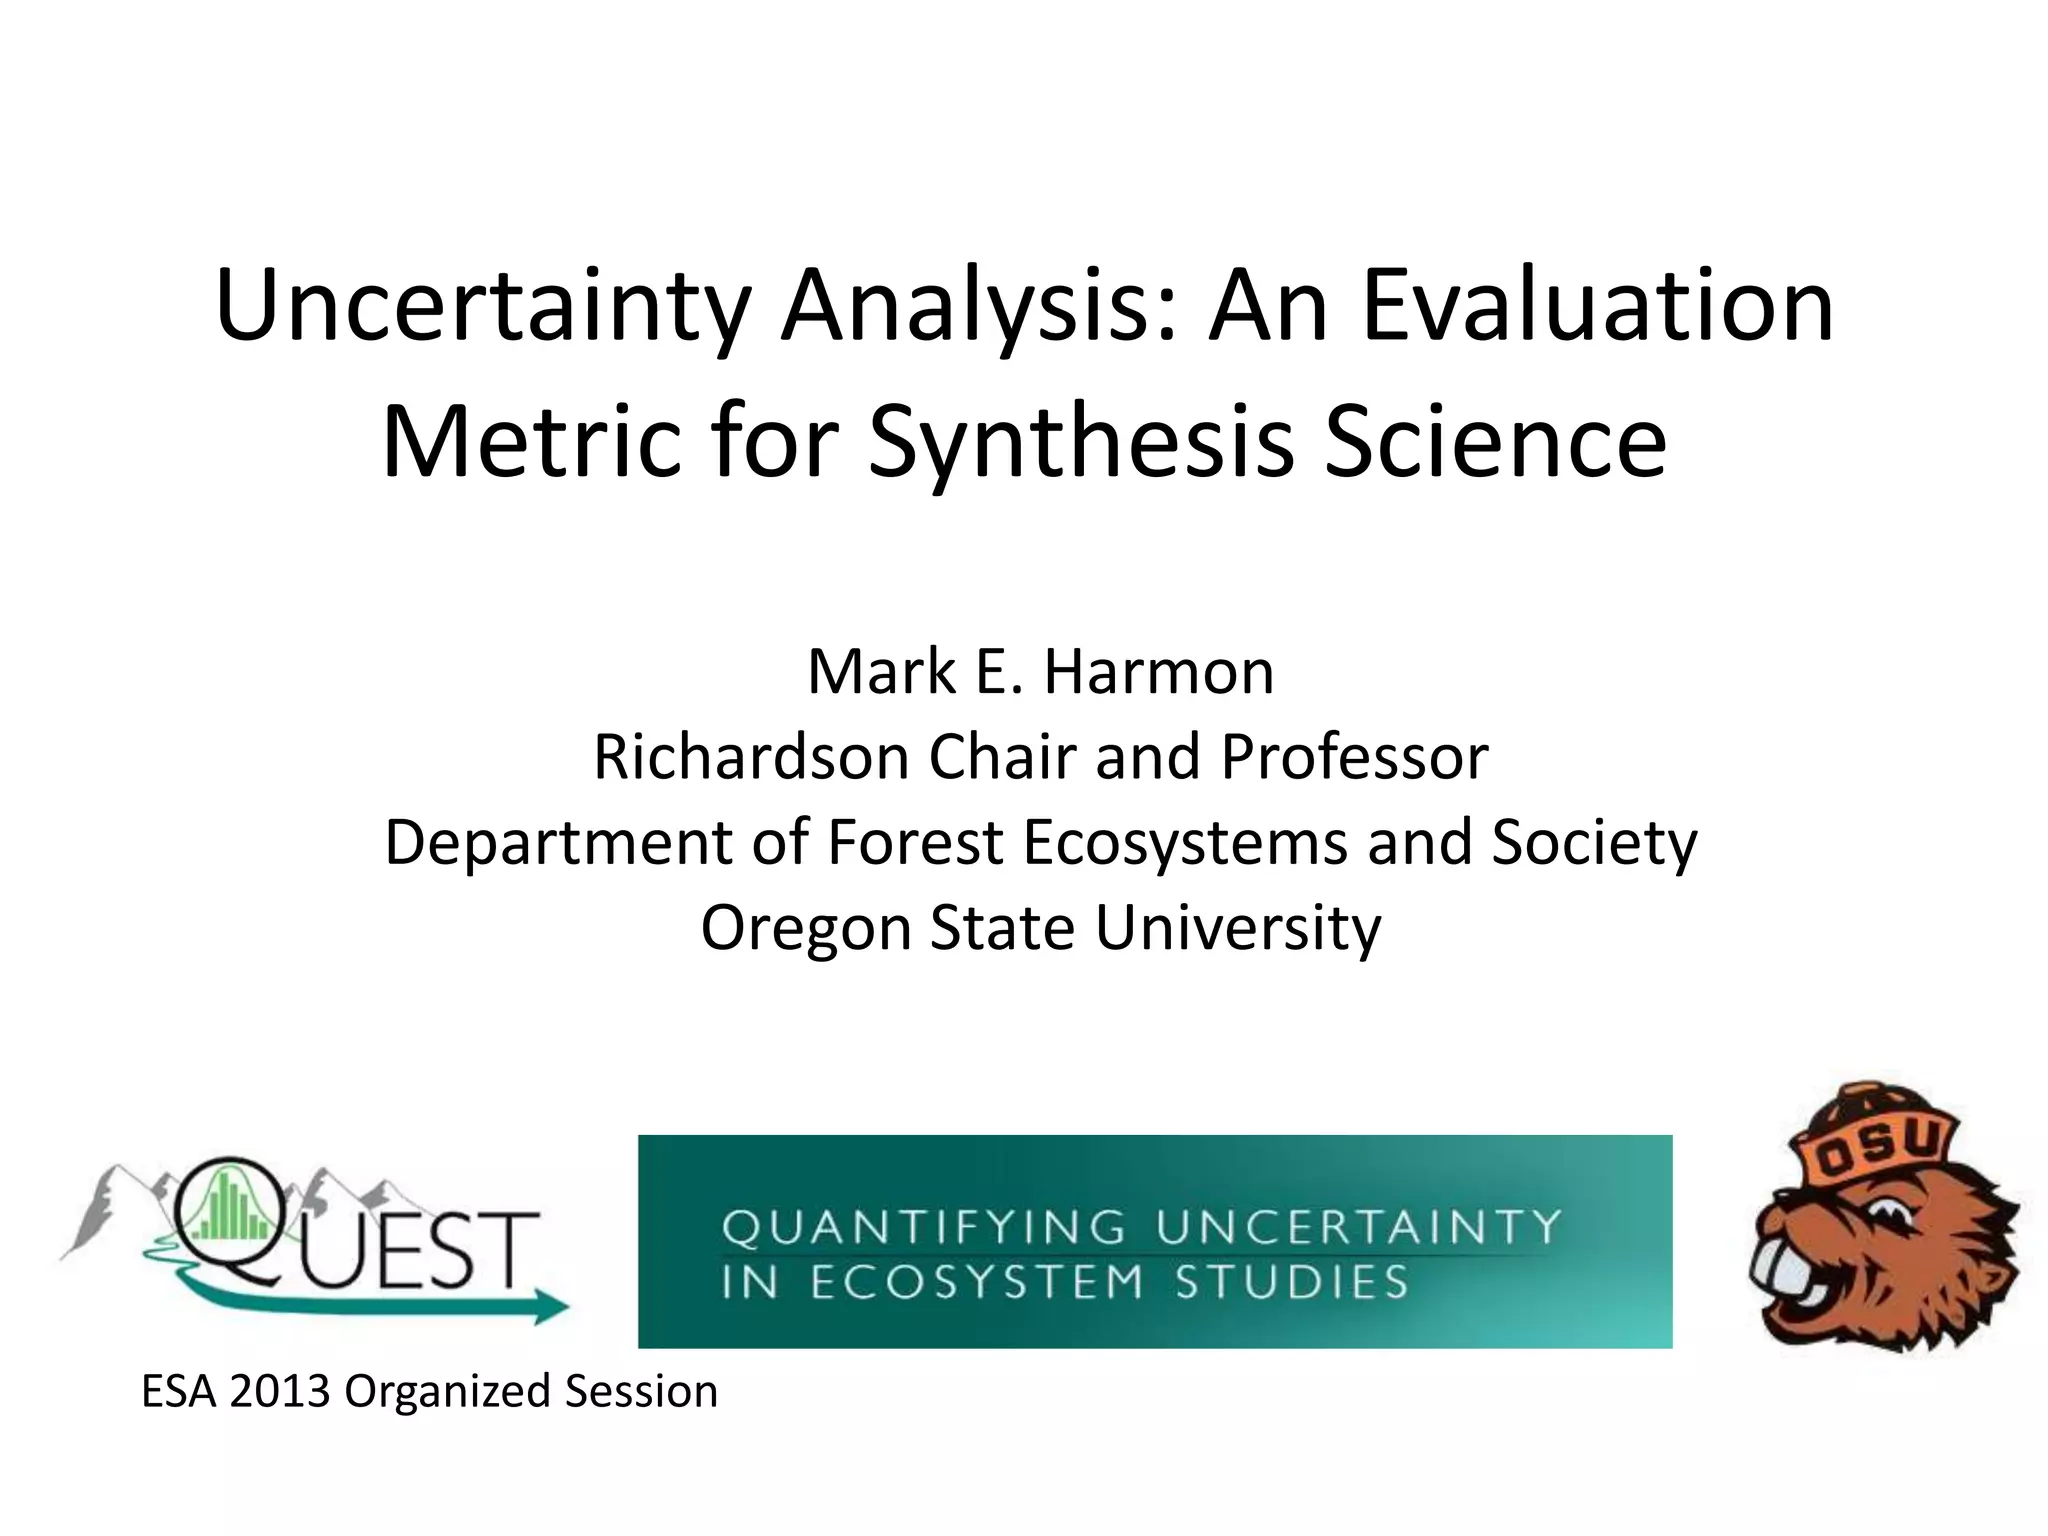
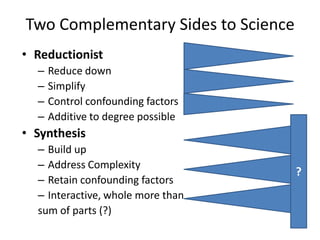
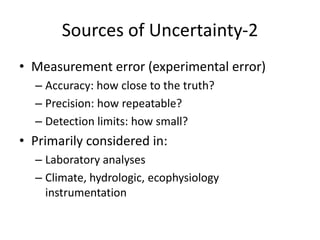
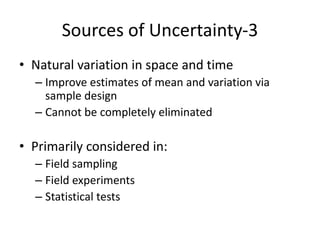
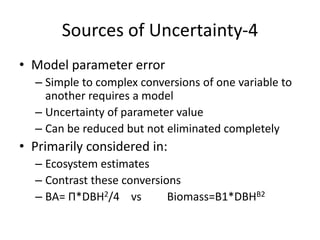
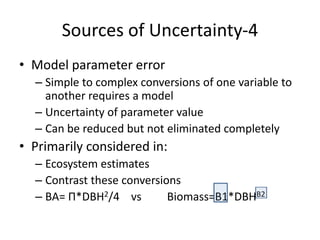
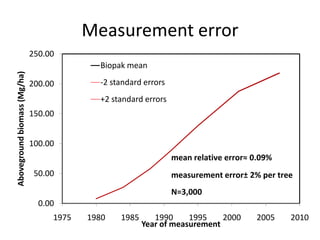
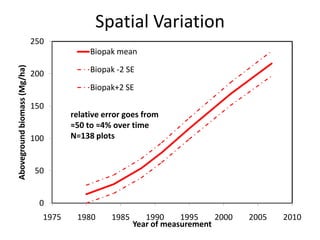
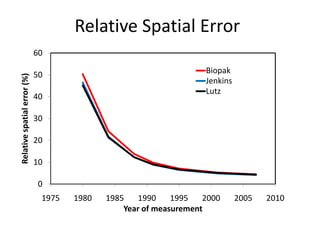
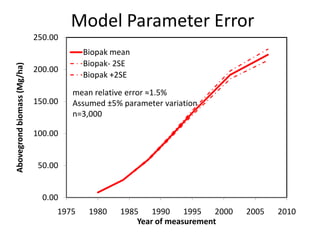
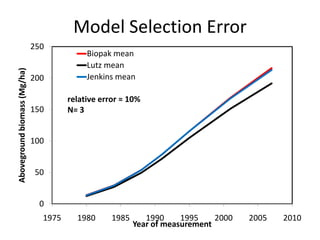
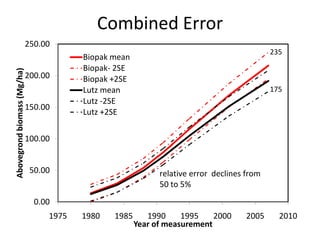
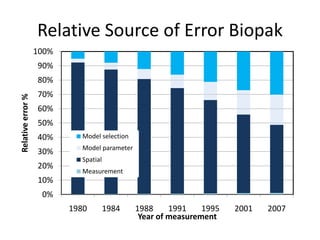
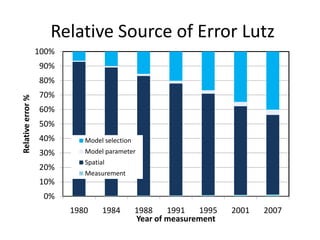
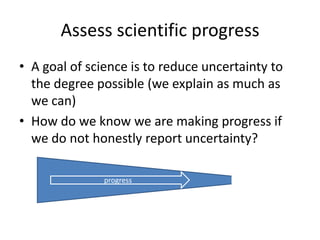
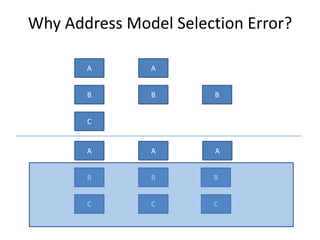
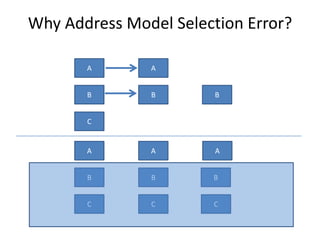
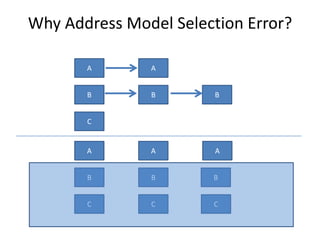
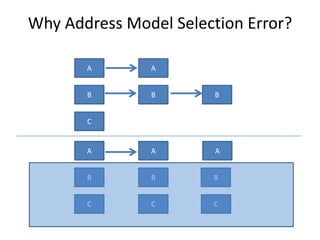
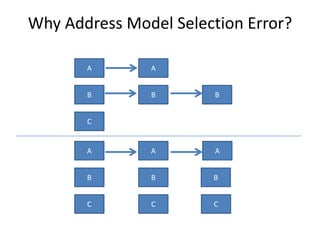
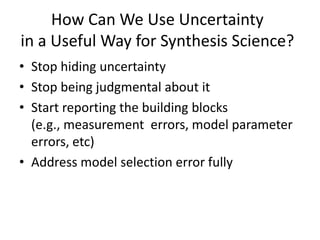
Uncertainty Analysis: An Evaluation
Metric for Synthesis Science
Mark E. Harmon
Richardson Chair and Professor
Department of Forest Ecosystems and Society
Oregon State University
ESA 2013 Organized Session
Two Complementary Sides to Science
• Reductionist
– Reduce down
– Simplify
– Control confounding factors
– Additive to degree possible
• Synthesis
– Build up
– Address Complexity
– Retain confounding factors
– Interactive, whole more than
sum of parts (?)
?
Sources of Uncertainty-1
• Measurement error (experimental error)
• Natural variation in space and time
• Model parameter error
• Model selection error
Sources of Uncertainty-2
• Measurement error (experimental error)
– Accuracy: how close to the truth?
– Precision: how repeatable?
– Detection limits: how small?
• Primarily considered in:
– Laboratory analyses
– Climate, hydrologic, ecophysiology
instrumentation
Sources of Uncertainty-3
• Natural variation in space and time
– Improve estimates of mean and variation via
sample design
– Cannot be completely eliminated
• Primarily considered in:
– Field sampling
– Field experiments
– Statistical tests
Sources of Uncertainty-4
• Model parameter error
– Simple to complex conversions of one variable to
another requires a model
– Uncertainty of parameter value
– Can be reduced but not eliminated completely
• Primarily considered in:
– Ecosystem estimates
– Contrast these conversions
– BA= Π*DBH2/4 vs Biomass=B1*DBHB2
Sources of Uncertainty-5
• Model selection error
– Knowledge uncertainty of how to proceed
– Introduces a systematic, not a random error
– Can only be reduced with more knowledge
• Primarily considered in:
– Ecosystem estimates
– Simulation models
– Synthetic efforts
– Example: Are tree stems
• Cones? Neiloids? or Paraboloids?
Watershed 1
H. J. Andrews Experimental Forest
Before
Before burning
20 yrs after burning
30 yrs after burning
Measurement error
0.00
50.00
100.00
150.00
200.00
250.00
1975 1980 1985 1990 1995 2000 2005 2010
Abovegroundbiomass(Mg/ha)
Year of measurement
Biopak mean
-2 standard errors
+2 standard errors
mean relative error≈ 0.09%
measurement error± 2% per tree
N=3,000
Spatial Variation
0
50
100
150
200
250
1975 1980 1985 1990 1995 2000 2005 2010
Abovegroundbiomass(Mg/ha)
Year of measurement
Biopak mean
Biopak -2 SE
Biopak+2 SE
relative error goes from
≈50 to ≈4% over time
N=138 plots
Relative Spatial Error
0
10
20
30
40
50
60
1975 1980 1985 1990 1995 2000 2005 2010
Relativespatialerror(%)
Year of measurement
Biopak
Jenkins
Lutz
Model Parameter Error
0.00
50.00
100.00
150.00
200.00
250.00
1975 1980 1985 1990 1995 2000 2005 2010
Abovegrondbiomass(Mg/ha)
Year of measurement
Biopak mean
Biopak- 2SE
Biopak +2SE
mean relative error ≈1.5%
Assumed ±5% parameter variation
n=3,000
Model Selection Error
0
50
100
150
200
250
1975 1980 1985 1990 1995 2000 2005 2010
Abovegroundbiomass(Mg/ha)
Year of measurement
Biopak mean
Lutz mean
Jenkins mean
relative error ≈ 10%
N= 3
Combined Error
0.00
50.00
100.00
150.00
200.00
250.00
1975 1980 1985 1990 1995 2000 2005 2010
Abovegrondbiomass(Mg/ha)
Year of measurement
Biopak mean
Biopak- 2SE
Biopak +2SE
Lutz mean
Lutz -2SE
Lutz +2SE
relative error declines from
50 to 5%
175
235
Relative Source of Error Biopak
0%
10%
20%
30%
40%
50%
60%
70%
80%
90%
100%
1980 1984 1988 1991 1995 2001 2007
Relativeerror%
Year of measurement
Model selection
Model parameter
Spatial
Measurement
Relative Source of Error Lutz
0%
10%
20%
30%
40%
50%
60%
70%
80%
90%
100%
1980 1984 1988 1991 1995 2001 2007
Relativeerror%
Year of measurement
Model selection
Model parameter
Spatial
Measurement
How can we use uncertainty in
synthesis science?
Which set of numbers differs?
• 10 versus 10.1
• 10 versus 100
Which set of numbers differs?
• 10 versus 10.1
• 10 versus 100
Which set of numbers differs?
• 10 versus 10.1
• 10 versus 100
Assess scientific progress
• A goal of science is to reduce uncertainty to
the degree possible (we explain as much as
we can)
• How do we know we are making progress if
we do not honestly report uncertainty?
progress
Why Address Model Selection Error?
A
B
C
A
B
C
A
B B
A
B
C
A
B
C
Why Address Model Selection Error?
A
B
C
A
B
C
A
B B
A
B
C
A
B
C
Why Address Model Selection Error?
A
B
C
A
B
C
A
B B
A
B
C
A
B
C
Why Address Model Selection Error?
A
B
C
A
B
C
A
B B
A
B
C
A
B
C
Why Address Model Selection Error?
A
B
C
A
B
C
A
B B
A
B
C
A
B
C
Why Address Model Selection Error?
A
B
C
A
B
C
A
B B
A
B
C
A
B
C
Where does the uncertainty lie?
And what do we do about it?
• Measurement-improve
precision, accuracy, detection limits
• Natural variation-improve sampling design
• Model parameter-improve estimates of
parameters
• Model selection-improve knowledge or use
models that are truly general
Conclusions
• We need to start somewhere
– We may not know everything, but that has always
been true
– Unknown unknowns that are unknowable
– We do know uncertainty is not zero and it is not
infinite
• We need to develop:
– ways to effectively estimate uncertainty
– standard guidelines of how to report and analyze
– publication expectations
Thanks to:
• Becky G. Fasth
• The QUEST team
• Ruth Yanai
• Everyone that collected the WS01 data
• NSF Andrews LTER; Quest RCN; Richardson
Endowment
Example of Quantifying Uncertainty
• Carbon budget for WS01
• Old-growth Douglas-fir/western hemlock
forest harvested in 1964-66
• Seeded and planted numerous times
• Repeated measurement of diameter at ground
and breast height of tagged trees in 100 plus
plots
• Status of trees (live, dead, ingrowth) also
noted
How Can We Use Uncertainty
in a Useful Way for Synthesis Science?
• Stop hiding uncertainty
• Stop being judgmental about it
• Start reporting the building blocks
(e.g., measurement errors, model parameter
errors, etc)
• Address model selection error fully

Harmon, Uncertainty analysis: An evaluation metric for synthesis science

  • 1.
    Uncertainty Analysis: AnEvaluation Metric for Synthesis Science Mark E. Harmon Richardson Chair and Professor Department of Forest Ecosystems and Society Oregon State University ESA 2013 Organized Session
  • 2.
    Two Complementary Sidesto Science • Reductionist – Reduce down – Simplify – Control confounding factors – Additive to degree possible • Synthesis – Build up – Address Complexity – Retain confounding factors – Interactive, whole more than sum of parts (?) ?
  • 3.
    Sources of Uncertainty-1 •Measurement error (experimental error) • Natural variation in space and time • Model parameter error • Model selection error
  • 4.
    Sources of Uncertainty-2 •Measurement error (experimental error) – Accuracy: how close to the truth? – Precision: how repeatable? – Detection limits: how small? • Primarily considered in: – Laboratory analyses – Climate, hydrologic, ecophysiology instrumentation
  • 5.
    Sources of Uncertainty-3 •Natural variation in space and time – Improve estimates of mean and variation via sample design – Cannot be completely eliminated • Primarily considered in: – Field sampling – Field experiments – Statistical tests
  • 6.
    Sources of Uncertainty-4 •Model parameter error – Simple to complex conversions of one variable to another requires a model – Uncertainty of parameter value – Can be reduced but not eliminated completely • Primarily considered in: – Ecosystem estimates – Contrast these conversions – BA= Π*DBH2/4 vs Biomass=B1*DBHB2
  • 7.
    Sources of Uncertainty-4 •Model parameter error – Simple to complex conversions of one variable to another requires a model – Uncertainty of parameter value – Can be reduced but not eliminated completely • Primarily considered in: – Ecosystem estimates – Contrast these conversions – BA= Π*DBH2/4 vs Biomass=B1*DBHB2
  • 8.
    Sources of Uncertainty-5 •Model selection error – Knowledge uncertainty of how to proceed – Introduces a systematic, not a random error – Can only be reduced with more knowledge • Primarily considered in: – Ecosystem estimates – Simulation models – Synthetic efforts – Example: Are tree stems • Cones? Neiloids? or Paraboloids?
  • 9.
    Sources of Uncertainty-5 •Model selection error – Knowledge uncertainty of how to proceed – Introduces a systematic, not a random error – Can only be reduced with more knowledge • Primarily considered in: – Ecosystem estimates – Simulation models – Synthetic efforts – Example: Are tree stems • Cones? Neiloids? or Paraboloids?
  • 10.
    Watershed 1 H. J.Andrews Experimental Forest Before Before burning 20 yrs after burning 30 yrs after burning
  • 11.
    Measurement error 0.00 50.00 100.00 150.00 200.00 250.00 1975 19801985 1990 1995 2000 2005 2010 Abovegroundbiomass(Mg/ha) Year of measurement Biopak mean -2 standard errors +2 standard errors mean relative error≈ 0.09% measurement error± 2% per tree N=3,000
  • 12.
    Spatial Variation 0 50 100 150 200 250 1975 19801985 1990 1995 2000 2005 2010 Abovegroundbiomass(Mg/ha) Year of measurement Biopak mean Biopak -2 SE Biopak+2 SE relative error goes from ≈50 to ≈4% over time N=138 plots
  • 13.
    Relative Spatial Error 0 10 20 30 40 50 60 19751980 1985 1990 1995 2000 2005 2010 Relativespatialerror(%) Year of measurement Biopak Jenkins Lutz
  • 14.
    Model Parameter Error 0.00 50.00 100.00 150.00 200.00 250.00 19751980 1985 1990 1995 2000 2005 2010 Abovegrondbiomass(Mg/ha) Year of measurement Biopak mean Biopak- 2SE Biopak +2SE mean relative error ≈1.5% Assumed ±5% parameter variation n=3,000
  • 15.
    Model Selection Error 0 50 100 150 200 250 19751980 1985 1990 1995 2000 2005 2010 Abovegroundbiomass(Mg/ha) Year of measurement Biopak mean Lutz mean Jenkins mean relative error ≈ 10% N= 3
  • 16.
    Combined Error 0.00 50.00 100.00 150.00 200.00 250.00 1975 19801985 1990 1995 2000 2005 2010 Abovegrondbiomass(Mg/ha) Year of measurement Biopak mean Biopak- 2SE Biopak +2SE Lutz mean Lutz -2SE Lutz +2SE relative error declines from 50 to 5% 175 235
  • 17.
    Relative Source ofError Biopak 0% 10% 20% 30% 40% 50% 60% 70% 80% 90% 100% 1980 1984 1988 1991 1995 2001 2007 Relativeerror% Year of measurement Model selection Model parameter Spatial Measurement
  • 18.
    Relative Source ofError Lutz 0% 10% 20% 30% 40% 50% 60% 70% 80% 90% 100% 1980 1984 1988 1991 1995 2001 2007 Relativeerror% Year of measurement Model selection Model parameter Spatial Measurement
  • 19.
    How can weuse uncertainty in synthesis science?
  • 20.
    Which set ofnumbers differs? • 10 versus 10.1 • 10 versus 100
  • 21.
    Which set ofnumbers differs? • 10 versus 10.1 • 10 versus 100
  • 22.
    Which set ofnumbers differs? • 10 versus 10.1 • 10 versus 100
  • 23.
    Assess scientific progress •A goal of science is to reduce uncertainty to the degree possible (we explain as much as we can) • How do we know we are making progress if we do not honestly report uncertainty? progress
  • 24.
    Why Address ModelSelection Error? A B C A B C A B B A B C A B C
  • 25.
    Why Address ModelSelection Error? A B C A B C A B B A B C A B C
  • 26.
    Why Address ModelSelection Error? A B C A B C A B B A B C A B C
  • 27.
    Why Address ModelSelection Error? A B C A B C A B B A B C A B C
  • 28.
    Why Address ModelSelection Error? A B C A B C A B B A B C A B C
  • 29.
    Why Address ModelSelection Error? A B C A B C A B B A B C A B C
  • 30.
    Where does theuncertainty lie? And what do we do about it? • Measurement-improve precision, accuracy, detection limits • Natural variation-improve sampling design • Model parameter-improve estimates of parameters • Model selection-improve knowledge or use models that are truly general
  • 31.
    Conclusions • We needto start somewhere – We may not know everything, but that has always been true – Unknown unknowns that are unknowable – We do know uncertainty is not zero and it is not infinite • We need to develop: – ways to effectively estimate uncertainty – standard guidelines of how to report and analyze – publication expectations
  • 32.
    Thanks to: • BeckyG. Fasth • The QUEST team • Ruth Yanai • Everyone that collected the WS01 data • NSF Andrews LTER; Quest RCN; Richardson Endowment
  • 33.
    Example of QuantifyingUncertainty • Carbon budget for WS01 • Old-growth Douglas-fir/western hemlock forest harvested in 1964-66 • Seeded and planted numerous times • Repeated measurement of diameter at ground and breast height of tagged trees in 100 plus plots • Status of trees (live, dead, ingrowth) also noted
  • 34.
    How Can WeUse Uncertainty in a Useful Way for Synthesis Science? • Stop hiding uncertainty • Stop being judgmental about it • Start reporting the building blocks (e.g., measurement errors, model parameter errors, etc) • Address model selection error fully