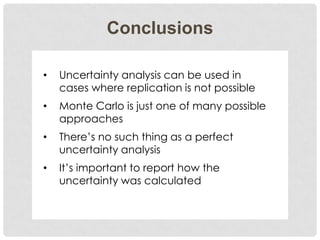
Quantifying Uncertainty in Ecology:
Examples from Small Watershed Studies

John Campbell – US Forest Service
Ruth Yanai – SUNY-ESF
Mark Green – Plymouth State Univ.
Ecological Society of America Meeting
Minneapolis, MN - August 2013
LTER Workshop Participants
Sites

Fernow - WV
Biscuit Brook - NY
HJ Andrews - OR
Luquillo - PR
Niwot Ridge – CO
Marcell - MN
Sleepers River – VT
Coweeta – NC

Campbell, J.L., Yanai, R.D., Green, M.B., Levine, C. R, Adams, M.B.,
Burns, D.A., Buso, D.C., Harmon, M.E., LaDeau, S.L., McDowell, W.H.,
Parman, J.N., Sebestyen, S.D., Shanley, J.B., Vose, J.M.
QUEST is a NSF funded Research
Coordination Network (PI: Ruth Yanai)
The goal is to improve understanding and
facilitate use of uncertainty analyses in
ecosystem studies.
Become a part of QUEST!
•Visit our website
(www.quantifyinguncertainty.org)
•Download papers and
presentations
•Get sample code
•Stay updated with QUEST News
•Join our mailing list
(quantifyinguncertainty@gmail.com)
•Meet us for dinner tonight
(7pm - Hell’s Kitchen)
Paired watershed studies
• Watersheds are
unreplicated
• It’s difficult to find
suitable replicate
watersheds and
expensive to treat them
• Uncertainty analysis can
be used to report
statistical confidence

Andréassian 2004 Journal of
Hydrology 29:1-27
Easier said than done…
• Difficult to identify
sources of
uncertainty
• Difficult to quantify
sources
• Multiple approaches
to uncertainty
analysis
• No single answer
Uncertainty in the flux of Ca
W6

W5

• Net hydrologic flux = precipitation inputs minus stream outputs
• W5 - whole tree harvest during winter of 1983-1984

• All trees >5 cm dbh were removed (boles and branches)
• Purpose: evaluate impact of this more intensive management
practice on nutrient removals and site productivity
Net hydrologic flux (kg ha-1 yr-1)

Ca response to harvesting
0

Harvest

-3
-6
-9
-12
-15
-18

W6 (reference)
W5 (harvested)

-21
-24
1960

1970

1980

1990

2000

Water year (June 1)
Calcium data courtesy G.E. Likens

2010
Sources of uncertainty
Precipitation

Stream water

• Interpolation model

• Watershed area

• Collector undercatch

• Rating curve

• Chemical analysis

• Gaps in discharge

• Gaps in chemistry

• Chemical analysis
• Streamwater

interpolation model
Precipitation interpolation method
W3

Thiessen polygon

W3

Kriging

W2
W6 W5 W4 W1

W2
W6 W5 W4 W1

W8
W7

W8
W7

W9

W9

W3

W3

Inverse distance
weighting

Spline

W2
W6 W5 W4 W1

W2
W6 W5 W4 W1

W8

W8
W7

W7

W9

W9

W3

Regression

W2
W6 W5 W4 W1

W8
W7

W9

Precip. gage
Watershed

1000

Precip.

0

1000 m

1600 mm
Precipitation interpolation method
1520

Annual precip. (mm)

1500
1480
1460

Thiessen
Kriging
IDW
Spline
Regression

1440
1420
1400
1380
1360
1340
W1 W2 W3 W4 W5 W6 W7 W8 W9

Uncertainty = 0.6%
Chemical analyses
• Precision describes
the variation in
replicate analysis of
the same sample

• At Hubbard Brook,
one sample of every
40 is analyzed four
times

Uncertainty = 1.0%
Watershed area
Watershed area

W6

Uncertainty = 2.3%
Gaps in streamflow

•
•

7% of streamflow record is gaps
65% due to the chart recorder (53% clock)
Gaps in streamflow
•

Randomly generate fake gaps

•

Fill the gaps based on regression from the
reference watershed

•

Calculate the different
between the predicted
and actual value

•

Repeat thousands of
times

•

More detail to follow

Uncertainty = 3.3%
What is Monte Carlo analysis?
Monte Carlo simulations use repeated, random
sampling to compute results.
1) Select a distribution to describe possible
values (not necessary to assume a
normal distribution)

2) Generate data from this distribution
3) Use the generated data as possible
values in the calculation to produce output
Monte Carlo approach
Watershed Area

Streamflow
Etc.

Net Hydrologic Flux

Calculation
Net hydrologic flux (kg ha-1 yr-1)

Ca response to harvesting
0
-3

Harvest
Harvest

-6
-9
-12
-15
-18
W6 (reference)
W5 (harvested)

-21
-24
1960

1970

1980

1990

Water year (June 1)

2000

2010
W5 Ca net hydrologic flux (kg/ha./yr)

Ca response to harvesting
0

-5

-10

-15

-20

-25
-25

-20

-15

-10

-5

W6 Ca Net hydrologic flux (kg/ha/yr)

0
Contributions to uncertainty
Conclusions
•

Uncertainty analysis can be used in
cases where replication is not possible

•

Monte Carlo is just one of many possible
approaches

•

There’s no such thing as a perfect
uncertainty analysis

•

It’s important to report how the
uncertainty was calculated
Acknowledgments
LTER Workshop Participants
Craig See
Brannon Barr

Gene Likens
Amey Bailey
Ian Halm
Nick Grant
Tammy Wooster
Brenda Minicucci
Funding was provided by the NSF and LTER Network
Office. Calcium data were obtained through funding
from the A.W. Mellon Foundation and the
NSF, including LTER and LTREB.
www.quantifyinguncertainty.org

Campbell, Quantifying uncertainty in ecology: Examples from small watershed studies.

  • 1.
    Quantifying Uncertainty inEcology: Examples from Small Watershed Studies John Campbell – US Forest Service Ruth Yanai – SUNY-ESF Mark Green – Plymouth State Univ. Ecological Society of America Meeting Minneapolis, MN - August 2013
  • 2.
    LTER Workshop Participants Sites Fernow- WV Biscuit Brook - NY HJ Andrews - OR Luquillo - PR Niwot Ridge – CO Marcell - MN Sleepers River – VT Coweeta – NC Campbell, J.L., Yanai, R.D., Green, M.B., Levine, C. R, Adams, M.B., Burns, D.A., Buso, D.C., Harmon, M.E., LaDeau, S.L., McDowell, W.H., Parman, J.N., Sebestyen, S.D., Shanley, J.B., Vose, J.M.
  • 3.
    QUEST is aNSF funded Research Coordination Network (PI: Ruth Yanai) The goal is to improve understanding and facilitate use of uncertainty analyses in ecosystem studies.
  • 4.
    Become a partof QUEST! •Visit our website (www.quantifyinguncertainty.org) •Download papers and presentations •Get sample code •Stay updated with QUEST News •Join our mailing list (quantifyinguncertainty@gmail.com) •Meet us for dinner tonight (7pm - Hell’s Kitchen)
  • 5.
    Paired watershed studies •Watersheds are unreplicated • It’s difficult to find suitable replicate watersheds and expensive to treat them • Uncertainty analysis can be used to report statistical confidence Andréassian 2004 Journal of Hydrology 29:1-27
  • 6.
    Easier said thandone… • Difficult to identify sources of uncertainty • Difficult to quantify sources • Multiple approaches to uncertainty analysis • No single answer
  • 7.
    Uncertainty in theflux of Ca W6 W5 • Net hydrologic flux = precipitation inputs minus stream outputs • W5 - whole tree harvest during winter of 1983-1984 • All trees >5 cm dbh were removed (boles and branches) • Purpose: evaluate impact of this more intensive management practice on nutrient removals and site productivity
  • 8.
    Net hydrologic flux(kg ha-1 yr-1) Ca response to harvesting 0 Harvest -3 -6 -9 -12 -15 -18 W6 (reference) W5 (harvested) -21 -24 1960 1970 1980 1990 2000 Water year (June 1) Calcium data courtesy G.E. Likens 2010
  • 9.
    Sources of uncertainty Precipitation Streamwater • Interpolation model • Watershed area • Collector undercatch • Rating curve • Chemical analysis • Gaps in discharge • Gaps in chemistry • Chemical analysis • Streamwater interpolation model
  • 10.
    Precipitation interpolation method W3 Thiessenpolygon W3 Kriging W2 W6 W5 W4 W1 W2 W6 W5 W4 W1 W8 W7 W8 W7 W9 W9 W3 W3 Inverse distance weighting Spline W2 W6 W5 W4 W1 W2 W6 W5 W4 W1 W8 W8 W7 W7 W9 W9 W3 Regression W2 W6 W5 W4 W1 W8 W7 W9 Precip. gage Watershed 1000 Precip. 0 1000 m 1600 mm
  • 11.
    Precipitation interpolation method 1520 Annualprecip. (mm) 1500 1480 1460 Thiessen Kriging IDW Spline Regression 1440 1420 1400 1380 1360 1340 W1 W2 W3 W4 W5 W6 W7 W8 W9 Uncertainty = 0.6%
  • 12.
    Chemical analyses • Precisiondescribes the variation in replicate analysis of the same sample • At Hubbard Brook, one sample of every 40 is analyzed four times Uncertainty = 1.0%
  • 13.
  • 14.
  • 15.
    Gaps in streamflow • • 7%of streamflow record is gaps 65% due to the chart recorder (53% clock)
  • 16.
    Gaps in streamflow • Randomlygenerate fake gaps • Fill the gaps based on regression from the reference watershed • Calculate the different between the predicted and actual value • Repeat thousands of times • More detail to follow Uncertainty = 3.3%
  • 17.
    What is MonteCarlo analysis? Monte Carlo simulations use repeated, random sampling to compute results. 1) Select a distribution to describe possible values (not necessary to assume a normal distribution) 2) Generate data from this distribution 3) Use the generated data as possible values in the calculation to produce output
  • 18.
    Monte Carlo approach WatershedArea Streamflow Etc. Net Hydrologic Flux Calculation
  • 19.
    Net hydrologic flux(kg ha-1 yr-1) Ca response to harvesting 0 -3 Harvest Harvest -6 -9 -12 -15 -18 W6 (reference) W5 (harvested) -21 -24 1960 1970 1980 1990 Water year (June 1) 2000 2010
  • 20.
    W5 Ca nethydrologic flux (kg/ha./yr) Ca response to harvesting 0 -5 -10 -15 -20 -25 -25 -20 -15 -10 -5 W6 Ca Net hydrologic flux (kg/ha/yr) 0
  • 21.
  • 22.
    Conclusions • Uncertainty analysis canbe used in cases where replication is not possible • Monte Carlo is just one of many possible approaches • There’s no such thing as a perfect uncertainty analysis • It’s important to report how the uncertainty was calculated
  • 23.
    Acknowledgments LTER Workshop Participants CraigSee Brannon Barr Gene Likens Amey Bailey Ian Halm Nick Grant Tammy Wooster Brenda Minicucci Funding was provided by the NSF and LTER Network Office. Calcium data were obtained through funding from the A.W. Mellon Foundation and the NSF, including LTER and LTREB.
  • 24.