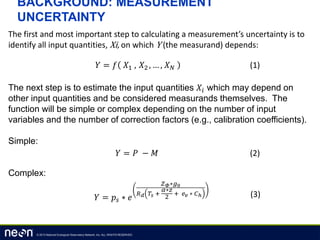
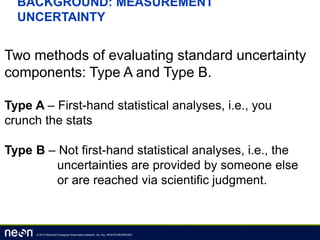
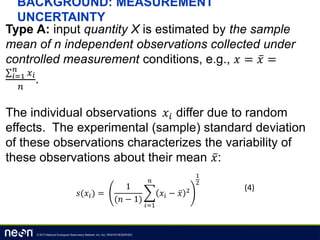
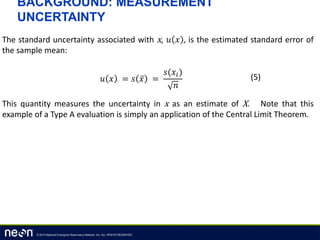
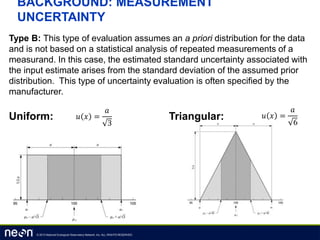
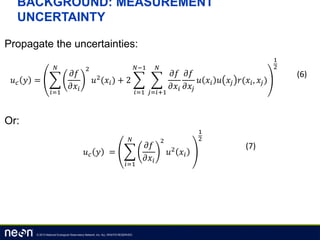
© 2013 National Ecological Observatory Network, Inc. ALL RIGHTS RESERVED.
QUANTIFYING MEASUREMENT UNCERTAINTY
AN INTRODUCTION
JOSH ROBERTI
© 2013 National Ecological Observatory Network, Inc. ALL RIGHTS RESERVED.
BACKGROUND: MEASUREMENT
UNCERTAINTY
The first and most important step to calculating a measurement’s uncertainty is to
identify all input quantities, Xi, on which Y (the measurand) depends:
The next step is to estimate the input quantities 𝑋𝑖 which may depend on
other input quantities and be considered measurands themselves. The
function will be simple or complex depending on the number of input
variables and the number of correction factors (e.g., calibration coefficients).
Simple:
Complex:
𝑌 = 𝑓 𝑋1 , 𝑋2 , … , 𝑋 𝑁 (1)
𝑌 = 𝑃 − 𝑀 (2)
𝑌 = 𝑝𝑠 ∗ 𝑒
𝑍 𝛷∗𝑔0
𝑅 𝑑 𝑇𝑠 +
𝛼∗𝑧
2
+ 𝑒 𝑣 ∗ 𝐶ℎ (3)
© 2013 National Ecological Observatory Network, Inc. ALL RIGHTS RESERVED.
BACKGROUND: MEASUREMENT
UNCERTAINTY
Two methods of evaluating standard uncertainty
components: Type A and Type B.
Type A – First-hand statistical analyses, i.e., you
crunch the stats
Type B – Not first-hand statistical analyses, i.e., the
uncertainties are provided by someone else
or are reached via scientific judgment.
© 2013 National Ecological Observatory Network, Inc. ALL RIGHTS RESERVED.
BACKGROUND: MEASUREMENT
UNCERTAINTY
Type A: input quantity X is estimated by the sample
mean of n independent observations collected under
controlled measurement conditions, e.g., 𝑥 = 𝑥 =
𝑖=1
𝑛
𝑥 𝑖
𝑛
.
The individual observations 𝑥𝑖 differ due to random
effects. The experimental (sample) standard deviation
of these observations characterizes the variability of
these observations about their mean 𝑥:
𝑠(𝑥𝑖) =
1
(𝑛 − 1)
𝑖=1
𝑛
𝑥𝑖 − 𝑥 2
1
2
(4)
© 2013 National Ecological Observatory Network, Inc. ALL RIGHTS RESERVED.
BACKGROUND: MEASUREMENT
UNCERTAINTY
The standard uncertainty associated with x, 𝑢 𝑥 , is the estimated standard error of
the sample mean:
This quantity measures the uncertainty in x as an estimate of X. Note that this
example of a Type A evaluation is simply an application of the Central Limit Theorem.
𝑢 𝑥 = 𝑠 𝑥 =
𝑠(𝑥𝑖)
𝑛
(5)
© 2013 National Ecological Observatory Network, Inc. ALL RIGHTS RESERVED.
BACKGROUND: MEASUREMENT
UNCERTAINTY
Type B: This type of evaluation assumes an a priori distribution for the data
and is not based on a statistical analysis of repeated measurements of a
measurand. In this case, the estimated standard uncertainty associated with
the input estimate arises from the standard deviation of the assumed prior
distribution. This type of uncertainty evaluation is often specified by the
manufacturer.
Uniform: Triangular:𝑢 𝑥 =
𝑎
3
𝑢 𝑥 =
𝑎
6
© 2013 National Ecological Observatory Network, Inc. ALL RIGHTS RESERVED.
BACKGROUND: MEASUREMENT
UNCERTAINTY
Propagate the uncertainties:
Or:
𝑢 𝑐 𝑦 =
𝑖=1
𝑁
𝜕𝑓
𝜕𝑥𝑖
2
𝑢2
(𝑥𝑖) + 2
𝑖=1
𝑁−1
𝑗=𝑖+1
𝑁
𝜕𝑓
𝜕𝑥𝑖
𝜕𝑓
𝜕𝑥𝑗
𝑢 𝑥𝑖 𝑢 𝑥𝑗 𝑟(𝑥𝑖, 𝑥𝑗)
1
2
(6)
𝑢 𝑐 𝑦 =
𝑖=1
𝑁
𝜕𝑓
𝜕𝑥𝑖
2
𝑢2
𝑥𝑖
1
2
(7)

Roberti esa 2014 quantifying measurement uncertainty

  • 1.
    © 2013 NationalEcological Observatory Network, Inc. ALL RIGHTS RESERVED. QUANTIFYING MEASUREMENT UNCERTAINTY AN INTRODUCTION JOSH ROBERTI
  • 2.
    © 2013 NationalEcological Observatory Network, Inc. ALL RIGHTS RESERVED. BACKGROUND: MEASUREMENT UNCERTAINTY The first and most important step to calculating a measurement’s uncertainty is to identify all input quantities, Xi, on which Y (the measurand) depends: The next step is to estimate the input quantities 𝑋𝑖 which may depend on other input quantities and be considered measurands themselves. The function will be simple or complex depending on the number of input variables and the number of correction factors (e.g., calibration coefficients). Simple: Complex: 𝑌 = 𝑓 𝑋1 , 𝑋2 , … , 𝑋 𝑁 (1) 𝑌 = 𝑃 − 𝑀 (2) 𝑌 = 𝑝𝑠 ∗ 𝑒 𝑍 𝛷∗𝑔0 𝑅 𝑑 𝑇𝑠 + 𝛼∗𝑧 2 + 𝑒 𝑣 ∗ 𝐶ℎ (3)
  • 3.
    © 2013 NationalEcological Observatory Network, Inc. ALL RIGHTS RESERVED. BACKGROUND: MEASUREMENT UNCERTAINTY Two methods of evaluating standard uncertainty components: Type A and Type B. Type A – First-hand statistical analyses, i.e., you crunch the stats Type B – Not first-hand statistical analyses, i.e., the uncertainties are provided by someone else or are reached via scientific judgment.
  • 4.
    © 2013 NationalEcological Observatory Network, Inc. ALL RIGHTS RESERVED. BACKGROUND: MEASUREMENT UNCERTAINTY Type A: input quantity X is estimated by the sample mean of n independent observations collected under controlled measurement conditions, e.g., 𝑥 = 𝑥 = 𝑖=1 𝑛 𝑥 𝑖 𝑛 . The individual observations 𝑥𝑖 differ due to random effects. The experimental (sample) standard deviation of these observations characterizes the variability of these observations about their mean 𝑥: 𝑠(𝑥𝑖) = 1 (𝑛 − 1) 𝑖=1 𝑛 𝑥𝑖 − 𝑥 2 1 2 (4)
  • 5.
    © 2013 NationalEcological Observatory Network, Inc. ALL RIGHTS RESERVED. BACKGROUND: MEASUREMENT UNCERTAINTY The standard uncertainty associated with x, 𝑢 𝑥 , is the estimated standard error of the sample mean: This quantity measures the uncertainty in x as an estimate of X. Note that this example of a Type A evaluation is simply an application of the Central Limit Theorem. 𝑢 𝑥 = 𝑠 𝑥 = 𝑠(𝑥𝑖) 𝑛 (5)
  • 6.
    © 2013 NationalEcological Observatory Network, Inc. ALL RIGHTS RESERVED. BACKGROUND: MEASUREMENT UNCERTAINTY Type B: This type of evaluation assumes an a priori distribution for the data and is not based on a statistical analysis of repeated measurements of a measurand. In this case, the estimated standard uncertainty associated with the input estimate arises from the standard deviation of the assumed prior distribution. This type of uncertainty evaluation is often specified by the manufacturer. Uniform: Triangular:𝑢 𝑥 = 𝑎 3 𝑢 𝑥 = 𝑎 6
  • 7.
    © 2013 NationalEcological Observatory Network, Inc. ALL RIGHTS RESERVED. BACKGROUND: MEASUREMENT UNCERTAINTY Propagate the uncertainties: Or: 𝑢 𝑐 𝑦 = 𝑖=1 𝑁 𝜕𝑓 𝜕𝑥𝑖 2 𝑢2 (𝑥𝑖) + 2 𝑖=1 𝑁−1 𝑗=𝑖+1 𝑁 𝜕𝑓 𝜕𝑥𝑖 𝜕𝑓 𝜕𝑥𝑗 𝑢 𝑥𝑖 𝑢 𝑥𝑗 𝑟(𝑥𝑖, 𝑥𝑗) 1 2 (6) 𝑢 𝑐 𝑦 = 𝑖=1 𝑁 𝜕𝑓 𝜕𝑥𝑖 2 𝑢2 𝑥𝑖 1 2 (7)