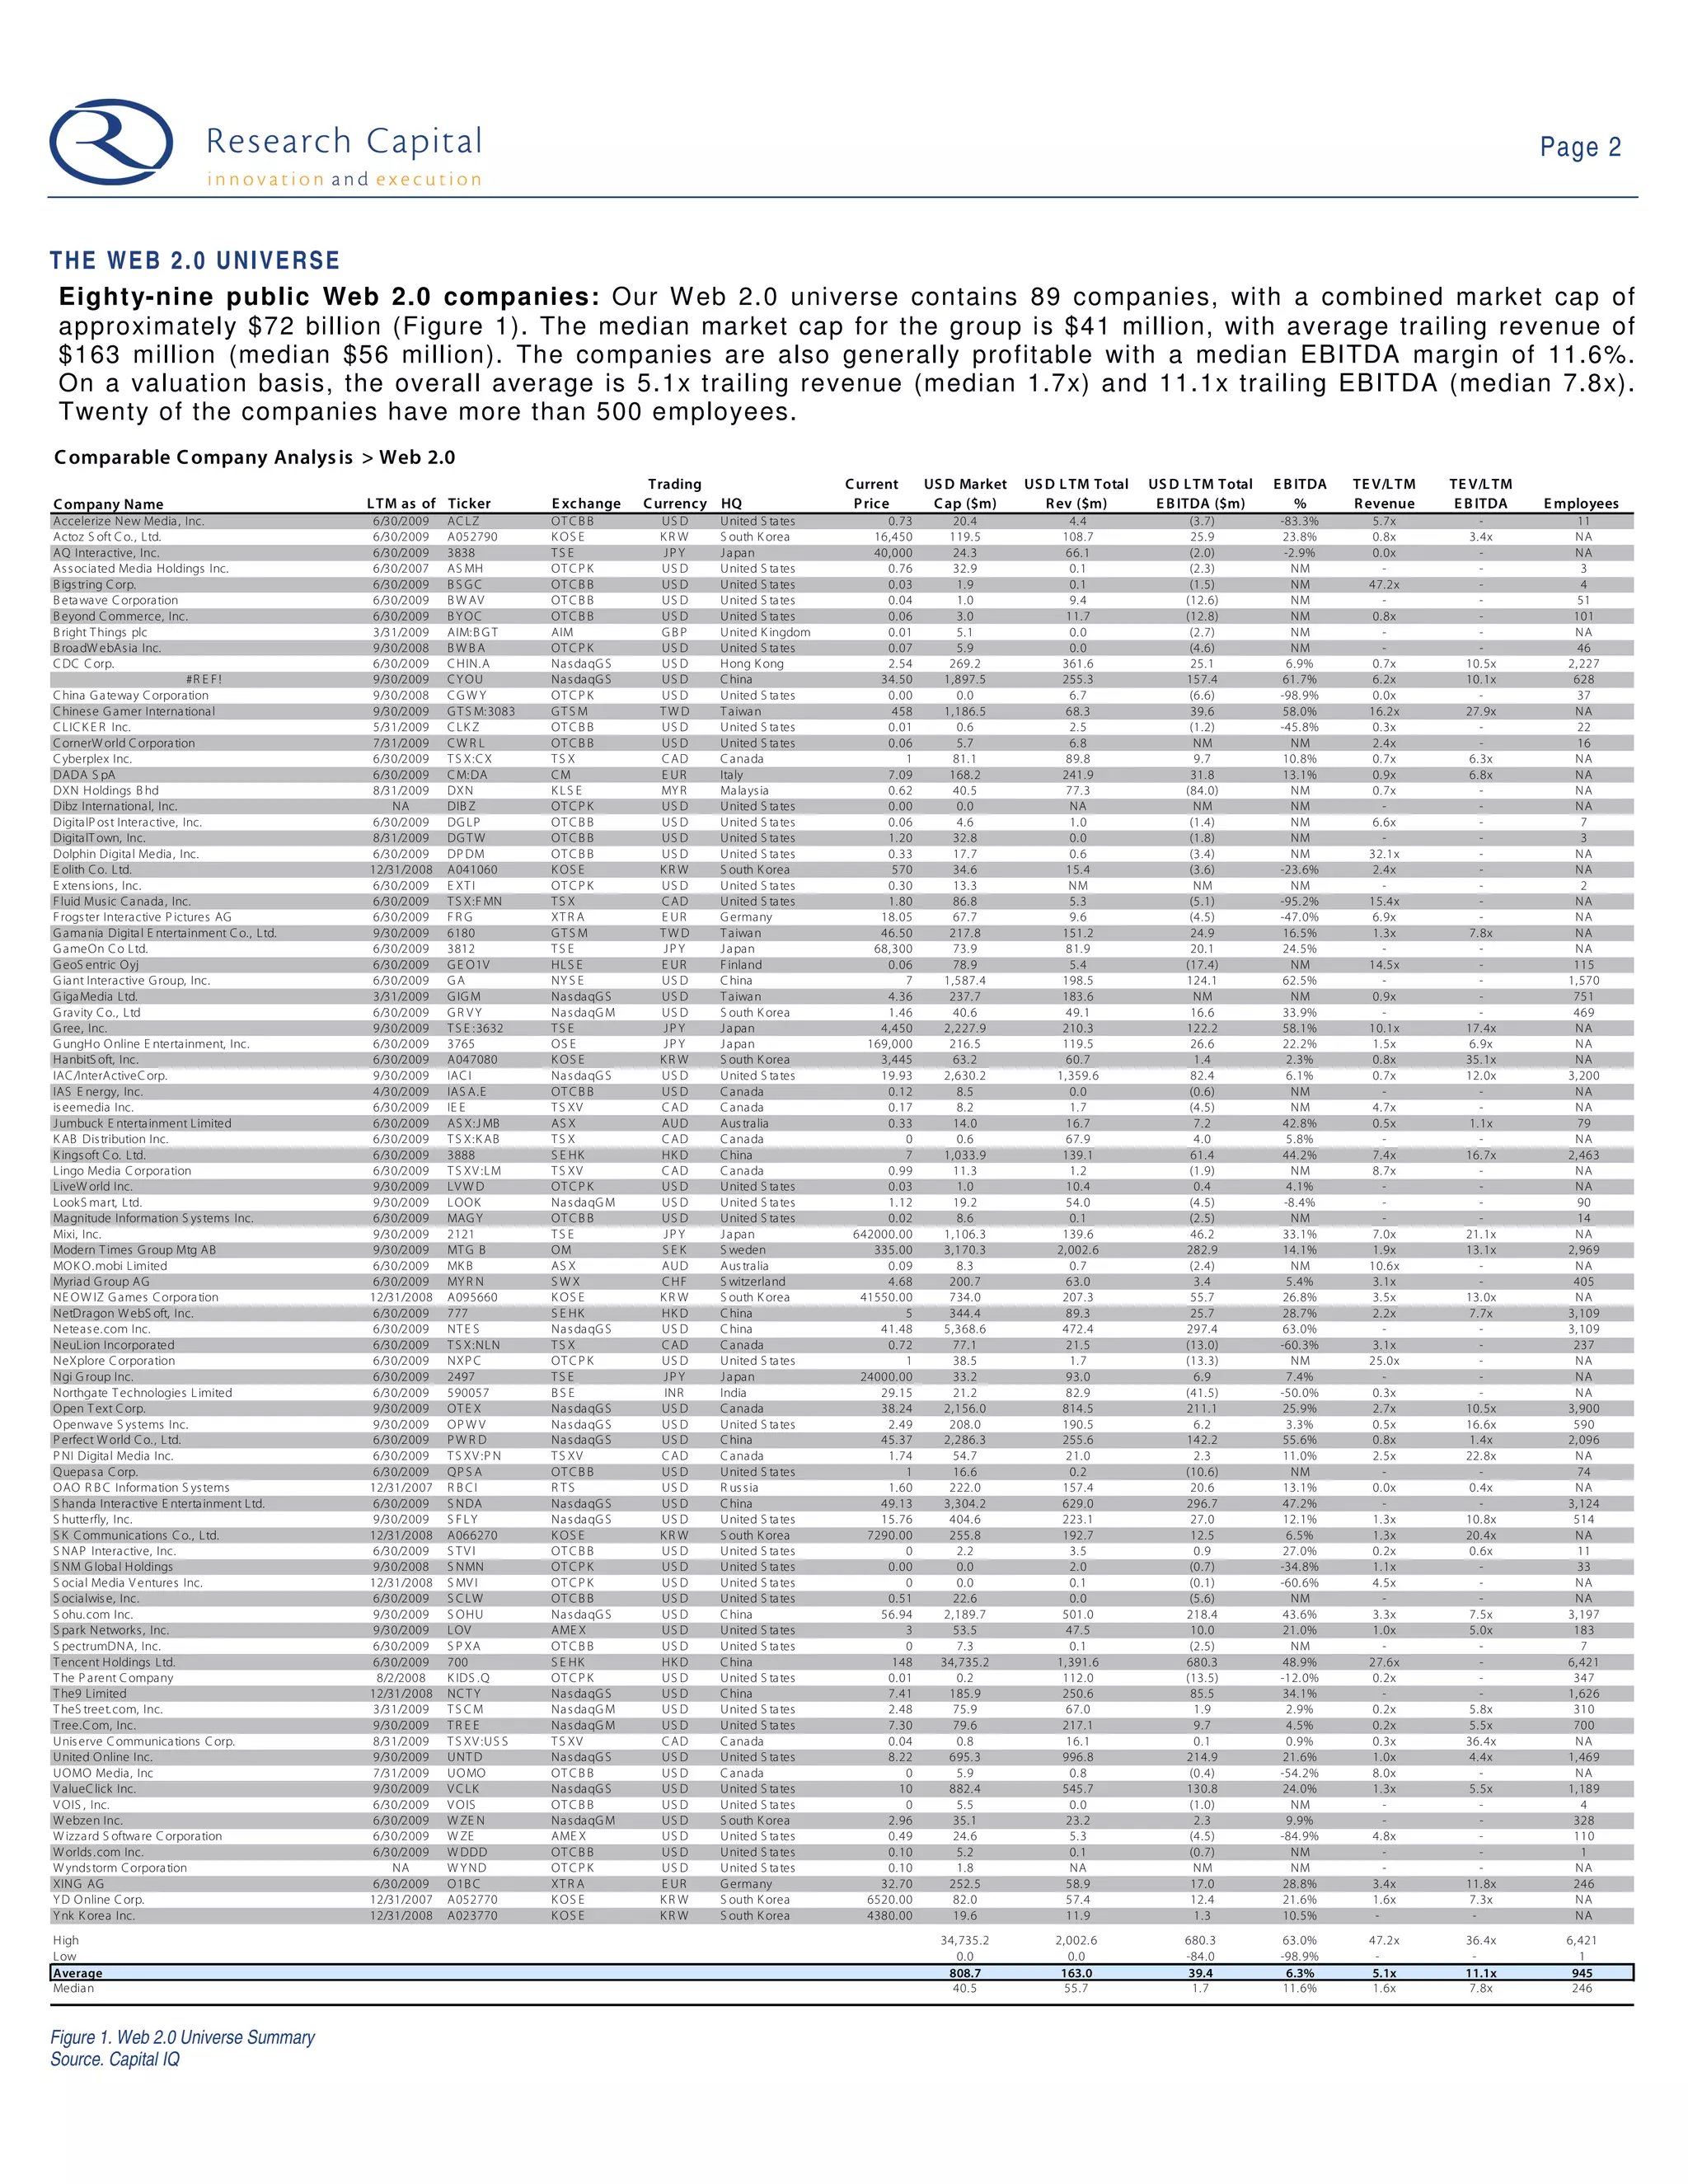
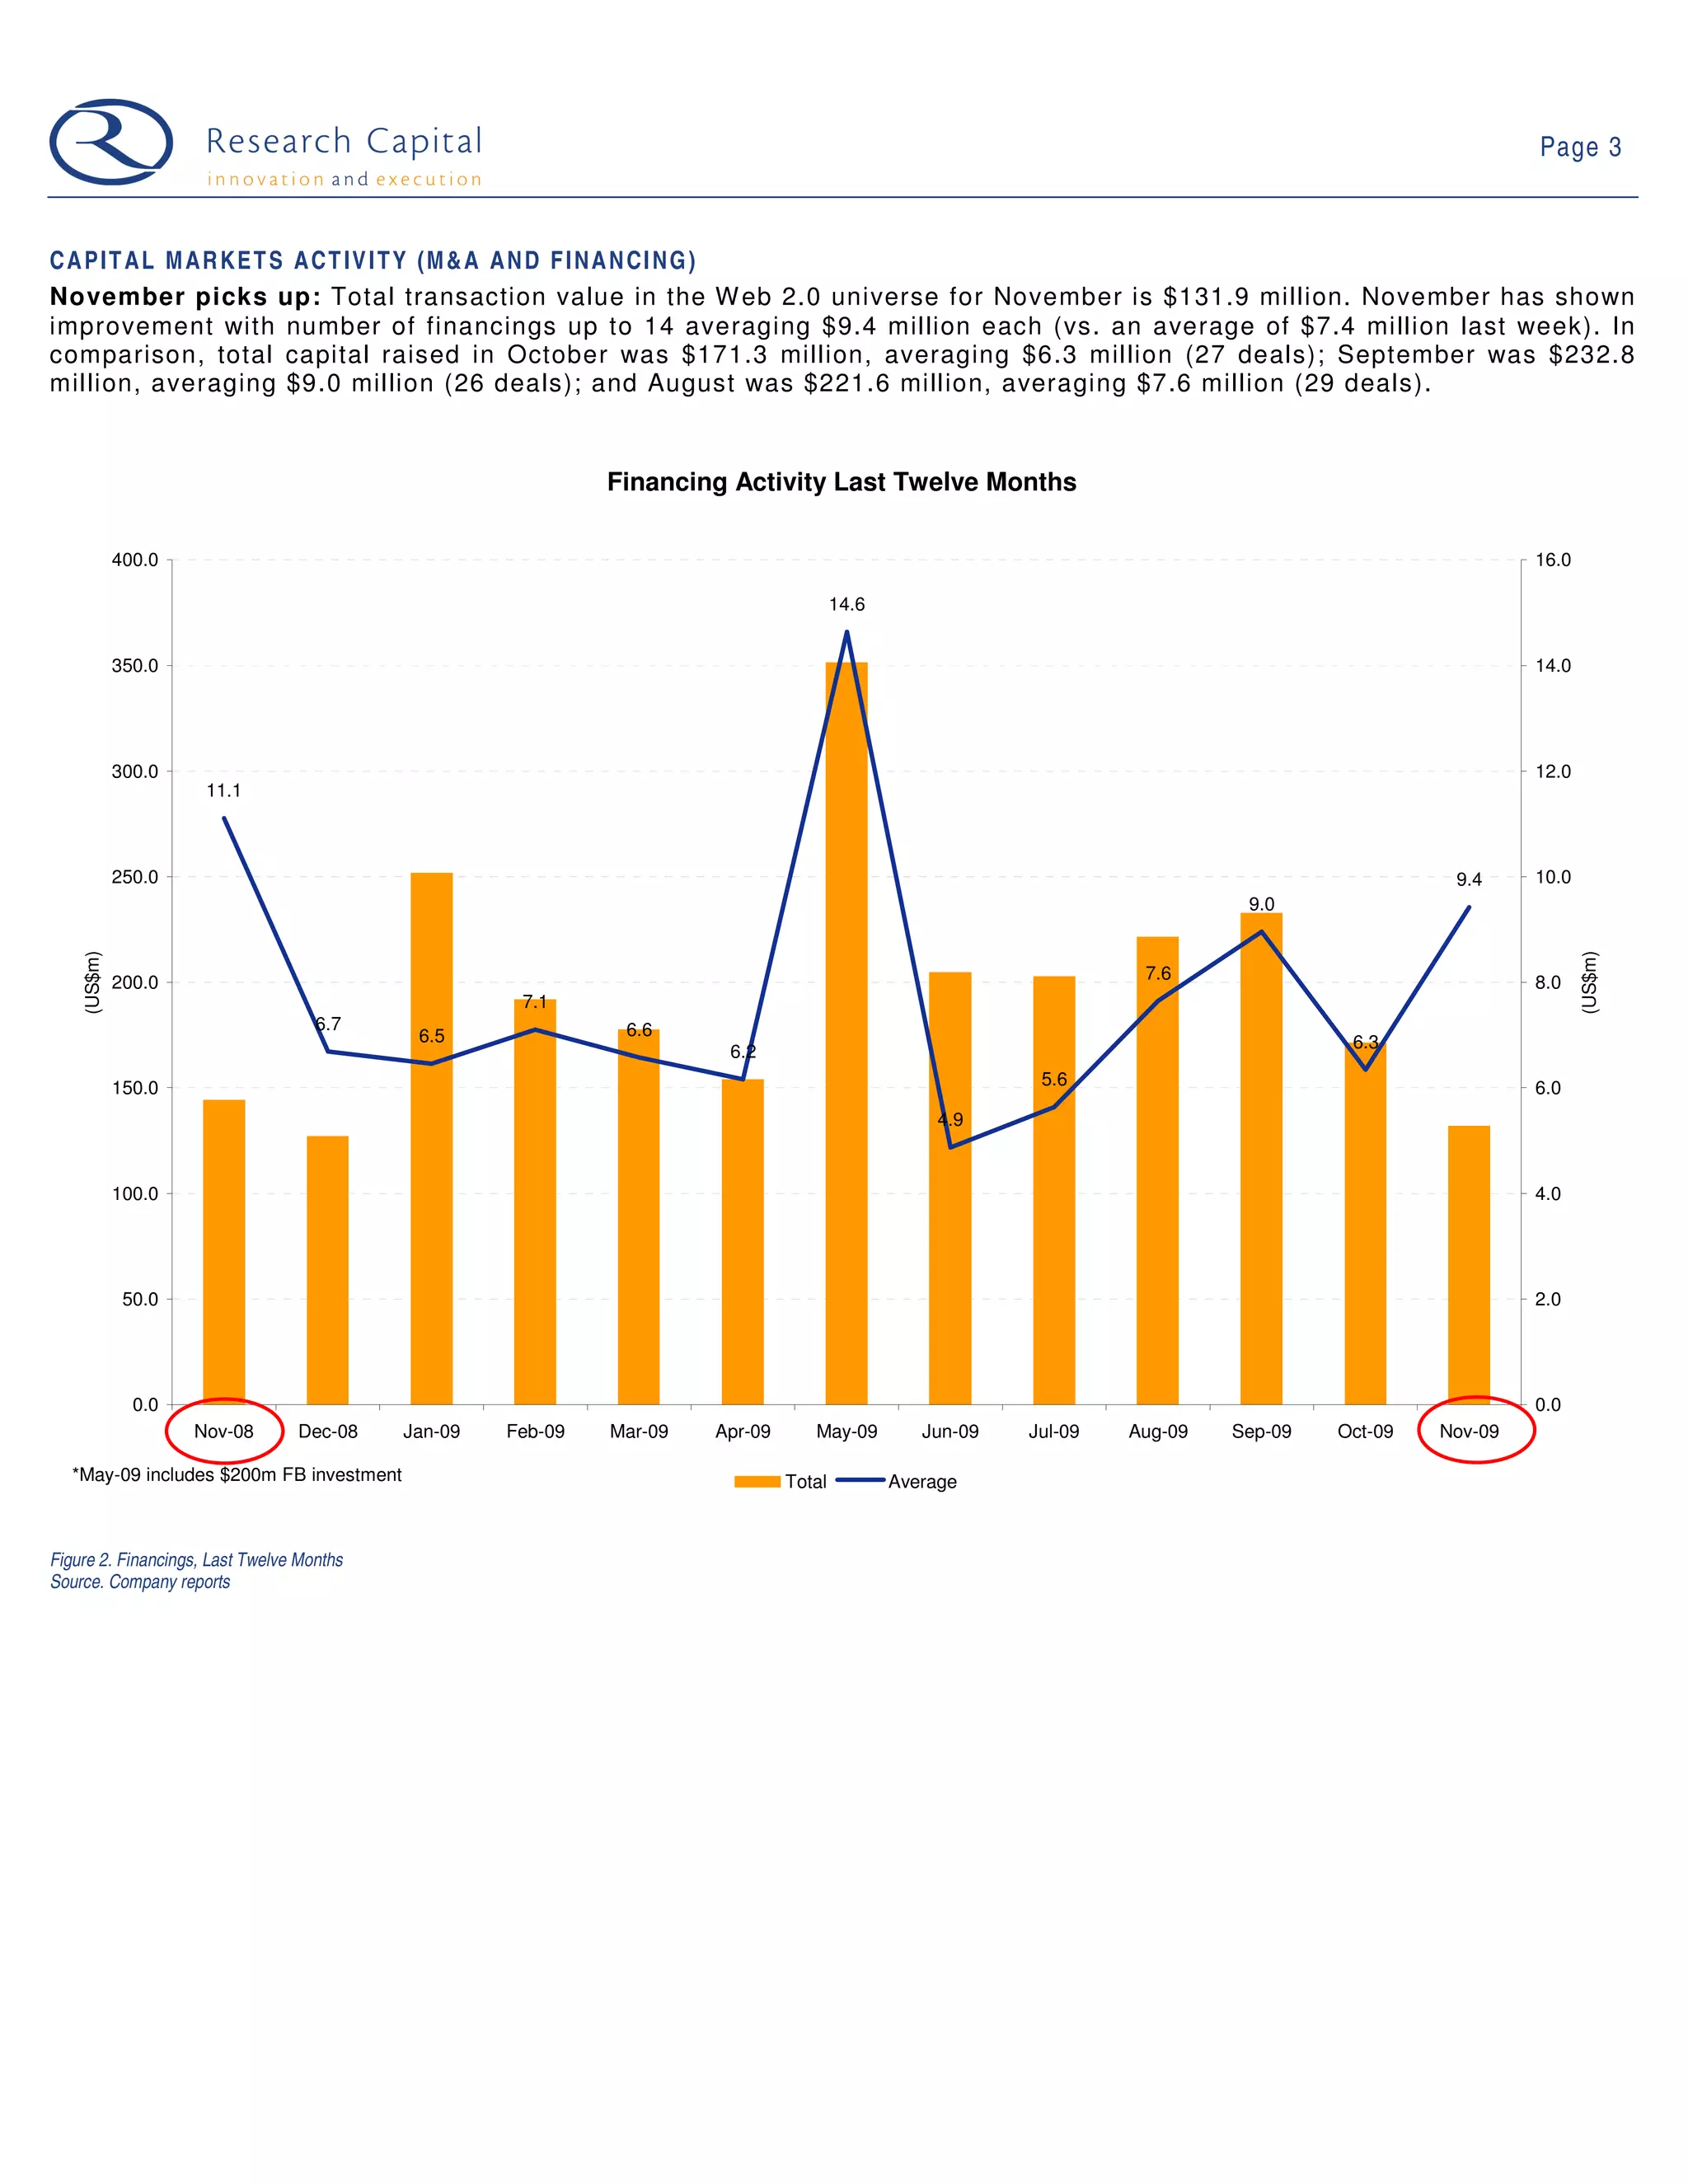
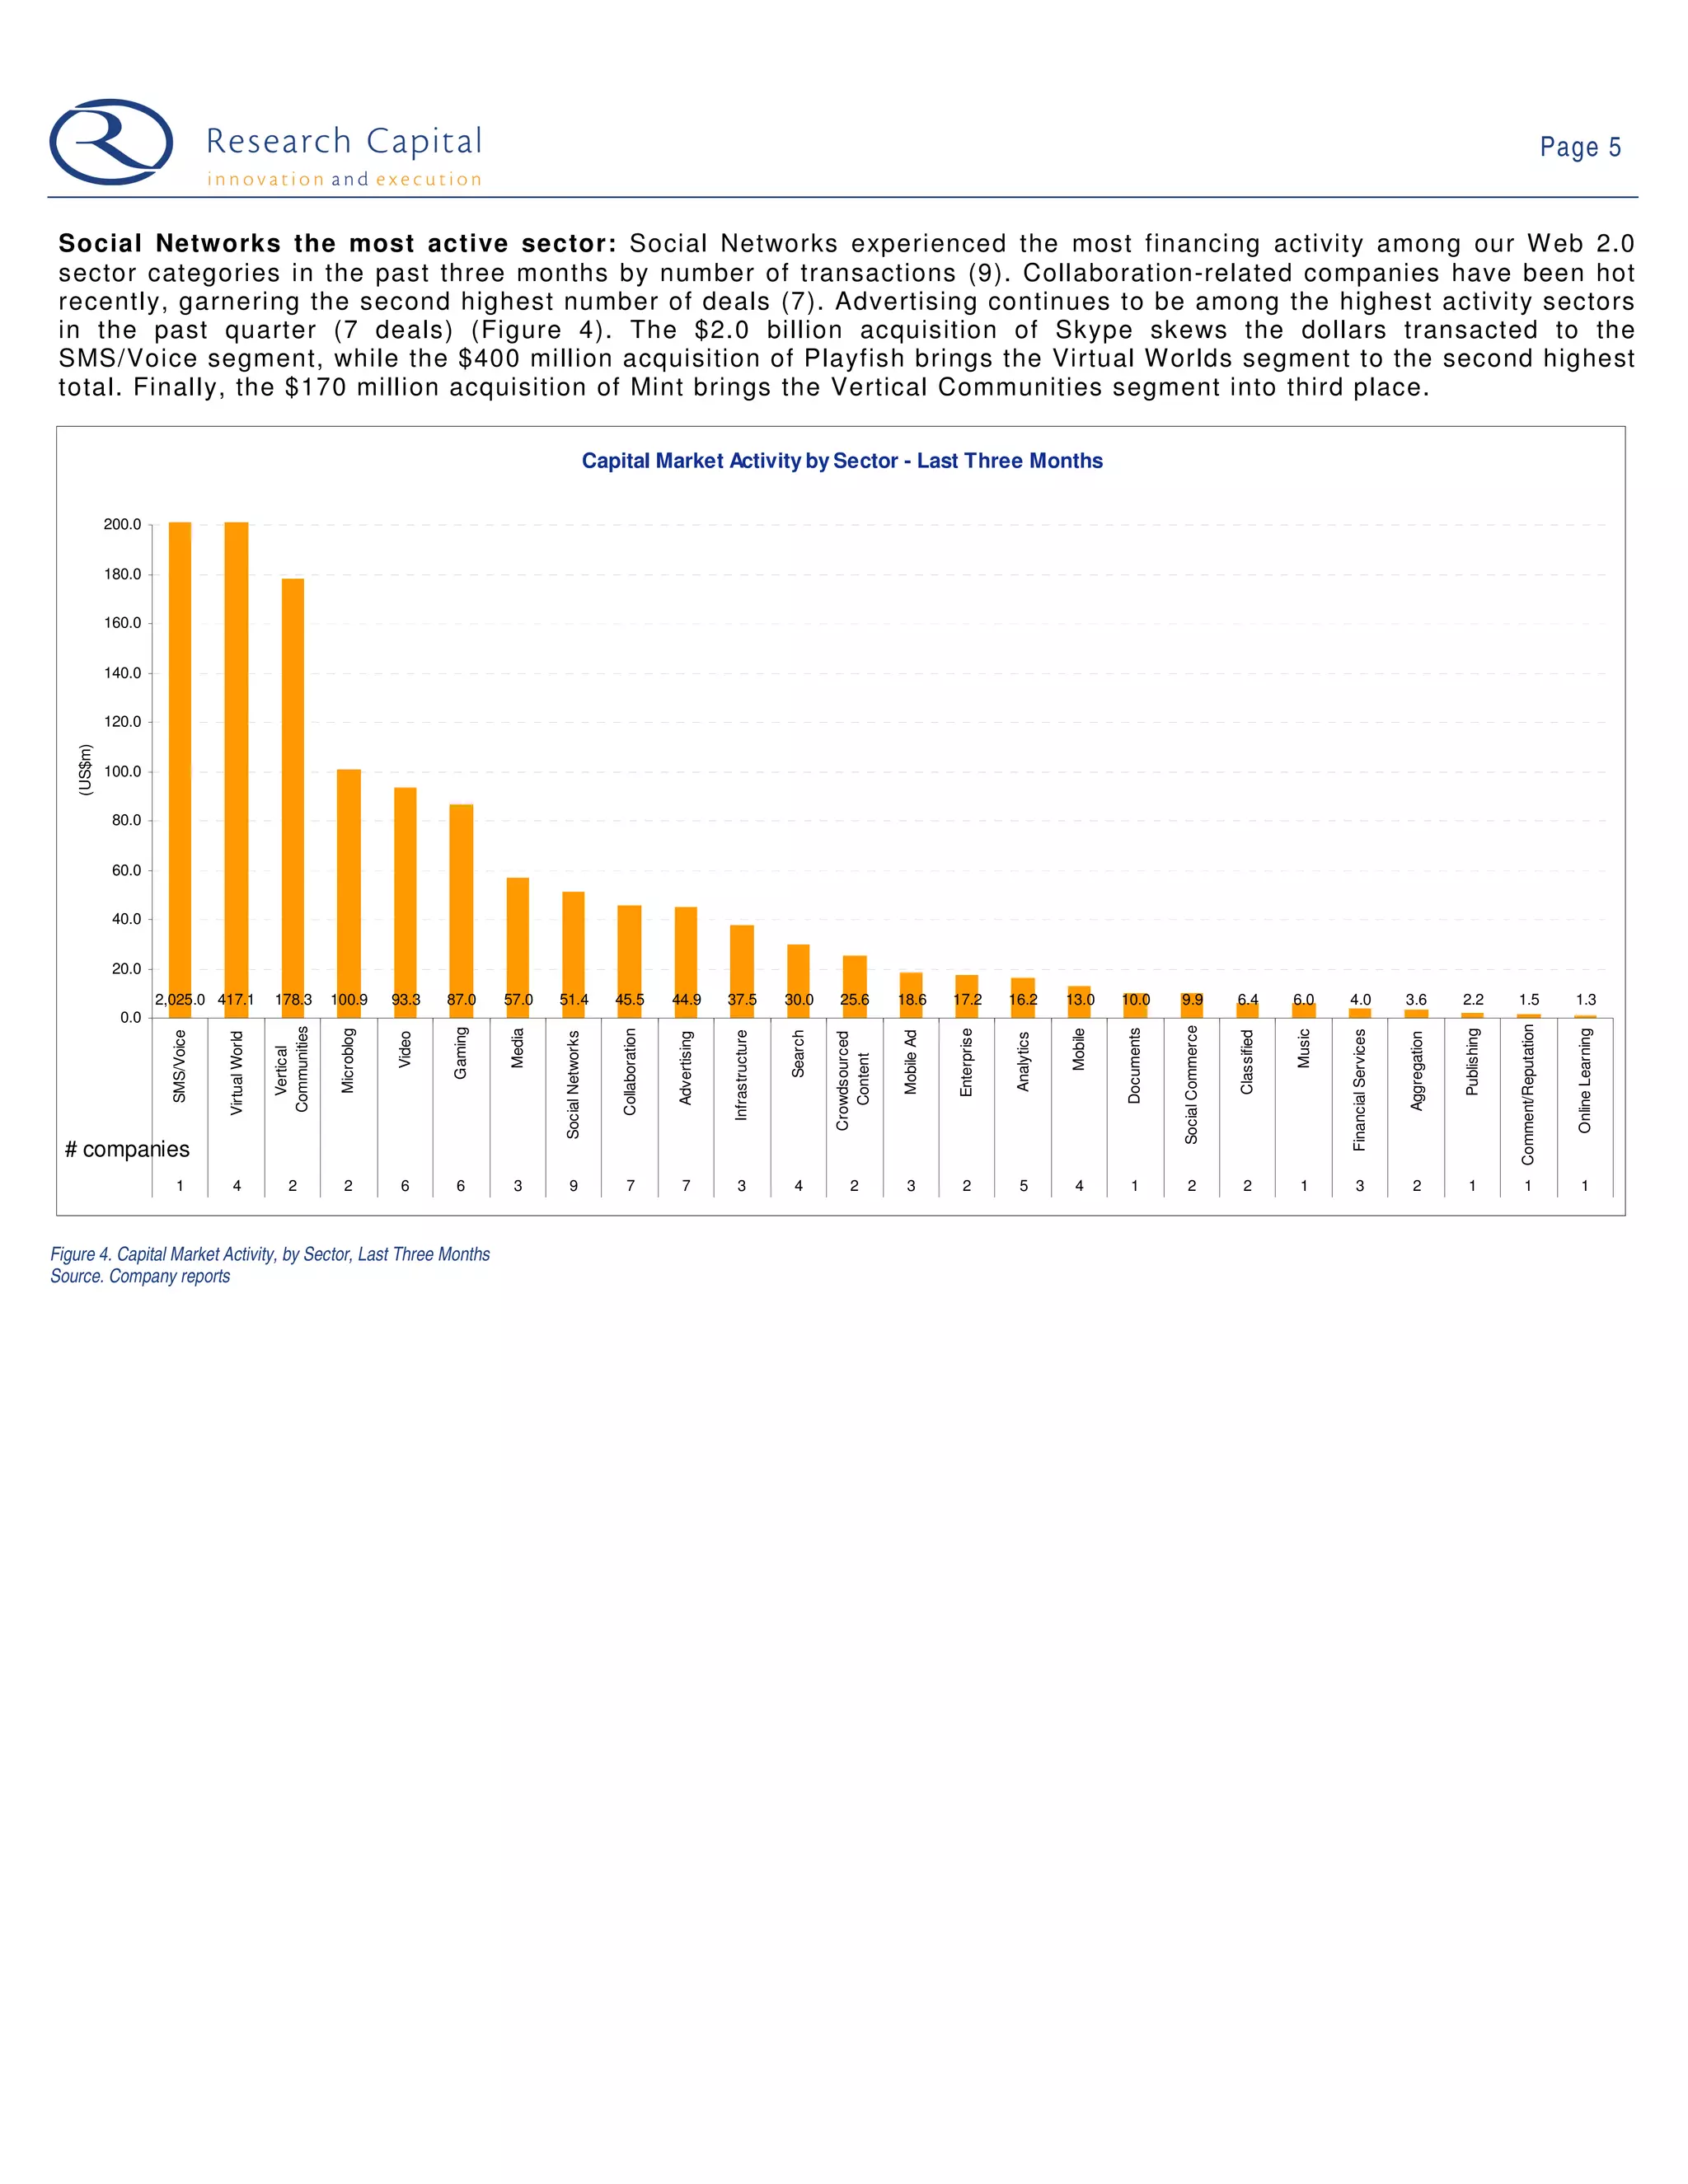
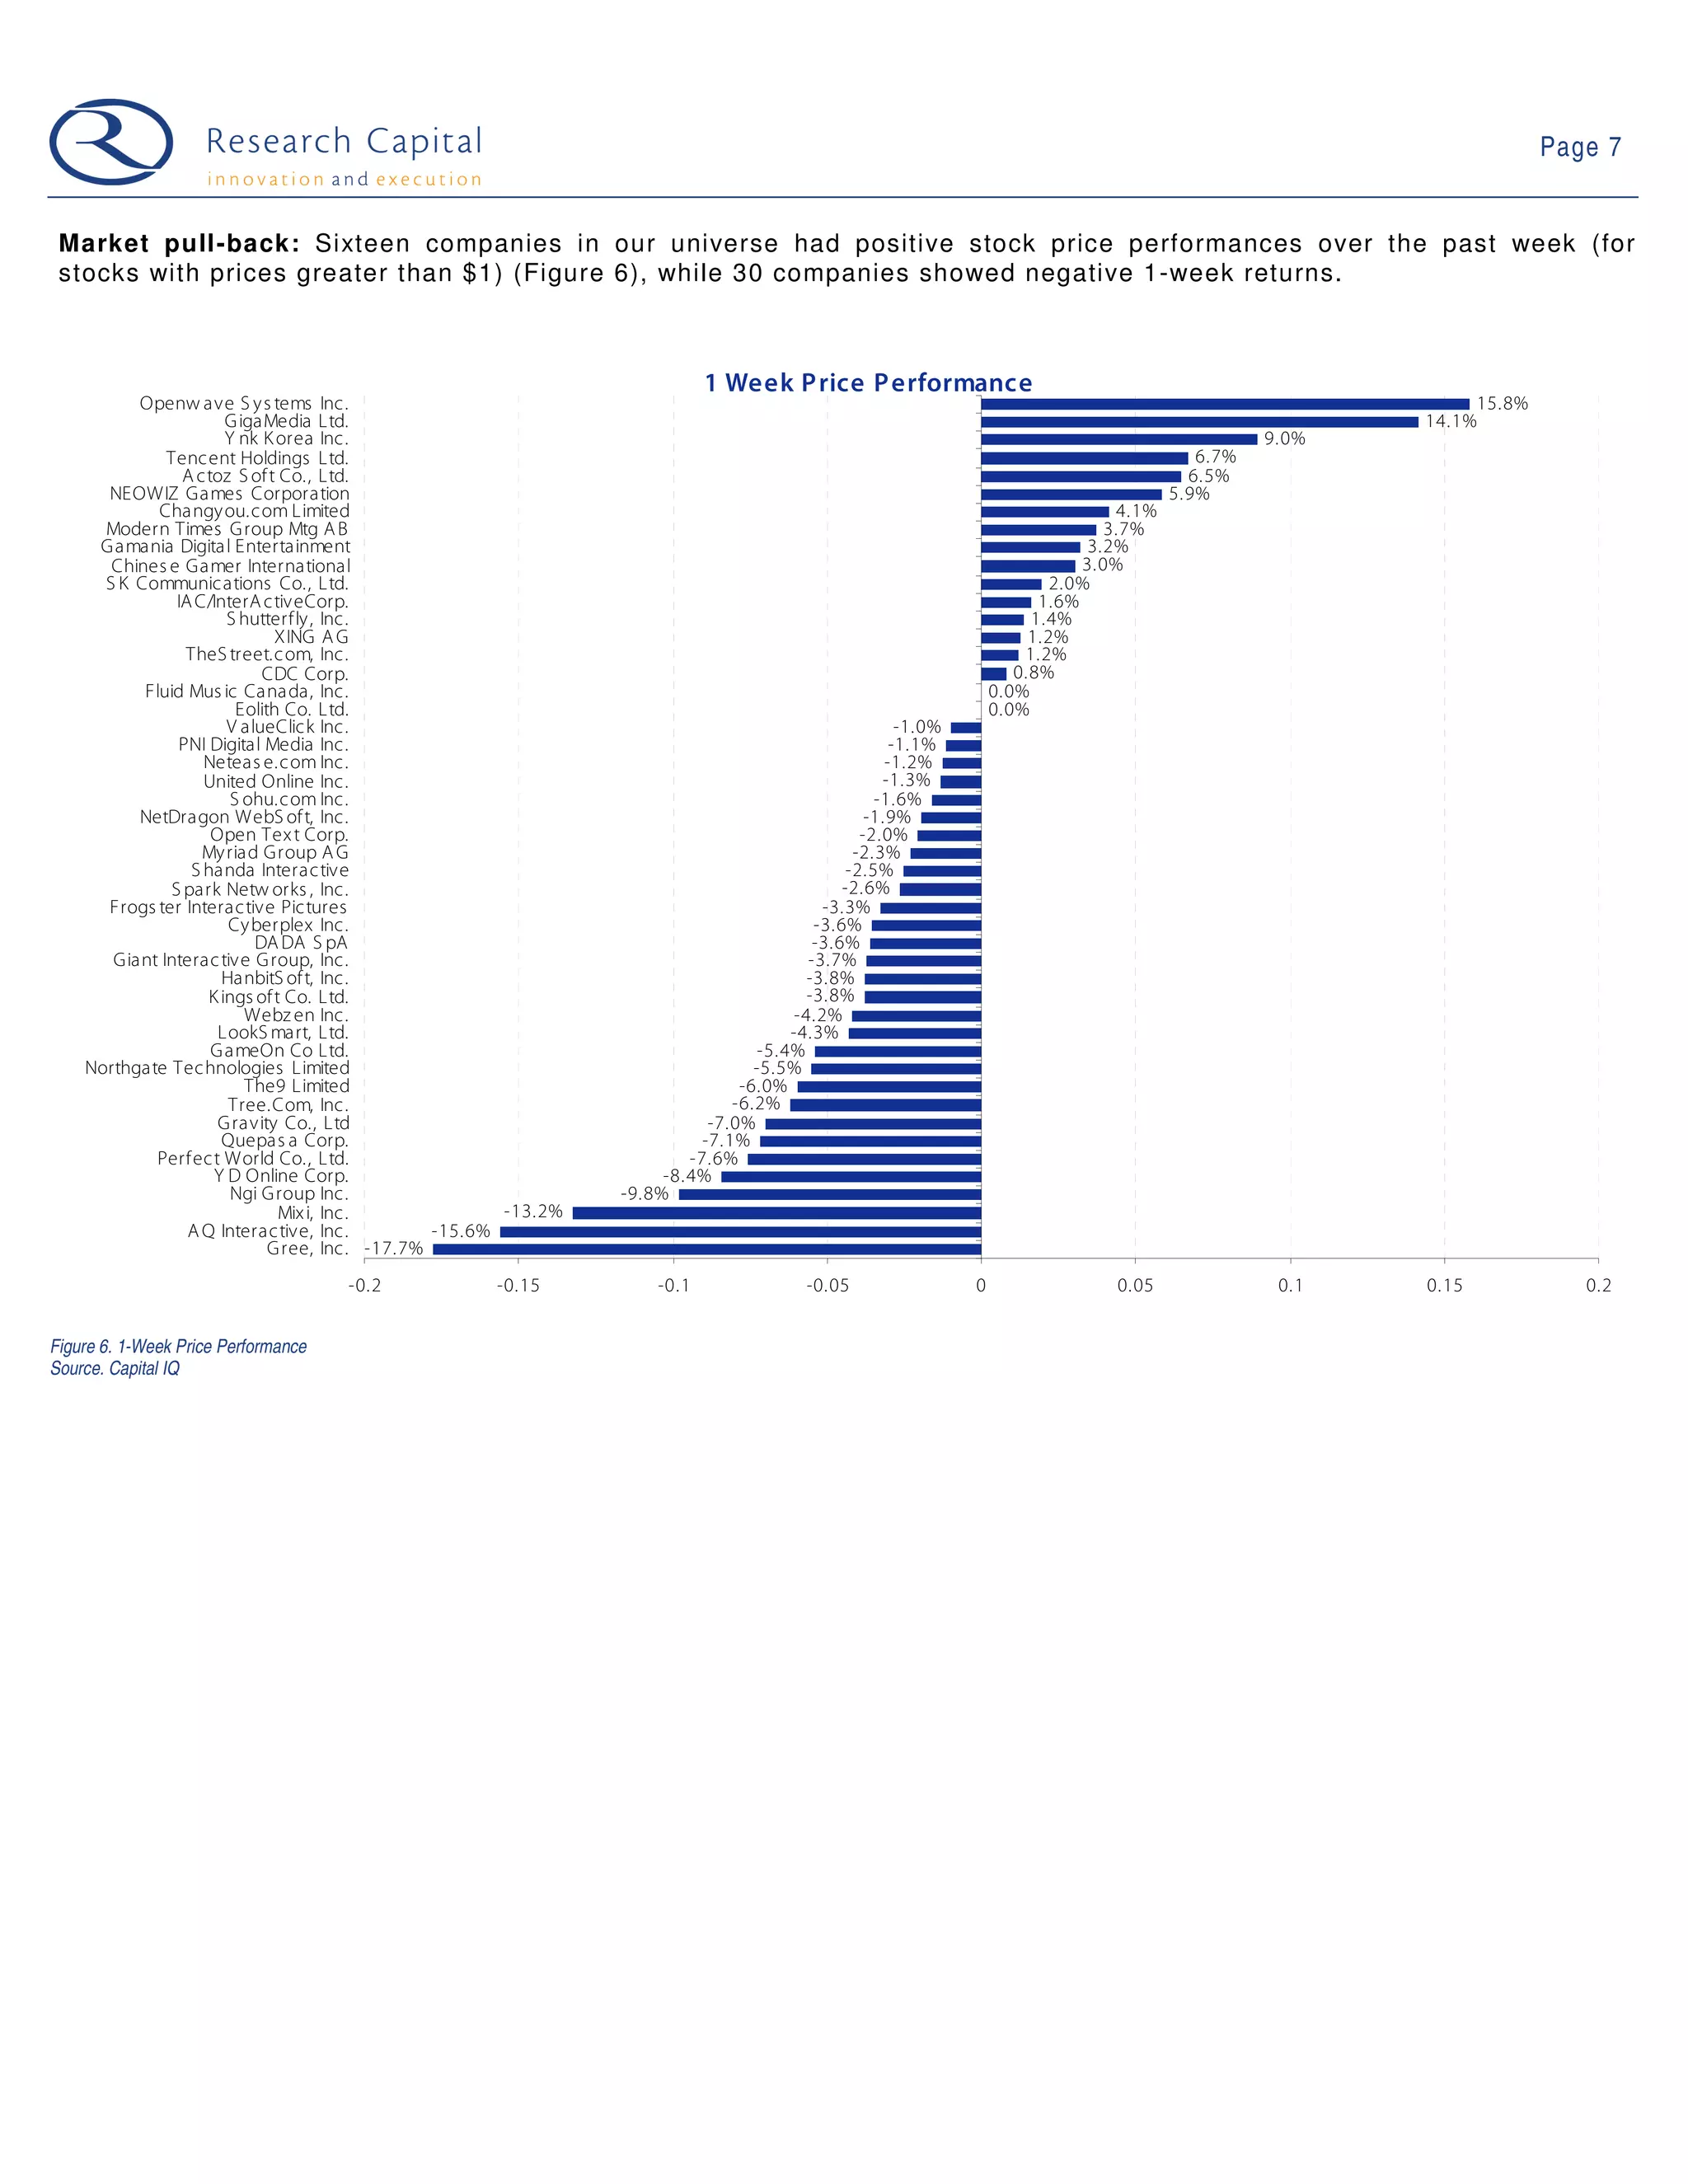
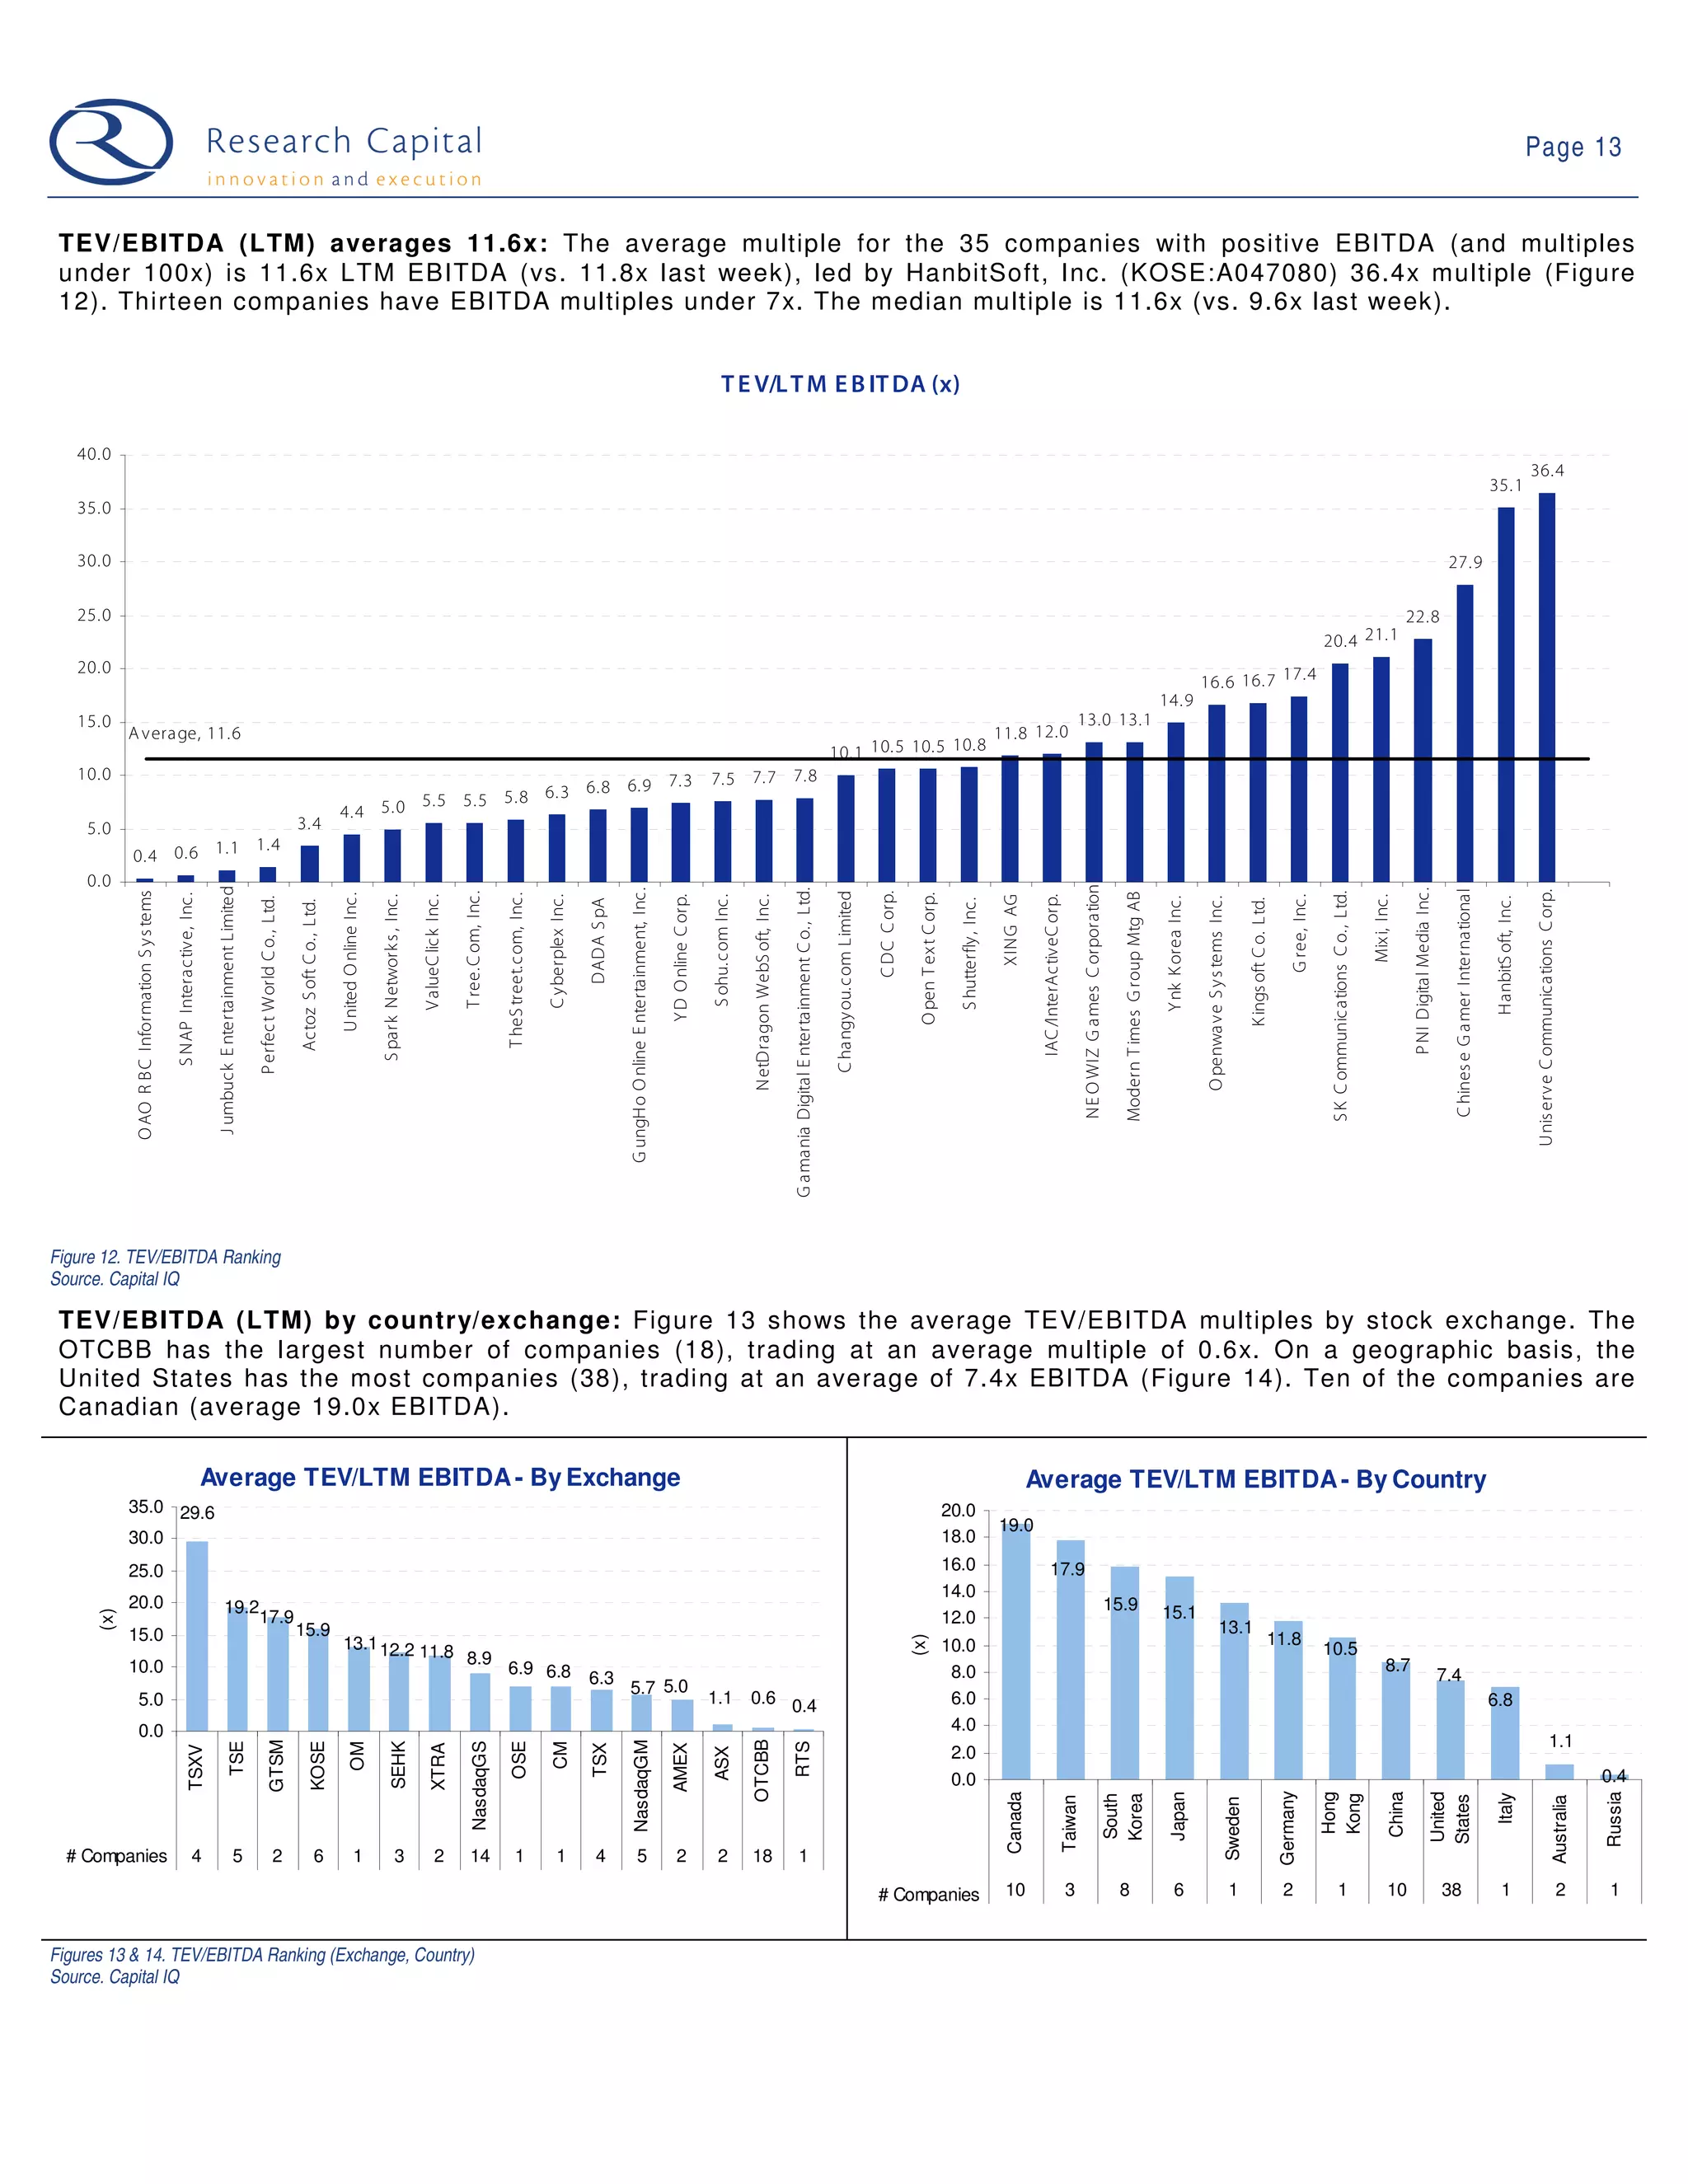
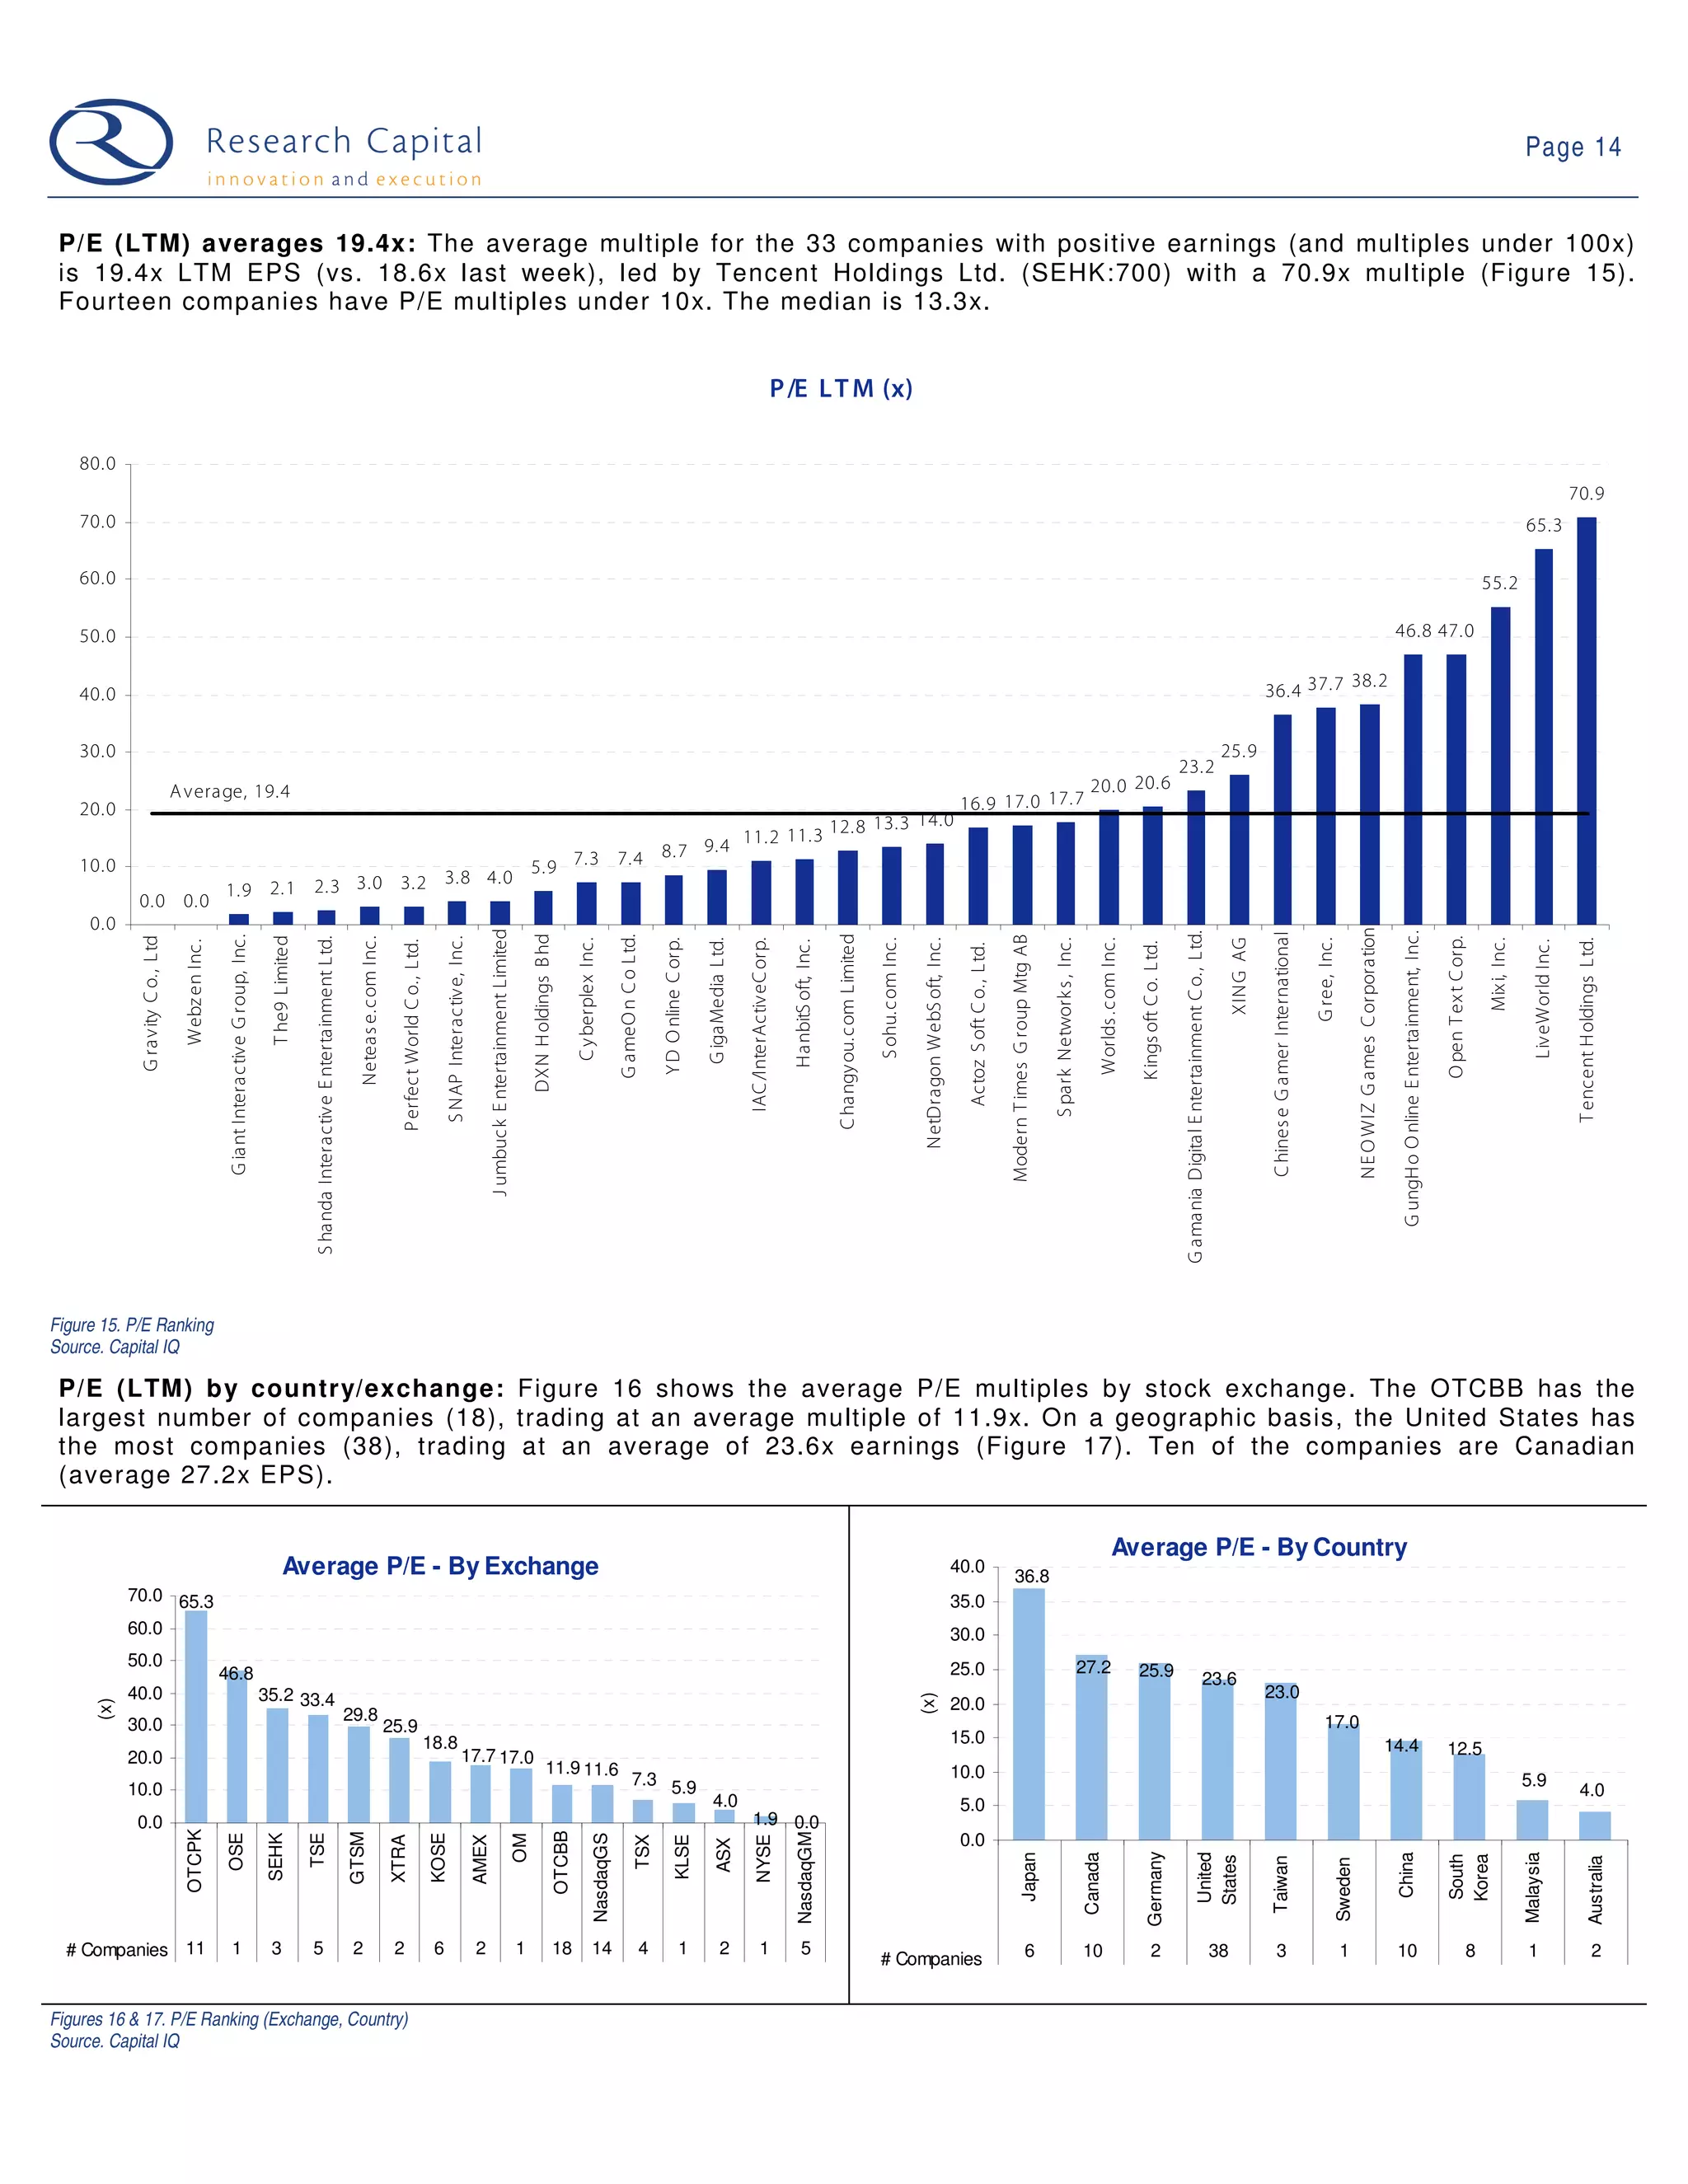
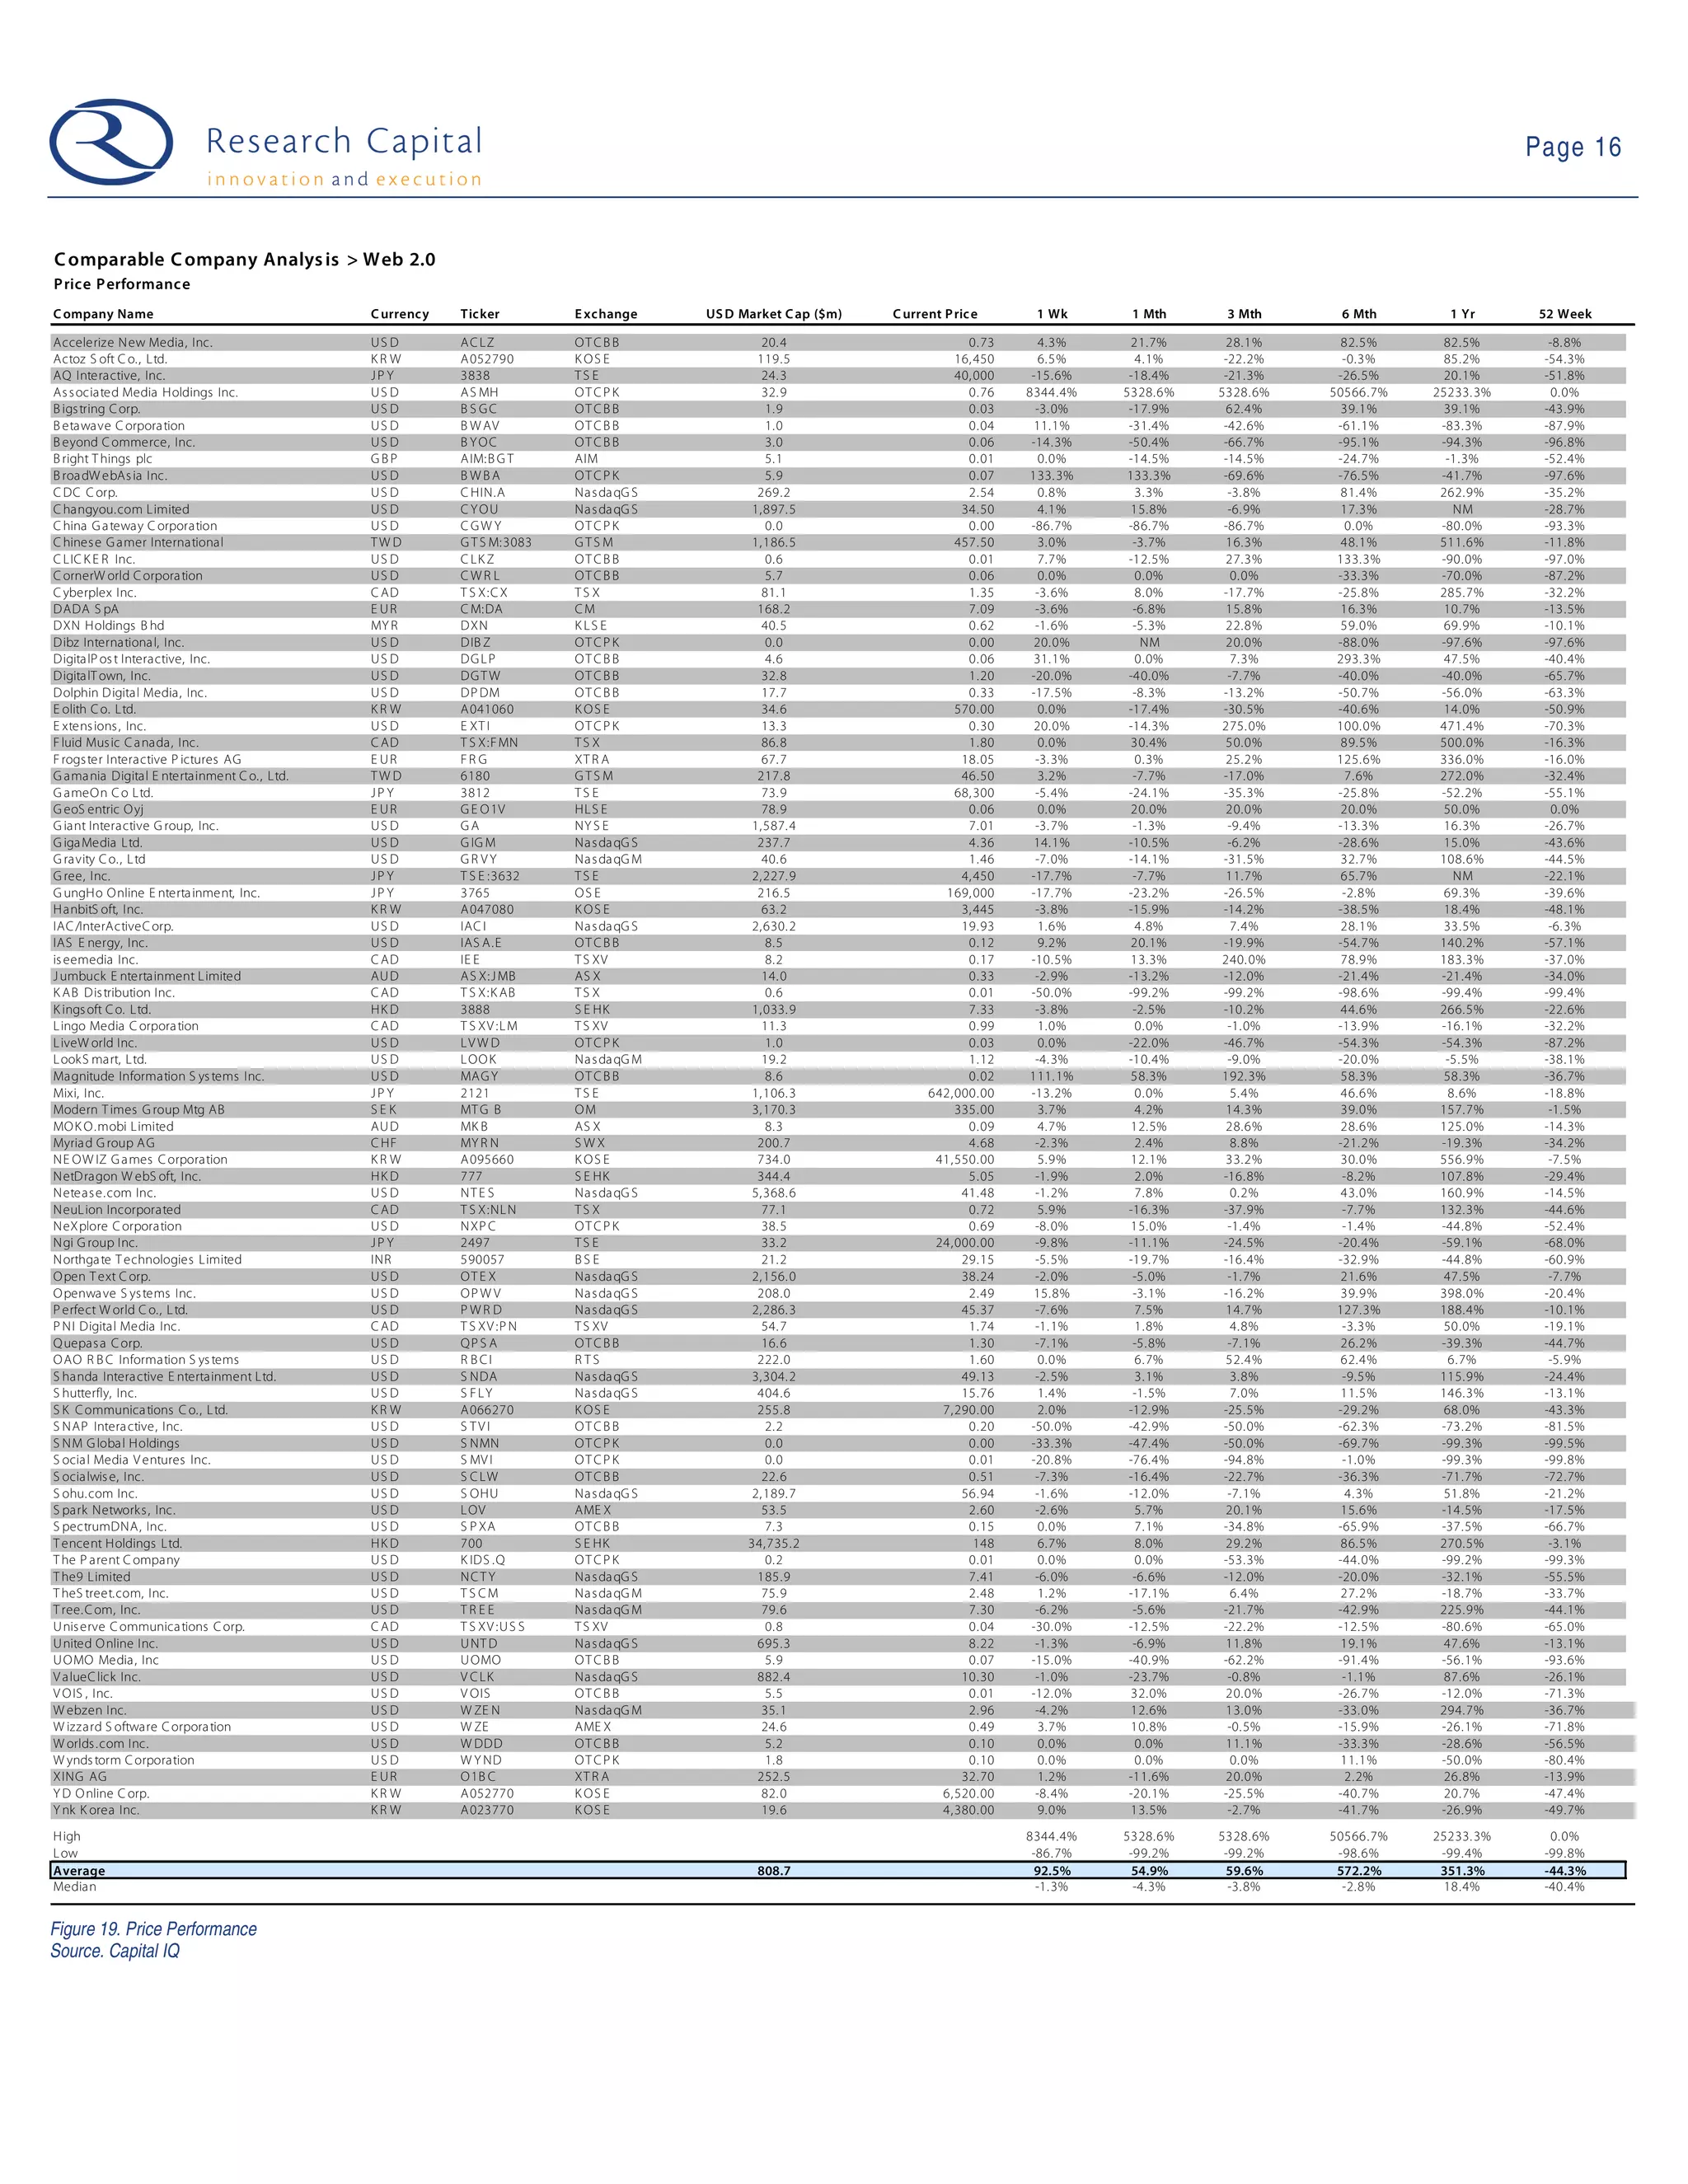
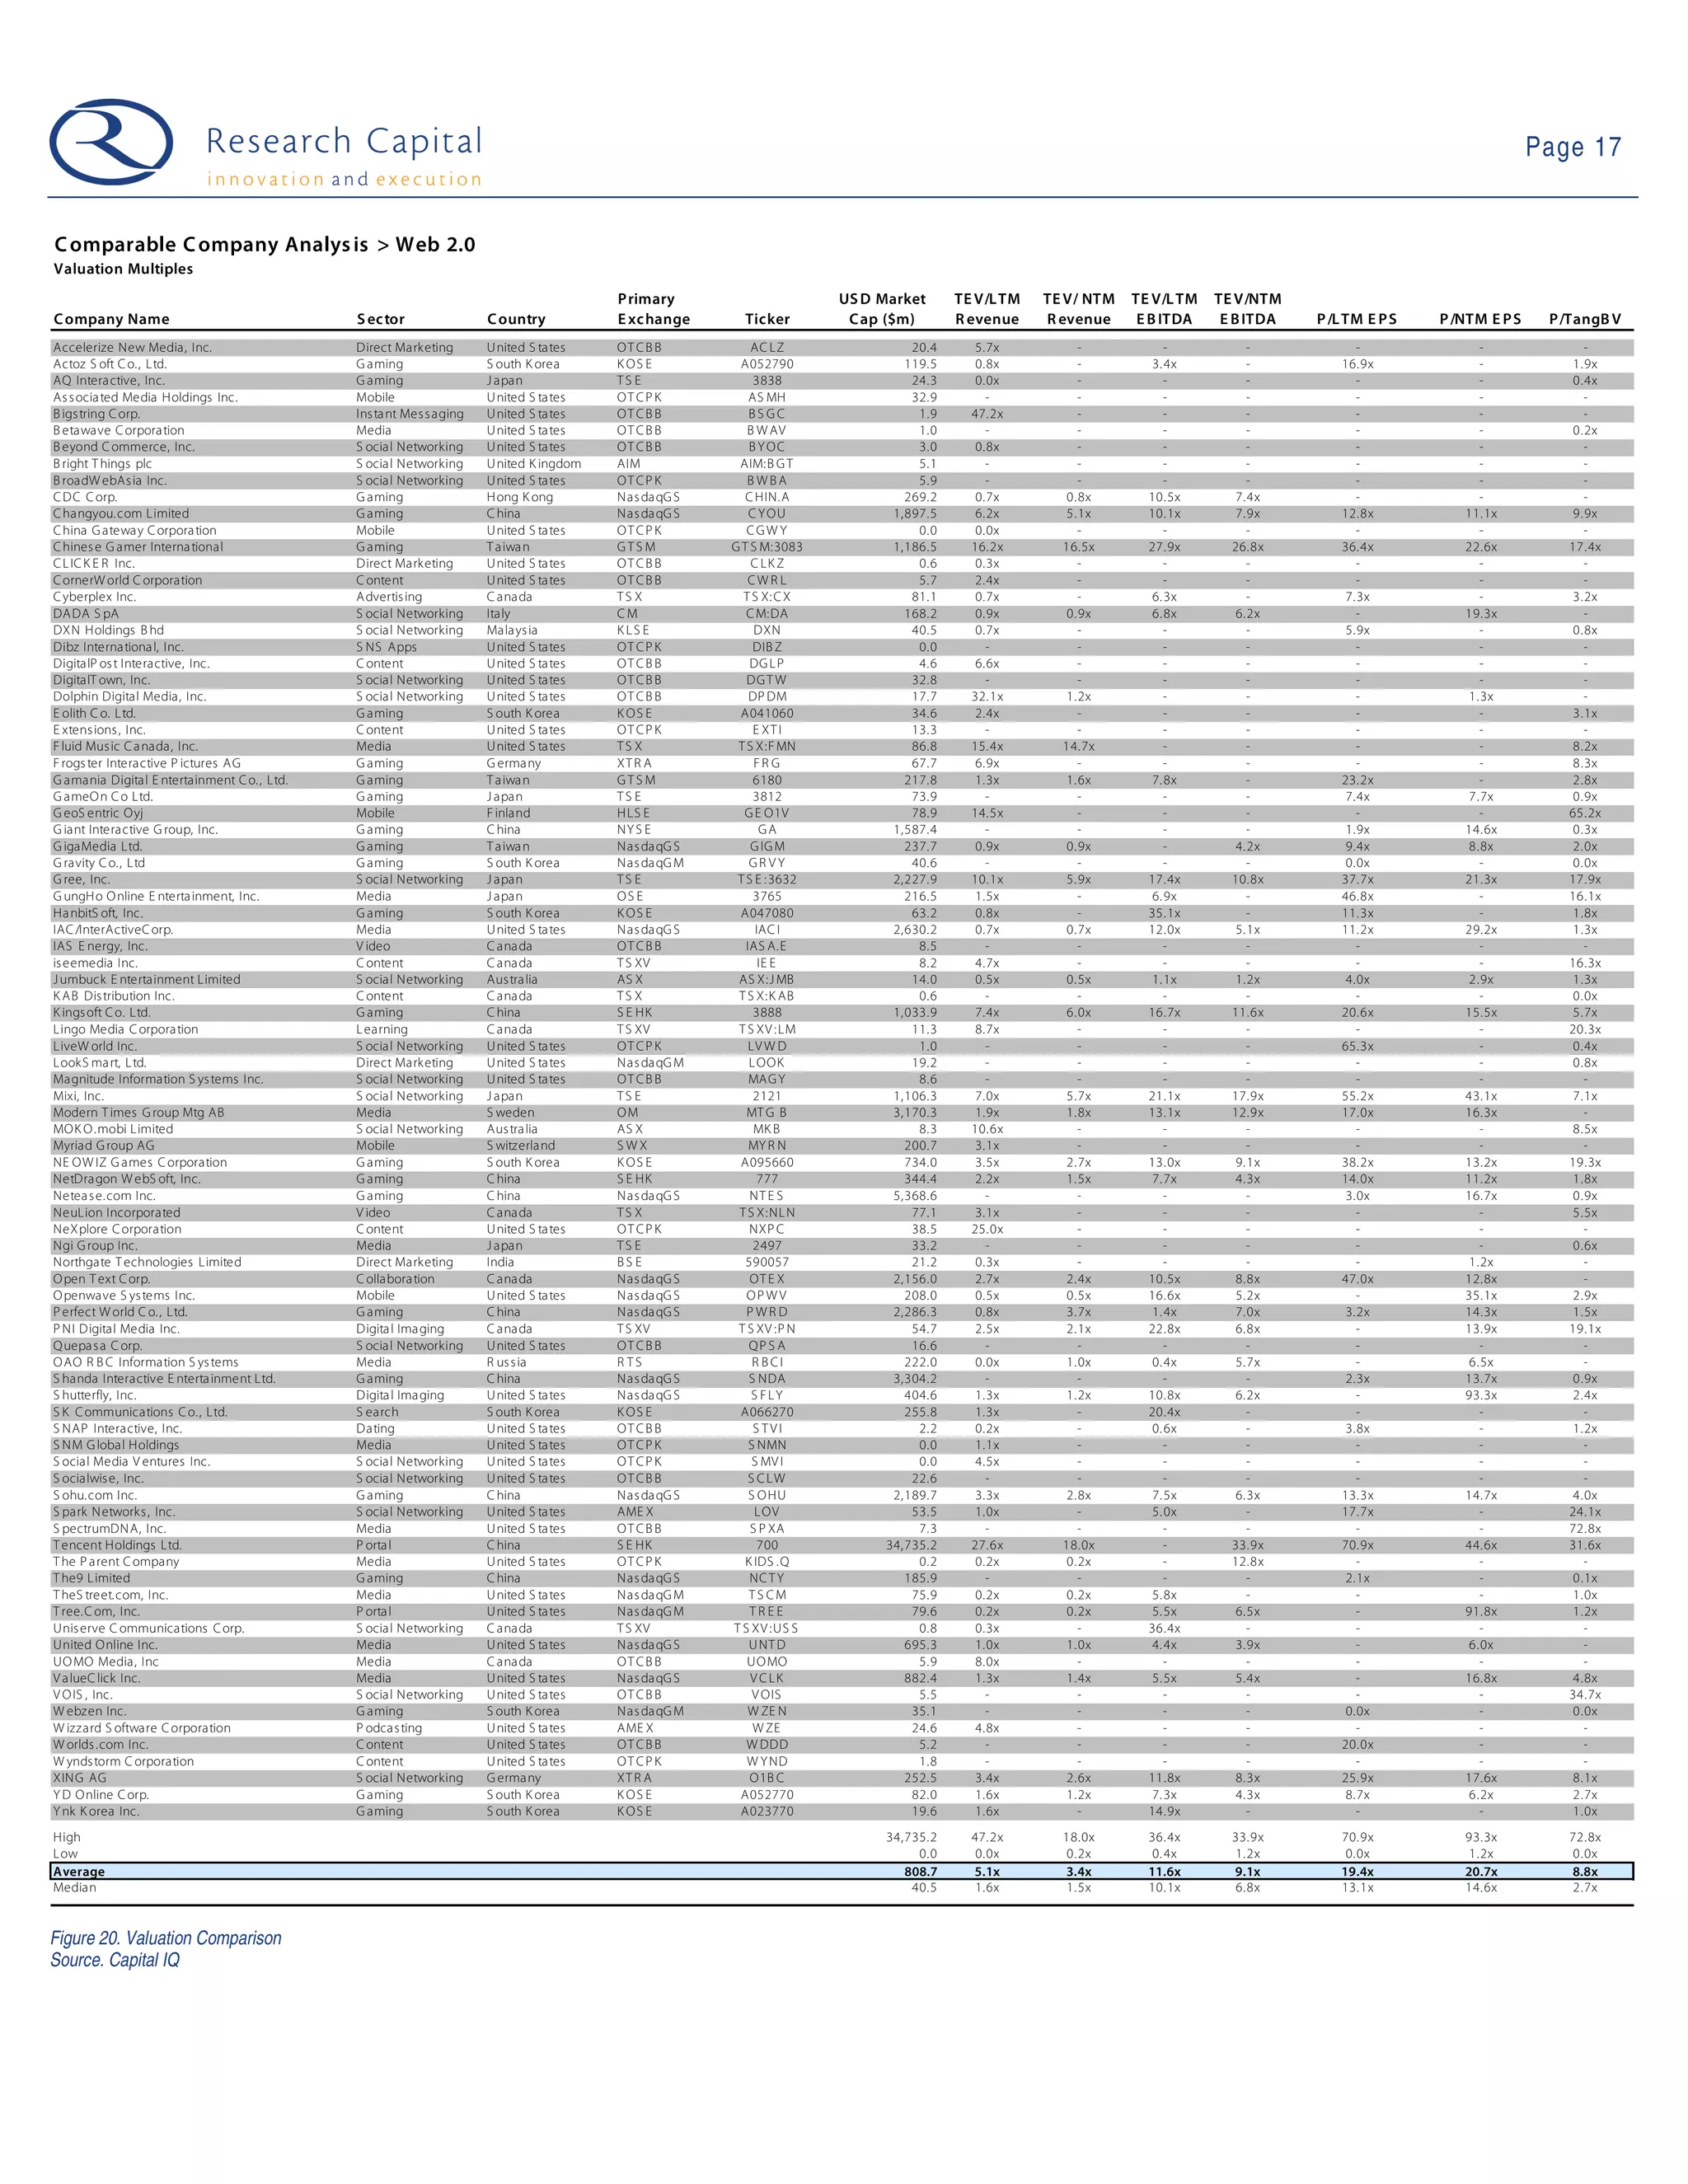
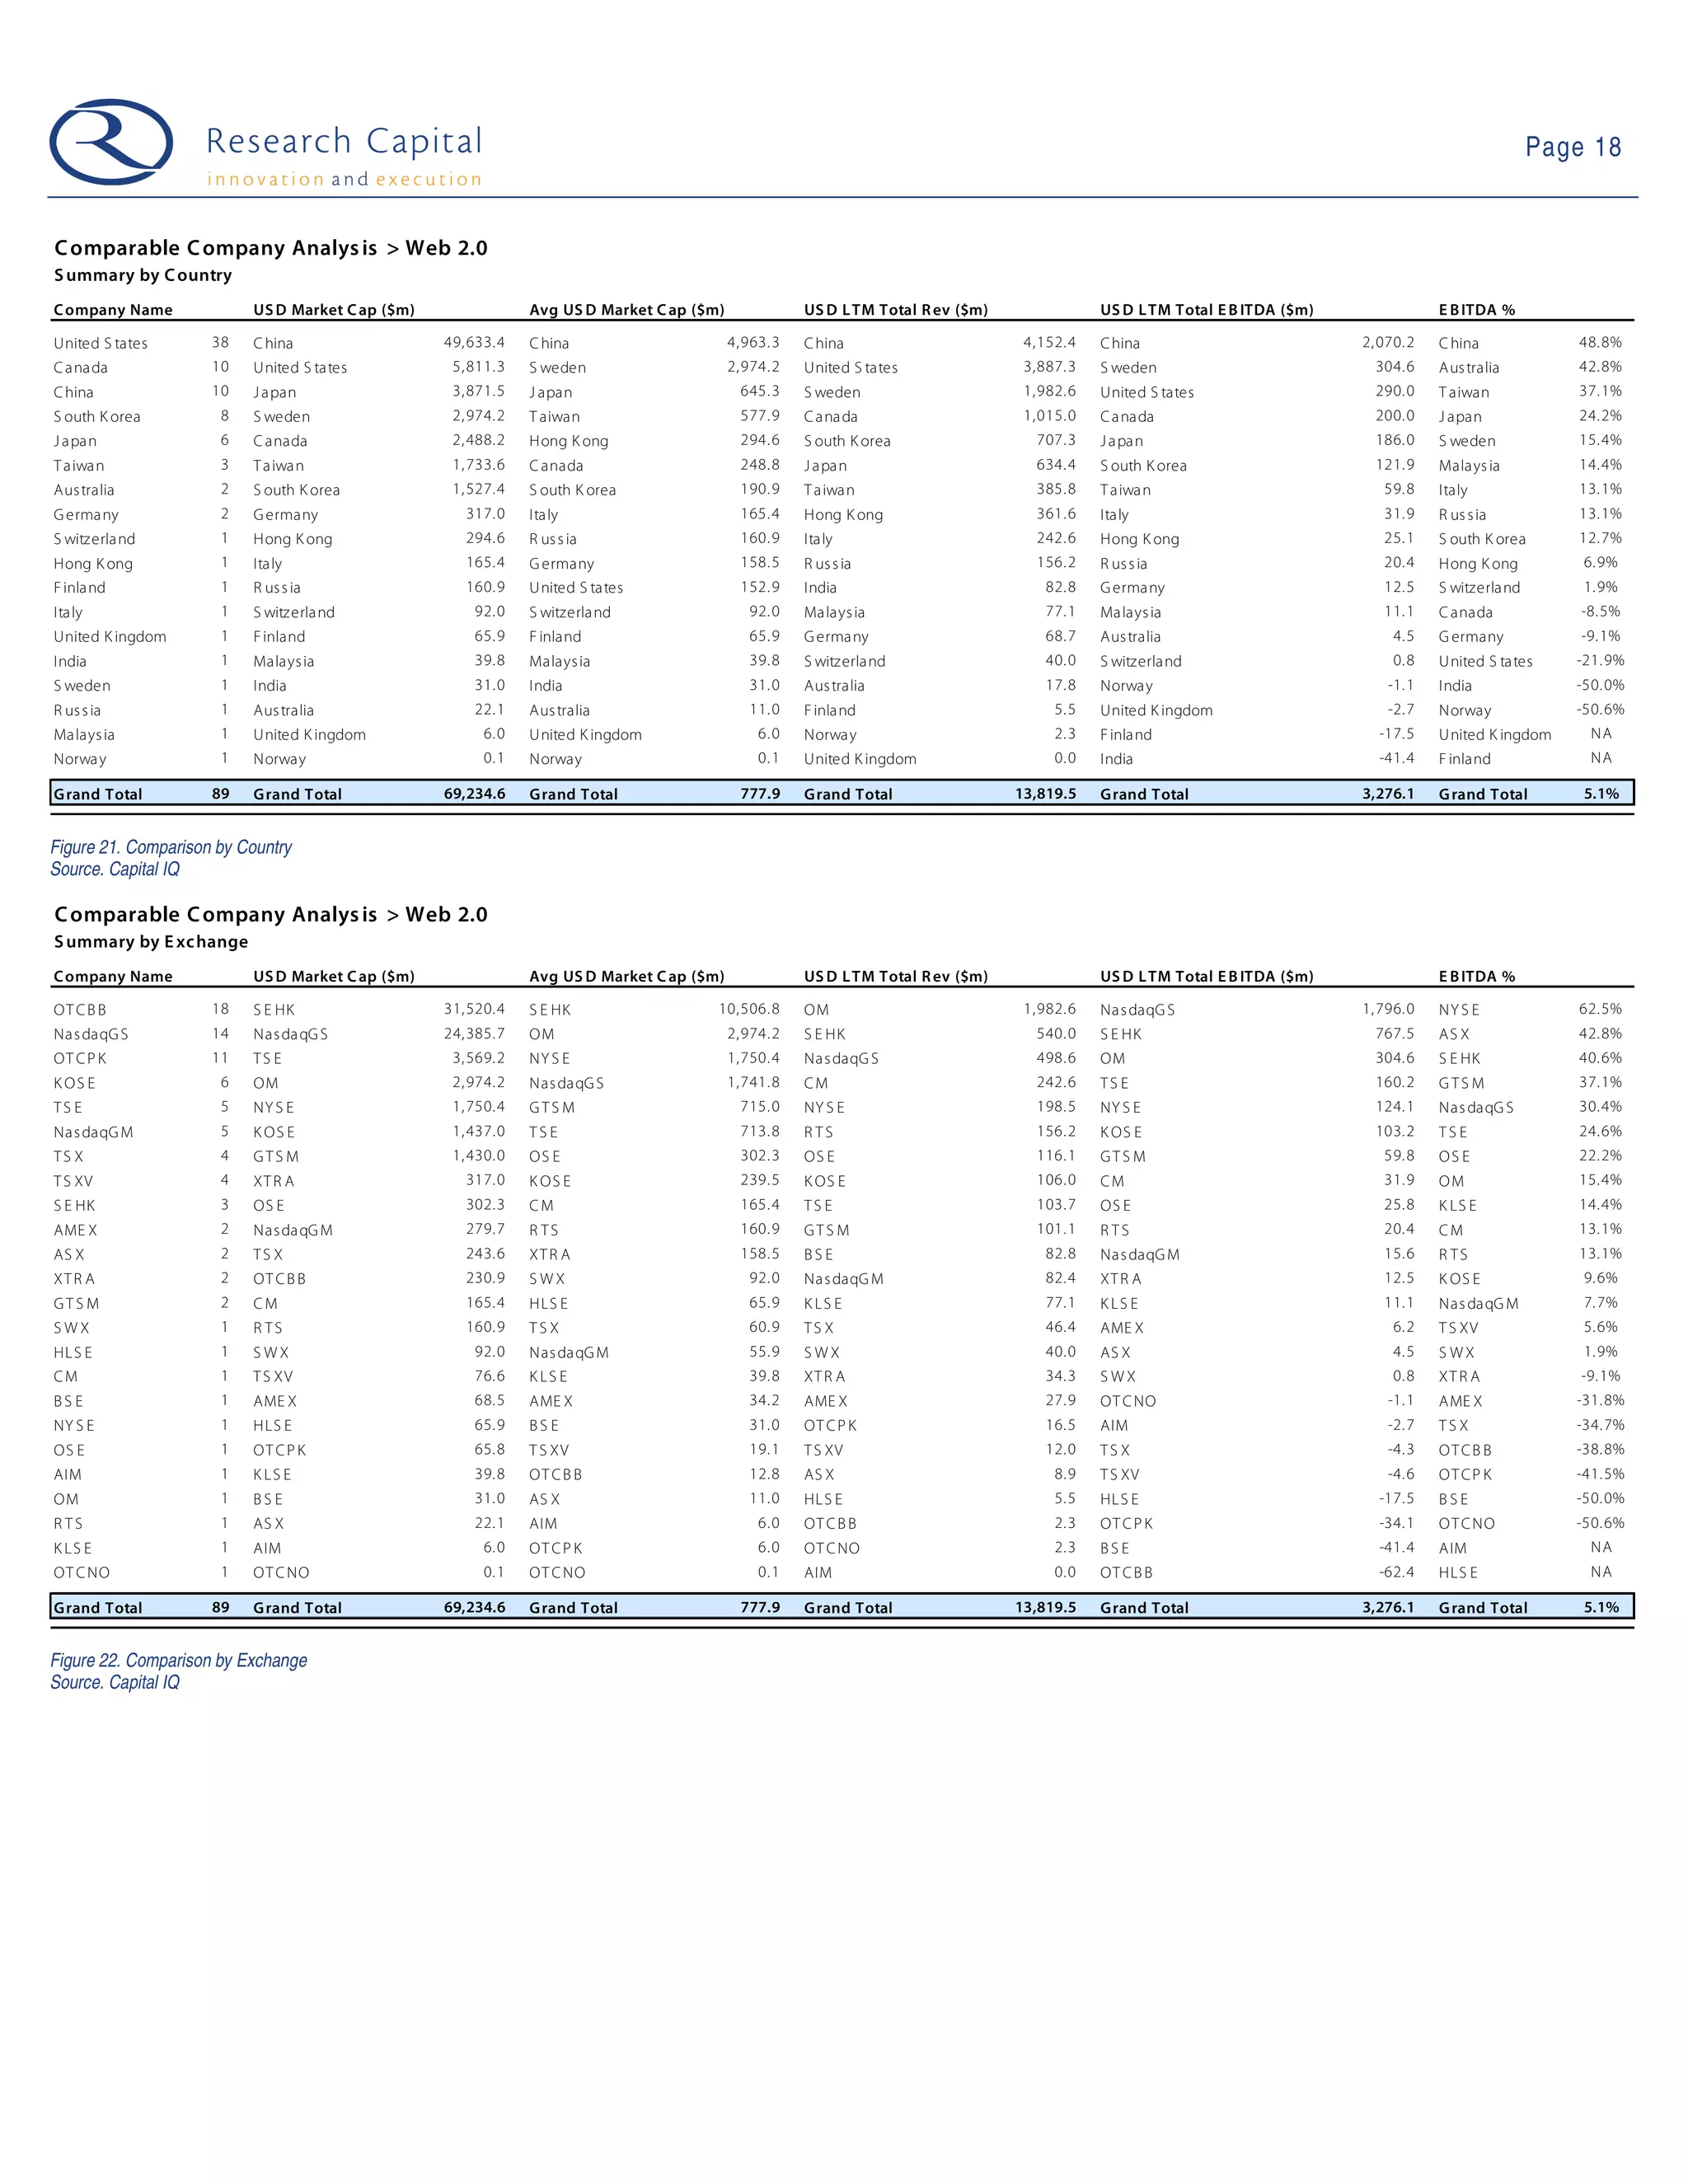
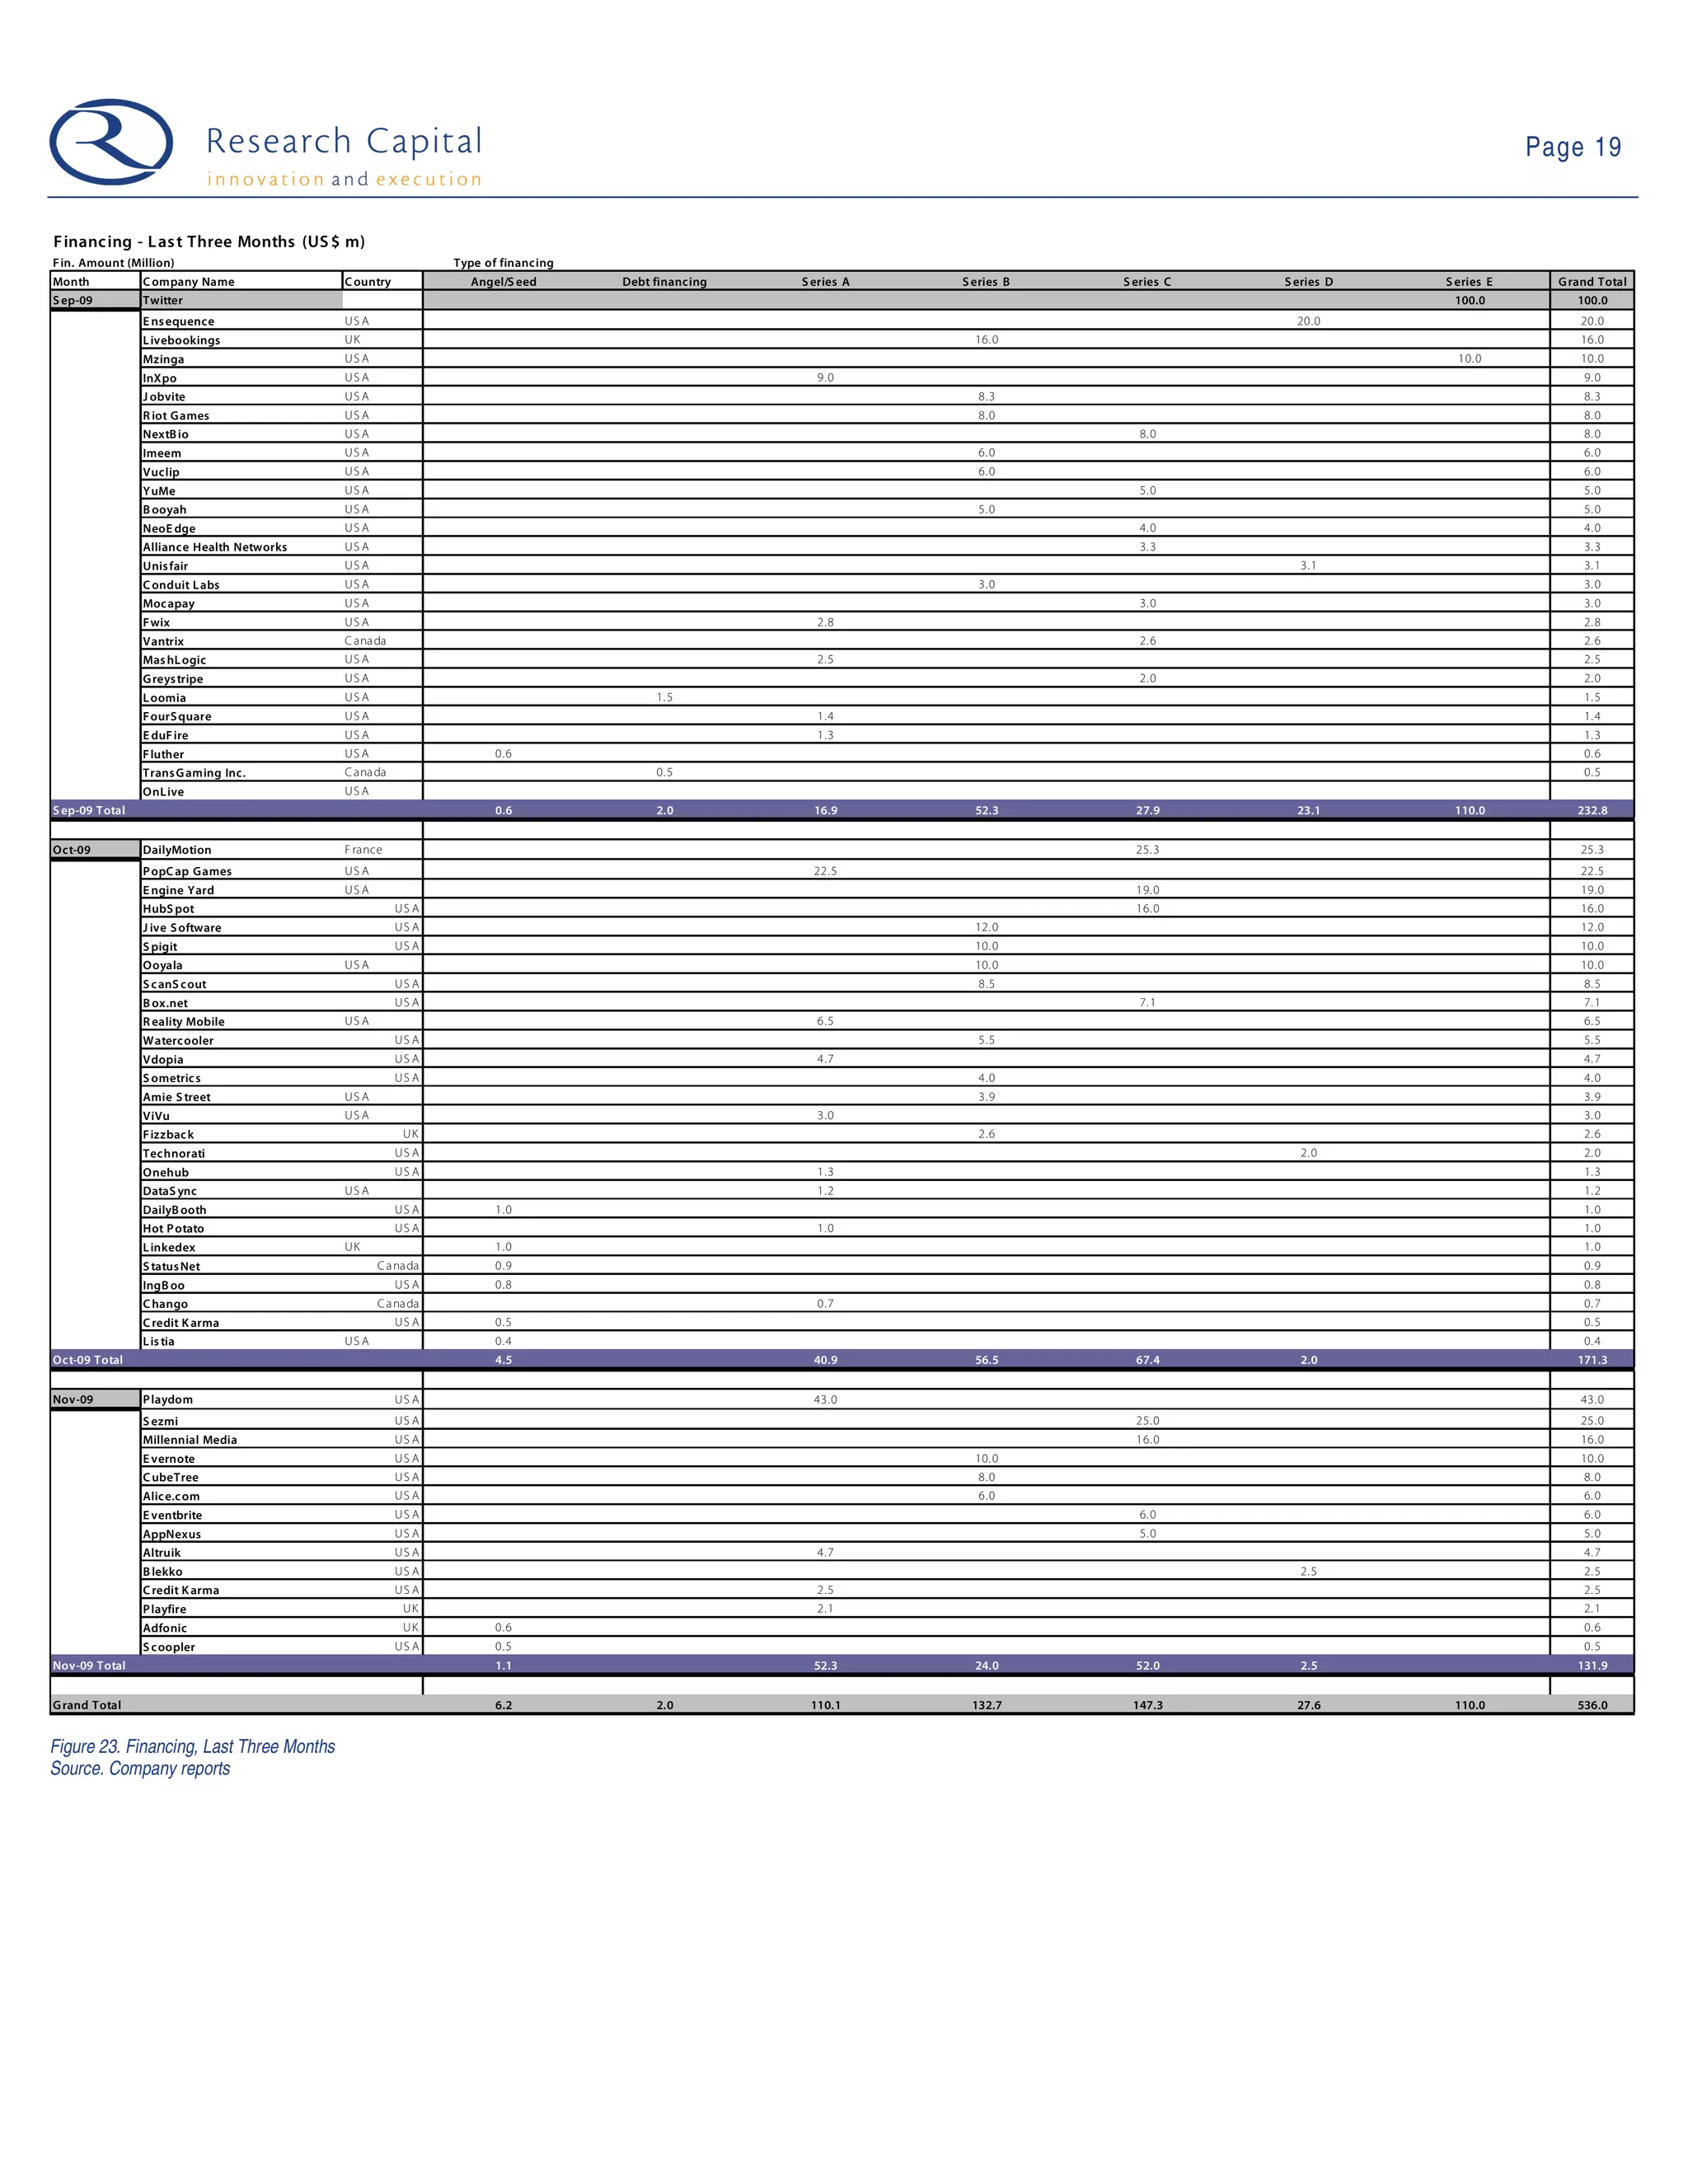
- November saw an increase in financing activity for Web 2.0 companies, with 14 deals totaling $131.9 million, up from previous months. The average deal size was $9.4 million.
- Of the 89 public Web 2.0 companies tracked, 16 saw positive 1-week stock returns while 30 saw negative returns.
- The document analyzes valuation metrics for several Web 2.0 companies, finding average valuations of 5.1x trailing revenue and 11.1x trailing EBITDA across the sector.
LATTER HALF OF 2009: FORGING FORWARD
DEAL VALUE ON PACE TO MEET NOVEMBER LEVEL
December starts at strong pace: Total transaction value in the Web 2.0 universe for the first week of December is $68.8 million. The number of financings stands at seven, averaging $9.8 million each. In comparison, total capital raised in November was $203.4 million, averaging $11.3 million (18 deals); October was $171.3 million, averaging $6.3 million (27 deals); and September was $232.8 million, averaging $9.0 million (26 deals).
Broad-based sector financing: Video, Gaming, Advertising, Collaboration, and Analytics experienced the most financing activity among our Web 2.0 sector categories in the past three months by number of transactions (six each). Social Networks remain strong with five deals in the past quarter. Infrastructure and Search round out the top three positions at four deals each over the past three months. The $400 million acquisition of Playfish skews the Virtual Worlds segment to the highest total.
Market pull-back abates – universe split between risers and decliners: Twenty-five companies in our universe had positive stock price performances over the past week (for stocks with prices greater than $1), while 22 companies showed negative 1-week returns.
New royalty agreement for webcasting & copyright firms: SoundExchange, a nonprofit royalty collecting organization associated with the Recording Industry Association of America (RIAA) agreed this past week to a new deal regarding royalty rates for webcasting. Under the new agreement, large commercial webcasters will pay up to 25% of their revenue to copyright holders – well below the 70% that could have been imposed under an earlier deal. While the deal was initially agreed to by three smaller Internet radio webcasters, Pandora Media, the third largest radio site (according to Alexa), also indicated it would sign on to the agreement.
Online Media companies lead financing: Two online media companies – Pandora (Internet Radio) and QuickPlay (Mobile Video) have secured the largest financing transactions thus far in July ($35 million and $12 million respectively). Total capital raised so far in July is $66.1 million through eight transactions, averaging $8.3 million per transaction. June closed with $180 million in financing on 36 transactions. The averages for the months of May (excluding the Facebook transaction) and June were $6.4 million and $4.7 million, respectively.
A weak price performance week: The companies in our universe had weak stock price performances over the past week (for stocks with prices greater than $1) (Figure 6), with 30 companies showing negative returns on the week. Gravity (NasdaqGM: GRVY) led the group with a 33% return, while GungHo (3765-OSE) had the worst return, dropping 26.4% in the week.
The fourth week of April had only a marginal number of capital raises (four)
and not enough to push the month above March and February levels. Total
financings (month-to-date) were $102.3 million, with February and March
closing off at $185.5 mm and $159.5 mm, respectively. As of last week, a
total of 16 deals closed, with the $20 million raise by Collective Media and
$16 million by GOOM Radio being major contributors. Most of the companies in
our universe had positive stock price performances over the past week (for
stocks with prices greater than $1), with 22 companies showing positive
returns on the week. Modern Times Group Mtg AB (MTG B-OM) led the group with
a 27.7% return, while DigitalTown Inc. (DGTW-OTCBB) had the worst return,
dropping 21.7% in the week. Two companies had better than 20% price
increases last week.
Month-to-date financings in May totalled $106.6 million; led by the $20
million One Net financing. So far, there have been 18 financings in May,
with 10 deals greater than $5 million and only five less than $5 million.
There have been two financings greater than $10 million (Cyberplex and One
Net), with the capital raises by Imeem and EveryZing close behind at $8.8
million and $8.3 million, respectively. The average value thus far in May is
$5.9 million, slightly below the average value for April of $6.5 million on
21 financings. The March average was $6.6 million on 24 financings. Except
for two deals (Kaixin001.com and Collective Media), all were below $20
million for the last three months and a total of four deals were greater
than or equal to $15 million.
*One Net’s $20 million financing is largest deal in May: *One Net announced
a $20 million financing last week, the largest deal so far in May. Ten of
the 18 deals in the month are equal to or greater than $5 million. For
additional details, see Figures 23 and 24 (at end of note). Also note that
the spin-off of StumbleUpon from E-bay on a $29 million valuation occurred
in May. E-bay had bought StumbleUpon for $75 million.
*A strong price performance week: *The companies in our universe had
relatively strong stock price performances over the past week (for stocks
with prices greater than $1) (Figure 6), with 31 companies showing positive
returns on the week. OpenWave Systems (NASDQ:OPWV) led the group with a
49.2% return, while DigitalTown (OTCBB:DGTW) had the worst return, dropping
35.0% in the week.
Financing activity continued to ramp up in April after a slow start to the month. Total financings (month-to-date) jumped to $92.2 million (this week) from $66.3 million (last week) – a significant +40%. As of last week, a total of 12 deals closed, with a $16 million raise by GOOM Radio being a major contributor. A total of four deals greater than $10 million each helped the overall statistics. Social Networking company DigitalTown Inc. (DGTW-OTCBB) was the top price performer for the week, returning 20%, closely followed by Kingsoft Co. Ltd. (3888-EHK) at 17.6%. The9 Ltd. (NCTY-NasdaqGS) had the worst return, dropping 27.6% in the week after news of its losing the license to operate World of Warcraft in China. Of the 34 companies (with stock price greater than $1), 10 companies on our list had price performances greater than +10%. Only one company returned more than
20%.
April on track to be record month?: Total transaction value in the Web 2.0 universe April-to-date is $726.1 million. The number of financings stands at 40 averaging $18.2 million each. Note that this includes the $300 million investment in DST by Tencent. Even excluding this transaction, the average is $15.2 million. In comparison, total capital raised in March was $168.1 million, averaging $5.4 million over 31 deals. The highest monthly total in our Web 2.0 financing database was April 2008 with a total of $765.5 million raised in 47 transactions.
Deal round-up for April: The large deal highlights for the month include:
§
•Tencent invested $300mm in DST (investor in Facebook, Zynga, Groupon).
DST invested $135mm in social-shopping service Groupon.
Salesforce.com acquired crowd-sourced personal contact service, Jigsaw, for $142 mm.
•Warner Bros. acquired gaming company, Turbine, for $160 mm.
•Ankeena Networks, media infrastructure solution provider was acquired by Juniper for $100mm.
Bullish week for Web 2.0: Sixty-nine percent of the companies in our universe had increased or flat market caps over the past week, sixty-nine percent had increased EV/Revenue multiples, 75% had increased or flat EV/EBITDA multiples and 73% had increased or flat P/E mutliples .
The month of April saw 21 financings totalling $144.5 million, with not enough transactions (volume and size) to boost levels above any month in 2009. In perspective, February and March closed off at $185.5 mm and $159.5 million, respectively. On a much more positive note, we saw the announcement from Disney taking a significant position in Hulu - a strategic move in Web-TV distribution. This brings together three of the biggest broadcast and cable network owners under the same banner. Additionally, we would like to highlight that from a sector perspective, video saw the most amount of capital raised at $75.4 million (Figure 4) over a 3-month period. Is this an indication of things to come? Most of the companies in our universe had positive stock price performances over the past week (for stocks with prices greater than $1) (Figure 12), with 19 companies showing positive returns on the week. Tree.com (TREE-NASDAQ) led the group with a 62.3% return, while Beyond Commerce Inc. (BYOC-OTCBB) had the worst return, dropping 10.7% in the week. Four companies had better than 20% price increases last week.
Last week we saw a number of companies in the media and Web 2.0 sector reporting earnings, but none was more surprising than Cyberplex. This company, operating in the ad network space, continued to surprise investors both on the earnings front and capital market activity. In posting approximately 300% growth in revenues Y/Y (see figure below), the company has demonstrated the merit of its business model and has returned to the equity markets for C$15 million to fuel the next phase of its growth.
Month-to-date financings in May totaled $84.3 million and benefited from a financing from Cyberplex for $12.9 million. So far, there have been 14 financings in May with seven deals greater than $5 million and only three less than $5 million. Except for Cyberplex, no deals were greater than $10 million, with the capital raise by Imeem and EveryZing close behind at $8.8 million and $8.3 million, respectively. The companies in our universe had mixed stock price performances over the past week (for stocks with prices greater than $1) (Figure 6), with 24 companies showing positive returns on the week. Ynk Korea, Inc. (A023770-KOSE) led the group with a 30.9% return, while Mixi , Inc. (2121-TSE) had the worst return, dropping 9.2% in the week.
In the first week of May, $38.9 million was raised on seven deals. Over the last three months, four sectors, Media, Ad Network, Video, and Social Network, have seen the most activity, bringing in a combined $209 million on 25 transactions. Overall, capital market activity has trended downwards on the back of a declining economy and lower valuations. With any sustainable certainty and stability in the public markets, we would expect to see activity pick up as more institutions participate in private placements. Seven companies raised $38.9 million in the first week of May. EveryZing, a company in the video search sector, raised $8.3 million, followed by Gist at $6.8 million. All transactions except one (Resonate Networks) were greater than or equal to $5 million. The companies in our universe had mixed stock price performances over the past week (for stocks with prices greater than $1) (Figure 6), with 22 companies showing positive returns on the week. Tree.com (TREE-NASDAQ) led the group with a 27.5% return, while Beyond Commerce, Inc. (BYOC-OTCBB) had the worst return, dropping 21.8% in the week.
This email and any files transmitted with it are privileged, confidential, subject to copyright and intended solely for the use of the individual or entity to whom they are addressed. Views expressed are those of the user and not necessarily this Firm or its subsidiaries. Any unauthorized use, copying, review or disclosure is prohibited. Please notify the sender immediately if you have received this communication in error. Please note that this Firm, nor any of it's employees accept trade instructions via email. If trade instructions are received via email, they will not be acted upon. Thank you for your assistance and co-operation. Member CIPF.
Ce courrier électronique et toutes les pièces jointes transmises sont privés, confidentiels et assujettis aux droits d'auteur et sont conçus pour l'emploi exclusif de l'individu ou de l'entité destinataire. Les opinions exprimées sont celles de l'utilisateur et ne sont pas nécessairement celles de cette firme ou ses filiales. Il est interdit de diffuser, distribuer, réviser ou divulguer ce courrier électronique illégalement. Si ce message vous avez reçu ce communiqué par erreur, veuillez aviser l'expéditeur immédiatement. Veuillez noter que ni cette firme , ni ses employés ne peuvent accepter des instructions de transactions envoyées par courrier électronique. De telles instructions ne seront pas suivies ou exécutées si elles sont reçues par courrier électronique. Nous vous remercions pour votre aide et pour votre coopération. Membre du FCPE.
Aviation MRO IT: Emergence of SaaS and Convergence of BPOguesta9496c4
White paper presentation on the current state, trends and future scenarios for aviation maintenance technologies, taking into account disruptive technological trends in Autonomics, Diagnostics, Prognostics, virtualization, SaaS, Web 2.0 collaboration.
Web 2.0 Weekly - July 20, 2010: "DST Cashing Up"David Shore
Large deals drive July financing to near record levels: With another huge financing (DST - see below) July financing is near record monthly levels. Total raised month-to-date is $742.6 million over 29 deals - averaging $25.6 million each. Excluding the Zynga ($100 million) and DST ($388 million) deals, the average deal size is $9.4 million. In comparison, total capital raised in July 2009 was $209.0 million, averaging $5.2 million over 40 deals. The monthly median total is ~$280 million with a median deal size of $8.1 million.
Deals (M&A, Finance)
Naspers, a South African media and print conglomerate, invested $388 mm in Digital Sky Technologies, the Russian digital media holding company with significant stakes in Facebook, Groupon, Mail.ru, and Zynga.
The next biggest raise of the week was Australian enterprise software developer, Atlassian, receiving $60 mm in Series A funds from Accel Partners.
Social Commerce continues to garner attention – this week BlueSwarm ($0.8 mm angel round) and Shopkick ($15 mm Series B round) raised money.
Another $31 mm in venture funds found their way to Advertising-related start-ups, including Israel-based Adsmarket ($17 mm), as well as a pair of India-based companies – Komli Media ($6 mm) and InMobi ($8 mm).
Price performance split
The Web 2.0 public company universe was split this week, with 48% of companies seeing their market cap fall vs. 43% rising and 9% flat.
*Capital Market Activity: *The month of May closed with 20 financings
totalling $327.1 million led by the $200 million investment by Digital Sky
Technologies in Facebook. Excluding the Facebook transaction, May would have
been the lowest month in CY2009. The Facebook transaction aside, four
transactions (One Net Ent., Cyberplex, Peer39 and OpenX), were greater than
or equal to $10 million. The average value in May is $15.6 million (and $6.4
million excluding the Facebook transaction), greater than the average value
for April of $6.2 million on 21 financings. The March average was $6.5
million on 24 financings. If you are aware of any companies that have
recently raised money that are not on our list, please send me an email to
have them added to our database.
*Price Performance: *Most of the companies in our universe had positive
stock price performances over the past week (for stocks with prices greater
than $1) (Figure 12), with 29 companies showing positive returns on the
week. GameOn co. Ltd (3812-TSE) led the group with a 28.2% return, while
eolith Co. Ltd. (A041060-KOSE) had the worst return, dropping 13.7% in the
week.
Prudential Real Estate's Media Center is highlighted. Learn how to create newsletters for mailing and slideshows to download into an eCard for e-mailing. November 2011 Market Statistics are also reviewed.
Web 2.0 Weekly - Aug. 10, 2010: "Consolidation by Google"David Shore
Deals (M&A, Finance) – Consolidation by Google
Google confirmed or announced two acquisitions during the week, including Jambool
($70 mm) involved in virtual goods monetization processes, and widget market, Slide
($182 mm).
In other acquisition-related news, Forbes sold investment media website Investopedia to ValueClick for $42 mm. Zynga acquired Japanese mobile app and game developer,
Unoh, for an estimated $29 mm. Finally, dubbed “the Spanish Facebook,” social
networking site, Tuenti, was acquired by Telefonica in a $99 mm deal.
The largest financing (aside from the aforementioned M&A activity) involved “the
Chinese Youtube,” Tudou, raising $50 mm in Series E funds.
Price Performance
Distinctly negative price momentum, with 49% of stocks falling over the past week (after 48% of stocks declines last week, and 51% declined the week prior).
Web 2.0 Weekly - Aug. 4, 2010: "Playdom is going to Disney World"David Shore
Deals (M&A, Finance) – Disney Gets In To Social/Mobile Video Games
Disney acquired social and mobile game developer, Playdom, for $563 mm in upfront consideration and the potential for $200 mm in further earn-out based consideration. Disney management notes that the company continues to be on the acquisition war path.
The largest deals in the week involved (wait for it…) the advertising sector, with $15 mm in follow-on financings to eXelate and AdMeld, and $8 mm to BuzzLogic.
Four different social network/media companies received financing in the week, including, Hot Potato (acquired for $10 mm by Facebook), PlacePop ($1.4 mm round), Rapportive ($1 mm seed round), and dating site, Triangulate ($0.75 seed round).
Price Performance - Web 2.0 Valuation Reverse Course and Head Upward
The Web 2.0 public company universe was positive this week with 47% of stocks rising, 46% falling, and 7% flat.
Web 2.0 Weekly - July 27, 2010: "July Financings - Approaching High for 2010"David Shore
Deals (M&A, Finance)
Jive Software received the biggest investment of the week at $30 mm, bringing its total capital raised to date to $57 mm – the company brings social network-like functions to the realm of enterprise collaboration.
Advertising networks continue to receive the most attention among sectors we track – this week, $24.6 mm in financings were announced, including sports-related ad network Sportgenic (acquired by Glam Media for $12 mm), and TurnHere ($12.6mm in Series B funds).
Rumour alert – we continue to hear more frequent buzz concerning the potential acquisition of social gaming developer Playdom by Disney.
Synchronica (AIM:SYNC) intends to acquire iseemedia (TSXV:IEE) for C$8.8 mm in stock – both companies are engaged in mobile communications development, such as email-to-SMS.
Price performance turns positive
The Web 2.0 public company universe was positive this week, with 54% of companies seeing their market cap rise vs. 34% falling and 12% flat.
Google/Zynga deal drives July financing results: After starting very slowly (just one deal announced in the prior week) July financing increased substantially as a result of the Google/Zynga financing ($100-200 million). Total raised month-to-date is $158.8 million over 12 deals - averaging $13.2 million each. In comparison, total capital raised in July 2009 was $206.5 million, averaging $5.3 million over 39 deals. Excluding Dec 09 and Apr 10, the average monthly total is ~$280 million.
Deals (M&A, Finance)
Google invested a rumoured $100-$200 mm in social game developer, Zynga, bringing that company’s total funding to almost $500 mm (assuming the lower end of the range).
The Gaming sector remains hot – along with Google’s investment in Zynga, The9 Ltd. (Chinese online game developer and operator) invested $5 mm in Delaware-based Aurora Feint (focused on gaming for the mobile space).
A triad of financings in the Social Commerce space this week, including Beyond the Rack ($12 mm), ThredUP ($1.7 mm), and BuyWithMe ($16 mm in a Series B financing).
Sysomos, Canadian social media monitoring firm, was acquired by MarketWire for between $25 mm and $35 mm.
Price performance turns positive
The Web 2.0 public company universe rose this week, with 58% of companies seeing their market cap rise vs. 32% rising and 10% flat.
Summer financing doldrums: After a very strong June (with total transaction value (excluding M&A) of $542.8 million from 66 transactions, averaging $8.4 million each), July has started very slowly with only one small financing announced. However, we have seen some large M&A transactions (see below). In comparison, total capital raised in July 2009 was $206.2 million, averaging $5.4 million over 38 deals. Excluding Dec 09 and Apr 10, the average monthly total is ~$270 million.
Deals (M&A, Finance)
Google, acquired ITA Software, search provider for the travel industry for $700 mm.
infoGROUP, provider of business and consumer databases for sales leads, mailing lists, direct marketing, database marketing, e-mail marketing, and marketing research solutions, was taken private for $645 mm by CCMP Capital Advisers.
GroupSpaces, a provider of web-based tools for sports clubs, university societies, organizations, and groups of friends or coworkers, raised $1.3 mm.
Domain based online advertising services provider, OCTANE360, was acquired by Local.com for $10.9 mm.
Negative price performance
The Web 2.0 public company universe fell again this week, with 61% of companies seeing their market cap fall vs. 27% rising and 12% flat.
June financing well ahead of average: Financing in the Web 2.0 universe in June was the third highest month (over the past 12) with total transaction value (excluding M&A) of $459.6 million from 51 transactions, averaging $9.0 million each - led by the $147 million Zynga financing. In comparison, total capital raised in June 2009 was $226.3 million, averaging $4.5 million over 50 deals. Excluding Dec 09 and Apr 10, the average monthly total is ~$260 million.
Deals (M&A, Finance)
Alloy, a provider of news and commentary concerning New Media, was acquired by ZelnickMedia for $127 mm.
Facebook’s implied valuation rose to $24 bn as Elevation Partners purchased 5 mm shares of the company for $120 mm in the secondary market.
Danish Skype competitor, Vopium, received $16.5 mm in financing from Indian financier, Raghuvinder Kataria.
Social networking software developer based in France, Pearltrees, raised $1.6 mm.
PapayaMobile, mobile application software company based in China, raised $4 mm.
Two Israeli mobile developers received funding this week, including Perfecto Mobile ($4 mm) and Snaptu ($6 mm).
Negative price performance
The Web 2.0 public company universe fell this week, with 68% of companies seeing their market cap fall vs. 25% rising and 7% flat.
Web 2.0 Weekly - June 22, 2010: "AOL Sells Bebo for Massive Loss"David Shore
Deals (M&A, Finance)
AOL is reported to have sold Bebo, the UK-based social network it bought just two years ago for $850 mm, to private equity firm Criterion Partners for under $10 mm. Based on our calculations, AOL paid the equivalent of $38 per Unique Visitor (UV) for Bebo, and sold it for under $1 per UV.
Positive price performance
The Web 2.0 public company universe rose again this week, with 60% of companies seeing their market cap rise vs. 33% falling and 7% flat.
Web 2.0 Weekly - May 26, 2010: "Market Declines Impact Web 2.0 Universe Valua...David Shore
May tracking to average monthly levels: After a slow start to the month, financing in the Web 2.0 universe has rebounded and is now on track with prior months. Total transaction value (excluding M&A) in the Web 2.0 universe for May (month-to-date) is $189.9 million from 30 transactions, averaging $6.3 million each. In comparison, total capital raised in May 2009 was $375.0 million, averaging $12.5 million over 30 deals. Excluding May 09, Dec 09 and Apr 10, the average monthly total is $212 million.
Deals (M&A, Finance)
Cyberplex (TSX:CX) announced plans to acquire Tsavo Media for US$75.6 mm, partially funded through a C$30 mm bought deal financing at $0.55.
Online gaming company Gaikai, raised $10.0 mm in Series B financing.
Blip.TV, online TV provider, raised $10.1 mm in Series C financing.
Financial Results/Guidance
Netease.com (NasdaqGS:NTES, online gaming) reported Q1/F10 revenue of RMB 1.2 bn (vs. RMB 781.7 mm in the same period last year).
Snap Interactive (OTCBB:STVI, online dating) reported Q1/F10 revenue growth of 20% to $0.927 mm from $0.768 mm.
Bearish week again: Price performance was largely negative in our Web 2.0 universe. This impacted valuation multiples, which fell for ~80% of the companies in our universe.
Slow start in May after record April: Total transaction value (excluding M&A) in the Web 2.0 universe for April was $813.5 million - the highest monthly total we have recorded. The number of financings was also a record, at 49, averaging $16.6 million each. Note that this includes the $300 million investment in DST by Tencent. Excluding this transaction, the average is $10.7 million. May 2010, in contrast, has started slowly, with only $37.4 million in financing announced thus far, averaging just $3.4 million across 11 deals. In comparison, total capital raised in May 2009 was $375.0 million, averaging $12.5 million over 30 deals.
Deal round-up for May: The large deal highlights for the month include:
Fluid Music (TSX:FMN, digital music distributor) will acquire Mood Media (provider of sensorial marketing solutions) for €160 mm.
Lithium is purchasing analytics developer, Scout Labs, for $20 mm.
Fatfoogoo (purveyor of virtual goods) is being acquired by Digital River for $10 mm.
Groupalia, the Spanish answer to online group discount retailers, Groupon and LivingSocial, raised $2.5 mm in a Series A financing – the online group discounters have been raising money quickly (DST invested $135 mm in Groupon in April) with a total of $222 mm in funding coming to just these three players thus far.
Bearish week again: Price performance was largely negative in our Web 2.0 universe, with prices dropping for over 70% of the companies.
April 2010 a record month for Web 2.0 Financing: Total transaction value (excluding M&A) in the Web 2.0 universe for April was $808.2 million - the highest monthly total we have recorded. The number of financings was also a record, at 48, averaging $16.8 million each. Note that this includes the $300 million investment in DST by Tencent. Excluding this transaction, the average is $9.6 million. In comparison, total capital raised in March was $168.1 million, averaging $5.4 million over 31 deals.
Deal round-up for April: The large deal highlights for the month include:
Tencent invested $300mm in DST (investor in Facebook, Zynga, Groupon).
Apple acquired Siri, a mobile local search developer for a rumoured $225 mm.
DST acquired ICQ, the instant messaging company, for $187.5 mm.
Warner Bros. acquired gaming company, Turbine, for $160 mm.
DST invested $135mm in social-shopping service Groupon.
Salesforce.com acquired crowd-sourced personal contact service, Jigsaw, for $142 mm.
Ankeena Networks, media infrastructure solution provider was acquired by Juniper for $100mm.
Bearish week: Price performance was largely negative in our Web 2.0 universe, with prices dropping for over 60% of the companies.
10 01 05 Web 2.0 Weekly Special EditionDavid Shore
TOP FIVE DEALS OF 2009
The Top Five: Despite over 400 transactions in 2009, it wasn’t hard choosing our Top Five transactions for 2009 (with a little bit of massaging). Our Top Five transactions are: Facebook’s $200 million D round, Twitter’s $100 million E round, the $2.25 billion acquisition of Skype, the almost $1 billion in financing/M&A for Social Gaming companies (including Zynga, Playdom and Playfish), and the incredible per unique visitor value ascribed in the financing for location-based social networking company Gowalla.
• Facebook raises $200 million D round: In May 2009, Facebook announced a new financing round – raising $200 million from Digital Sky Technologies. The transaction gave Digital Sky a 1.96% stake, valuing Facebook at $10 billion. This financing brought the company’s total to $678.2 million. This was also the largest financing we recorded in 2009.
• Twitter raises $100 million E round: The third largest financing round in 2009 belonged to Twitter – a $100 million Series E in September 2009. The financing reportedly valued Twitter at $1 billion – a remarkable valuation for a company that has not yet formalized a revenue model! More recently, it has been reported that Twitter was actually profitable in 2009 due to the $25 million in search deals it signed in October with Google and Microsoft.
• Skype is acquired for $2.025 billion: By far the largest overall transaction in our database in 2009 was the acquisition of a majority position (65%) in Skype from eBay for $2.025 billion – announced in September 2009. The transaction was completed in November 2009. eBay had purchased Skype for $4.0 billion in 2005.
• Social Gaming financing activity reaches ~$1 billion (Zynga, Playfish, Playdom, etc.): Perhaps the hottest sector overall in 2009 was Social Gaming. This segment of the Web 2.0 market had the third highest number of deals (39) and generated almost $1 billion in financing/M&A activity – the second highest total overall (Figure 1). Three transactions in particular stand out in the social gaming space – the $400 million acquisition of Playfish (by Electronic Arts, November 2009), the $180 million financing of Zynga (Series C, December 2009, by Digital Sky), and the $43 million first round of financing for Playdom (New Enterprise lead, November 2009, Series A). There has been much speculation as to how the larger social gaming companies will proceed, with potential IPO or further strategic M&A most likely.
• Hottest new sector? Location-based social networks (Foursquare, Gowalla, etc.). Unique visitor value skyrockets: Financing activity for location-based social networks really heated up late in 2009. While the total financing raised in 2009 was quite small (~$15 million), the hype surrounding location-based SNS companies was substantial. In our opinion, this was highlighted by the $8.4 million December Series B financing for Gowalla. The reported valuation of $28.4 million implies a value of $568 for each of its 50,000 users (Figure 2). That compares to a $40 per user value we estimate for the Foursquare financing in September.
The Art of the Pitch: WordPress Relationships and SalesLaura Byrne
Clients don’t know what they don’t know. What web solutions are right for them? How does WordPress come into the picture? How do you make sure you understand scope and timeline? What do you do if sometime changes?
All these questions and more will be explored as we talk about matching clients’ needs with what your agency offers without pulling teeth or pulling your hair out. Practical tips, and strategies for successful relationship building that leads to closing the deal.
Observability Concepts EVERY Developer Should Know -- DeveloperWeek Europe.pdfPaige Cruz
Monitoring and observability aren’t traditionally found in software curriculums and many of us cobble this knowledge together from whatever vendor or ecosystem we were first introduced to and whatever is a part of your current company’s observability stack.
While the dev and ops silo continues to crumble….many organizations still relegate monitoring & observability as the purview of ops, infra and SRE teams. This is a mistake - achieving a highly observable system requires collaboration up and down the stack.
I, a former op, would like to extend an invitation to all application developers to join the observability party will share these foundational concepts to build on:
Encryption in Microsoft 365 - ExpertsLive Netherlands 2024Albert Hoitingh
In this session I delve into the encryption technology used in Microsoft 365 and Microsoft Purview. Including the concepts of Customer Key and Double Key Encryption.
Accelerate your Kubernetes clusters with Varnish CachingThijs Feryn
A presentation about the usage and availability of Varnish on Kubernetes. This talk explores the capabilities of Varnish caching and shows how to use the Varnish Helm chart to deploy it to Kubernetes.
This presentation was delivered at K8SUG Singapore. See https://feryn.eu/presentations/accelerate-your-kubernetes-clusters-with-varnish-caching-k8sug-singapore-28-2024 for more details.
Alt. GDG Cloud Southlake #33: Boule & Rebala: Effective AppSec in SDLC using ...James Anderson
Effective Application Security in Software Delivery lifecycle using Deployment Firewall and DBOM
The modern software delivery process (or the CI/CD process) includes many tools, distributed teams, open-source code, and cloud platforms. Constant focus on speed to release software to market, along with the traditional slow and manual security checks has caused gaps in continuous security as an important piece in the software supply chain. Today organizations feel more susceptible to external and internal cyber threats due to the vast attack surface in their applications supply chain and the lack of end-to-end governance and risk management.
The software team must secure its software delivery process to avoid vulnerability and security breaches. This needs to be achieved with existing tool chains and without extensive rework of the delivery processes. This talk will present strategies and techniques for providing visibility into the true risk of the existing vulnerabilities, preventing the introduction of security issues in the software, resolving vulnerabilities in production environments quickly, and capturing the deployment bill of materials (DBOM).
Speakers:
Bob Boule
Robert Boule is a technology enthusiast with PASSION for technology and making things work along with a knack for helping others understand how things work. He comes with around 20 years of solution engineering experience in application security, software continuous delivery, and SaaS platforms. He is known for his dynamic presentations in CI/CD and application security integrated in software delivery lifecycle.
Gopinath Rebala
Gopinath Rebala is the CTO of OpsMx, where he has overall responsibility for the machine learning and data processing architectures for Secure Software Delivery. Gopi also has a strong connection with our customers, leading design and architecture for strategic implementations. Gopi is a frequent speaker and well-known leader in continuous delivery and integrating security into software delivery.
Enhancing Performance with Globus and the Science DMZGlobus
ESnet has led the way in helping national facilities—and many other institutions in the research community—configure Science DMZs and troubleshoot network issues to maximize data transfer performance. In this talk we will present a summary of approaches and tips for getting the most out of your network infrastructure using Globus Connect Server.
Removing Uninteresting Bytes in Software FuzzingAftab Hussain
Imagine a world where software fuzzing, the process of mutating bytes in test seeds to uncover hidden and erroneous program behaviors, becomes faster and more effective. A lot depends on the initial seeds, which can significantly dictate the trajectory of a fuzzing campaign, particularly in terms of how long it takes to uncover interesting behaviour in your code. We introduce DIAR, a technique designed to speedup fuzzing campaigns by pinpointing and eliminating those uninteresting bytes in the seeds. Picture this: instead of wasting valuable resources on meaningless mutations in large, bloated seeds, DIAR removes the unnecessary bytes, streamlining the entire process.
In this work, we equipped AFL, a popular fuzzer, with DIAR and examined two critical Linux libraries -- Libxml's xmllint, a tool for parsing xml documents, and Binutil's readelf, an essential debugging and security analysis command-line tool used to display detailed information about ELF (Executable and Linkable Format). Our preliminary results show that AFL+DIAR does not only discover new paths more quickly but also achieves higher coverage overall. This work thus showcases how starting with lean and optimized seeds can lead to faster, more comprehensive fuzzing campaigns -- and DIAR helps you find such seeds.
- These are slides of the talk given at IEEE International Conference on Software Testing Verification and Validation Workshop, ICSTW 2022.
DevOps and Testing slides at DASA ConnectKari Kakkonen
My and Rik Marselis slides at 30.5.2024 DASA Connect conference. We discuss about what is testing, then what is agile testing and finally what is Testing in DevOps. Finally we had lovely workshop with the participants trying to find out different ways to think about quality and testing in different parts of the DevOps infinity loop.
Climate Impact of Software Testing at Nordic Testing DaysKari Kakkonen
My slides at Nordic Testing Days 6.6.2024
Climate impact / sustainability of software testing discussed on the talk. ICT and testing must carry their part of global responsibility to help with the climat warming. We can minimize the carbon footprint but we can also have a carbon handprint, a positive impact on the climate. Quality characteristics can be added with sustainability, and then measured continuously. Test environments can be used less, and in smaller scale and on demand. Test techniques can be used in optimizing or minimizing number of tests. Test automation can be used to speed up testing.
In his public lecture, Christian Timmerer provides insights into the fascinating history of video streaming, starting from its humble beginnings before YouTube to the groundbreaking technologies that now dominate platforms like Netflix and ORF ON. Timmerer also presents provocative contributions of his own that have significantly influenced the industry. He concludes by looking at future challenges and invites the audience to join in a discussion.
UiPath Test Automation using UiPath Test Suite series, part 4DianaGray10
Welcome to UiPath Test Automation using UiPath Test Suite series part 4. In this session, we will cover Test Manager overview along with SAP heatmap.
The UiPath Test Manager overview with SAP heatmap webinar offers a concise yet comprehensive exploration of the role of a Test Manager within SAP environments, coupled with the utilization of heatmaps for effective testing strategies.
Participants will gain insights into the responsibilities, challenges, and best practices associated with test management in SAP projects. Additionally, the webinar delves into the significance of heatmaps as a visual aid for identifying testing priorities, areas of risk, and resource allocation within SAP landscapes. Through this session, attendees can expect to enhance their understanding of test management principles while learning practical approaches to optimize testing processes in SAP environments using heatmap visualization techniques
What will you get from this session?
1. Insights into SAP testing best practices
2. Heatmap utilization for testing
3. Optimization of testing processes
4. Demo
Topics covered:
Execution from the test manager
Orchestrator execution result
Defect reporting
SAP heatmap example with demo
Speaker:
Deepak Rai, Automation Practice Lead, Boundaryless Group and UiPath MVP
GraphRAG is All You need? LLM & Knowledge GraphGuy Korland
Guy Korland, CEO and Co-founder of FalkorDB, will review two articles on the integration of language models with knowledge graphs.
1. Unifying Large Language Models and Knowledge Graphs: A Roadmap.
https://arxiv.org/abs/2306.08302
2. Microsoft Research's GraphRAG paper and a review paper on various uses of knowledge graphs:
https://www.microsoft.com/en-us/research/blog/graphrag-unlocking-llm-discovery-on-narrative-private-data/
Le nuove frontiere dell'AI nell'RPA con UiPath Autopilot™UiPathCommunity
In questo evento online gratuito, organizzato dalla Community Italiana di UiPath, potrai esplorare le nuove funzionalità di Autopilot, il tool che integra l'Intelligenza Artificiale nei processi di sviluppo e utilizzo delle Automazioni.
📕 Vedremo insieme alcuni esempi dell'utilizzo di Autopilot in diversi tool della Suite UiPath:
Autopilot per Studio Web
Autopilot per Studio
Autopilot per Apps
Clipboard AI
GenAI applicata alla Document Understanding
👨🏫👨💻 Speakers:
Stefano Negro, UiPath MVPx3, RPA Tech Lead @ BSP Consultant
Flavio Martinelli, UiPath MVP 2023, Technical Account Manager @UiPath
Andrei Tasca, RPA Solutions Team Lead @NTT Data
GDG Cloud Southlake #33: Boule & Rebala: Effective AppSec in SDLC using Deplo...James Anderson
Effective Application Security in Software Delivery lifecycle using Deployment Firewall and DBOM
The modern software delivery process (or the CI/CD process) includes many tools, distributed teams, open-source code, and cloud platforms. Constant focus on speed to release software to market, along with the traditional slow and manual security checks has caused gaps in continuous security as an important piece in the software supply chain. Today organizations feel more susceptible to external and internal cyber threats due to the vast attack surface in their applications supply chain and the lack of end-to-end governance and risk management.
The software team must secure its software delivery process to avoid vulnerability and security breaches. This needs to be achieved with existing tool chains and without extensive rework of the delivery processes. This talk will present strategies and techniques for providing visibility into the true risk of the existing vulnerabilities, preventing the introduction of security issues in the software, resolving vulnerabilities in production environments quickly, and capturing the deployment bill of materials (DBOM).
Speakers:
Bob Boule
Robert Boule is a technology enthusiast with PASSION for technology and making things work along with a knack for helping others understand how things work. He comes with around 20 years of solution engineering experience in application security, software continuous delivery, and SaaS platforms. He is known for his dynamic presentations in CI/CD and application security integrated in software delivery lifecycle.
Gopinath Rebala
Gopinath Rebala is the CTO of OpsMx, where he has overall responsibility for the machine learning and data processing architectures for Secure Software Delivery. Gopi also has a strong connection with our customers, leading design and architecture for strategic implementations. Gopi is a frequent speaker and well-known leader in continuous delivery and integrating security into software delivery.
A tale of scale & speed: How the US Navy is enabling software delivery from l...sonjaschweigert1
Rapid and secure feature delivery is a goal across every application team and every branch of the DoD. The Navy’s DevSecOps platform, Party Barge, has achieved:
- Reduction in onboarding time from 5 weeks to 1 day
- Improved developer experience and productivity through actionable findings and reduction of false positives
- Maintenance of superior security standards and inherent policy enforcement with Authorization to Operate (ATO)
Development teams can ship efficiently and ensure applications are cyber ready for Navy Authorizing Officials (AOs). In this webinar, Sigma Defense and Anchore will give attendees a look behind the scenes and demo secure pipeline automation and security artifacts that speed up application ATO and time to production.
We will cover:
- How to remove silos in DevSecOps
- How to build efficient development pipeline roles and component templates
- How to deliver security artifacts that matter for ATO’s (SBOMs, vulnerability reports, and policy evidence)
- How to streamline operations with automated policy checks on container images
A tale of scale & speed: How the US Navy is enabling software delivery from l...
09 11 17 Web 2.0 Weekly
1. SOFTWARE & SERVICES 17 NOVEMBER 2009
DAVID SHORE, CFA, MBA 416.860.6784
WEB 2.O WEEKLY david.shore@researchcapital.com
Damian Wojcichowsky, CFA (Associate), 416.860.7652
FINANCINGS PICK UP…IN LINE WITH TREND
CA P IT AL M AR K ET S AC T I VIT Y P IC K S U P S U DD E NL Y
November picks up: Total transaction value in the W eb 2.0 universe for November is $131.9 million. November has
shown improvement with number of financings up to 14 averaging $9.4 million each (vs. an average of $7.4 million
last week). In comparison, total capital raised in October was $171.3 million, averaging $6.3 million (27 deals);
September was $232.8 million, averaging $9.0 million (26 deals); and August was $221.6 million, averaging $7.6
million (29 deals).
Financing Activity Last Twelve Months
400.0 16.0
14.6
350.0 14.0
300.0 12.0
11.1
250.0 9.4 10.0
9.0
(US$m)
(US$m)
200.0 7.6 8.0
7.1
6.7 6.6
6.5 6.3
6.2
150.0 5.6 6.0
4.9
100.0 4.0
50.0 2.0
0.0 0.0
Nov-08 Dec-08 Jan-09 Feb-09 Mar-09 Apr-09 May-09 Jun-09 Jul-09 Aug-09 Sep-09 Oct-09 Nov-09
*May-09 includes $200m FB investment Total Average
Market pull-back: Sixteen companies in our universe had positive stock price performances over the past week (for
stocks with prices greater than $1) (Figure 6), while 30 companies showed negative 1-week returns.
1 Wee k P rice P erformance
Openw ave S y s tems Inc . 15.8%
G igaMedia L td. 14.1%
Y nk K orea Inc . 9.0%
Tenc ent Holdings L td. 6. 7%
A ctoz S oft Co., L td. 6.5%
NEOWIZ G ames Corporation 5. 9%
Changy ou. c om L imited 4. 1%
Modern Times G roup Mtg A B 3. 7%
G amania Digital Entertainment 3.2%
Chines e G amer International 3.0%
S K Communic ations Co., L td. 2.0%
IA C/InterA c tiveCorp. 1. 6%
S hutterfly, Inc . 1.4%
XING A G 1. 2%
TheS treet. com, Inc . 1. 2%
CDC Corp. 0. 8%
Fluid Mus ic Canada, Inc . 0. 0%
Eolith Co. L td. 0. 0%
V alueClic k Inc . -1.0%
PNI Digital Media Inc . -1. 1%
Neteas e.c om Inc . -1.2%
United Online Inc . -1.3%
S ohu.c om Inc . -1.6%
NetDragon WebS of t, Inc . -1. 9%
Open Tex t Corp. -2.0%
My riad G roup A G -2. 3%
S handa Interac tive -2.5%
S park Netw orks , Inc . -2.6%
Frogs ter Interactive Pic tures -3. 3%
Cy berplex Inc . -3. 6%
DA DA S pA -3. 6%
G iant Interac tive G roup, Inc . -3.7%
HanbitS of t, Inc . -3.8%
K ings of t Co. L td. -3.8%
W ebz en Inc . -4.2%
L ookS mart, L td. -4.3%
G ameOn Co L td. -5. 4%
Northgate Technologies L imited -5.5%
The9 L imited -6.0%
Tree.Com, Inc . -6. 2%
G ravity Co. , L td -7. 0%
Quepas a Corp. -7.1%
Perfec t World Co., L td. -7.6%
Y D Online Corp. -8.4%
Ngi G roup Inc . -9.8%
Mix i, Inc . -13. 2%
A Q Interac tive, Inc . -15.6%
G ree, Inc . -17.7%
-0.2 -0. 15 -0.1 -0.05 0 0. 05 0.1 0. 15 0. 2
This report has been created b y Anal ysts that are emplo yed b y Research Capital Corporation, a Canadian Investment Dealer.
For further disclosures, please see last page of this report.
w w w . r e s e a rc h c a p i t a l . c o m
T o ro n t o 4 1 6 . 8 6 0 . 7 6 0 0 Montreal 514.399.1500 Vancouver 604.662.1800 Calgary 403.265.7400 Regina 306.566.7550
2. Page 2
THE WEB 2.0 UNIVERSE
Eighty-nine public Web 2.0 companies: Our W eb 2.0 universe contains 89 companies, with a combined market cap of
approximately $72 billion (Figure 1). The median market cap for the group is $41 million, with average trailing revenue of
$163 million (median $56 million). The companies are also generally profitable with a median EBITDA margin of 11.6%.
On a valuation basis, the overall average is 5.1x trailing revenue (median 1.7x) and 11.1x trailing EBITDA (median 7.8x).
Twenty of the companies have more than 500 employees.
C omparable C ompany Analys is > Web 2.0
Trading C urrent US D Market US D L TM Total US D L TM Total E B ITDA TE V/L TM TE V/L TM
C ompany Name L TM as of Ticker E xc hange C urrency HQ P rice C ap ($m) R ev ($m) E B ITDA ($m) % R evenue E B ITDA E mployees
Accelerize New Media , Inc. 6/30/2009 AC LZ OT C B B US D United S ta tes 0. 73 20. 4 4. 4 (3.7) -83. 3% 5. 7x - 11
Actoz S oft C o. , Ltd. 6/30/2009 A052790 K OS E KR W S outh K orea 16,450 119. 5 108.7 25. 9 23. 8% 0. 8x 3. 4x NA
AQ Interactive, Inc. 6/30/2009 3838 TS E JPY J a pan 40,000 24. 3 66. 1 (2.0) -2.9% 0. 0x - NA
As s ociated Media Holdings Inc. 6/30/2007 AS MH OT C P K US D United S ta tes 0. 76 32. 9 0. 1 (2.3) NM - - 3
B igs tring C orp. 6/30/2009 BS GC OT C B B US D United S ta tes 0. 03 1.9 0. 1 (1.5) NM 47.2x - 4
B eta wave C orporation 6/30/2009 B W AV OT C B B US D United S ta tes 0. 04 1.0 9. 4 (12. 6) NM - - 51
B eyond C ommerce, Inc. 6/30/2009 B Y OC OT C B B US D United S ta tes 0. 06 3.0 11. 7 (12. 8) NM 0. 8x - 101
B right T hings plc 3/31/2009 AIM: B G T AIM GBP United K ingdom 0. 01 5.1 0. 0 (2.7) NM - - NA
B roa dW ebAs ia Inc. 9/30/2008 BWBA OT C P K US D United S ta tes 0. 07 5.9 0. 0 (4.6) NM - - 46
C DC C orp. 6/30/2009 C HIN. A Na s daqG S US D Hong K ong 2. 54 269. 2 361.6 25. 1 6.9% 0. 7x 10. 5x 2, 227
#R E F ! 9/30/2009 C Y OU Na s daqG S US D C hina 34. 50 1,897. 5 255.3 157.4 61. 7% 6. 2x 10. 1x 628
C hina G a teway C orporation 9/30/2008 CGWY OT C P K US D United S ta tes 0. 00 0.0 6. 7 (6.6) -98. 9% 0. 0x - 37
C hines e G amer Interna tiona l 9/30/2009 G T S M: 3083 GTS M TWD T aiwa n 458 1,186. 5 68. 3 39. 6 58. 0% 16.2x 27. 9x NA
C LIC K E R Inc. 5/31/2009 C LK Z OT C B B US D United S ta tes 0. 01 0.6 2. 5 (1.2) -45. 8% 0. 3x - 22
C ornerW orld C orpora tion 7/31/2009 CWR L OT C B B US D United S ta tes 0. 06 5.7 6. 8 NM NM 2. 4x - 16
C yberplex Inc. 6/30/2009 T S X :C X TS X C AD C anada 1 81. 1 89. 8 9.7 10. 8% 0. 7x 6. 3x NA
DADA S pA 6/30/2009 C M: DA CM E UR Italy 7. 09 168. 2 241.9 31. 8 13. 1% 0. 9x 6. 8x NA
DXN Holdings B hd 8/31/2009 DX N K LS E MY R Ma la ys ia 0. 62 40. 5 77. 3 (84. 0) NM 0. 7x - NA
Dibz International, Inc. NA DIB Z OT C P K US D United S ta tes 0. 00 0.0 NA NM NM - - NA
DigitalP os t Interactive, Inc. 6/30/2009 DG LP OT C B B US D United S ta tes 0. 06 4.6 1. 0 (1.4) NM 6. 6x - 7
DigitalT own, Inc. 8/31/2009 DG T W OT C B B US D United S ta tes 1. 20 32. 8 0. 0 (1.8) NM - - 3
Dolphin Digital Media , Inc. 6/30/2009 DP DM OT C B B US D United S ta tes 0. 33 17. 7 0. 6 (3.4) NM 32.1x - NA
E olith C o. Ltd. 12/31/2008 A041060 K OS E KR W S outh K orea 570 34. 6 15. 4 (3.6) -23. 6% 2. 4x - NA
E xtens ions , Inc. 6/30/2009 E XT I OT C P K US D United S ta tes 0. 30 13. 3 NM NM NM - - 2
F luid Mus ic C a nada , Inc. 6/30/2009 T S X :F MN TS X C AD United S ta tes 1. 80 86. 8 5. 3 (5.1) -95. 2% 15.4x - NA
F rogs ter Interactive P ictures AG 6/30/2009 FRG XT R A E UR G ermany 18. 05 67. 7 9. 6 (4.5) -47. 0% 6. 9x - NA
G ama nia Digita l E ntertainment C o., Ltd. 9/30/2009 6180 GTS M TWD T aiwa n 46. 50 217. 8 151.2 24. 9 16. 5% 1. 3x 7. 8x NA
G ameOn C o Ltd. 6/30/2009 3812 TS E JPY J a pan 68,300 73. 9 81. 9 20. 1 24. 5% - - NA
G eoS entric O yj 6/30/2009 G E O 1V HL S E E UR F inland 0. 06 78. 9 5. 4 (17. 4) NM 14.5x - 115
G iant Interactive G roup, Inc. 6/30/2009 GA NY S E US D C hina 7 1,587. 4 198.5 124.1 62. 5% - - 1, 570
G iga Media Ltd. 3/31/2009 G IG M Na s daqG S US D T aiwa n 4. 36 237. 7 183.6 NM NM 0. 9x - 751
G ravity C o., Ltd 6/30/2009 GR VY Na s daqG M US D S outh K orea 1. 46 40. 6 49. 1 16. 6 33. 9% - - 469
G ree, Inc. 9/30/2009 T S E : 3632 TS E JPY J a pan 4,450 2,227. 9 210.3 122.2 58. 1% 10.1x 17. 4x NA
G ungHo O nline E ntertainment, Inc. 6/30/2009 3765 OS E JPY J a pan 169,000 216. 5 119.5 26. 6 22. 2% 1. 5x 6. 9x NA
HanbitS oft, Inc. 6/30/2009 A047080 K OS E KR W S outh K orea 3,445 63. 2 60. 7 1.4 2.3% 0. 8x 35. 1x NA
IAC /InterActiveC orp. 9/30/2009 IAC I Na s daqG S US D United S ta tes 19. 93 2,630. 2 1, 359. 6 82. 4 6.1% 0. 7x 12. 0x 3, 200
IAS E nergy, Inc. 4/30/2009 IAS A. E OT C B B US D C anada 0. 12 8.5 0. 0 (0.6) NM - - NA
is eemedia Inc. 6/30/2009 IE E T S XV C AD C anada 0. 17 8.2 1. 7 (4.5) NM 4. 7x - NA
J umbuck E nterta inment Limited 6/30/2009 AS X :J MB AS X AUD Aus tralia 0. 33 14. 0 16. 7 7.2 42. 8% 0. 5x 1. 1x 79
K AB Dis tribution Inc. 6/30/2009 T S X :K AB TS X C AD C anada 0 0.6 67. 9 4.0 5.8% - - NA
K ings oft C o. Ltd. 6/30/2009 3888 S E HK HK D C hina 7 1,033. 9 139.1 61. 4 44. 2% 7. 4x 16. 7x 2, 463
Lingo Media C orporation 6/30/2009 T S X V :LM T S XV C AD C anada 0. 99 11. 3 1. 2 (1.9) NM 8. 7x - NA
LiveW orld Inc. 9/30/2009 LVW D OT C P K US D United S ta tes 0. 03 1.0 10. 4 0.4 4.1% - - NA
LookS mart, Ltd. 9/30/2009 L OO K Na s daqG M US D United S ta tes 1. 12 19. 2 54. 0 (4.5) -8.4% - - 90
Magnitude Information S ys tems Inc. 6/30/2009 MAG Y OT C B B US D United S ta tes 0. 02 8.6 0. 1 (2.5) NM - - 14
Mixi, Inc. 9/30/2009 2121 TS E JPY J a pan 642000. 00 1,106. 3 139.6 46. 2 33. 1% 7. 0x 21. 1x NA
Modern T imes G roup Mtg AB 9/30/2009 MT G B OM SEK S weden 335. 00 3,170. 3 2, 002. 6 282.9 14. 1% 1. 9x 13. 1x 2, 969
MO K O .mobi Limited 6/30/2009 MK B AS X AUD Aus tralia 0. 09 8.3 0. 7 (2.4) NM 10.6x - NA
Myriad G roup AG 6/30/2009 MY R N SWX C HF S witzerland 4. 68 200. 7 63. 0 3.4 5.4% 3. 1x - 405
NE O W IZ G ames C orpora tion 12/31/2008 A095660 K OS E KR W S outh K orea 41550. 00 734. 0 207.3 55. 7 26. 8% 3. 5x 13. 0x NA
NetDragon W ebS oft, Inc. 6/30/2009 777 S E HK HK D C hina 5 344. 4 89. 3 25. 7 28. 7% 2. 2x 7. 7x 3, 109
Neteas e. com Inc. 6/30/2009 NT E S Na s daqG S US D C hina 41. 48 5,368. 6 472.4 297.4 63. 0% - - 3, 109
NeuLion Incorporated 6/30/2009 T S X :NLN TS X C AD C anada 0. 72 77. 1 21. 5 (13. 0) -60. 3% 3. 1x - 237
NeXplore C orporation 6/30/2009 NX P C OT C P K US D United S ta tes 1 38. 5 1. 7 (13. 3) NM 25.0x - NA
Ngi G roup Inc. 6/30/2009 2497 TS E JPY J a pan 24000. 00 33. 2 93. 0 6.9 7.4% - - NA
Northgate T echnologies L imited 6/30/2009 590057 BSE INR India 29. 15 21. 2 82. 9 (41. 5) -50. 0% 0. 3x - NA
O pen T ext C orp. 9/30/2009 OT E X Na s daqG S US D C anada 38. 24 2,156. 0 814.5 211.1 25. 9% 2. 7x 10. 5x 3, 900
O penwave S ys tems Inc. 9/30/2009 OP W V Na s daqG S US D United S ta tes 2. 49 208. 0 190.5 6.2 3.3% 0. 5x 16. 6x 590
P erfect W orld C o. , Ltd. 6/30/2009 PWRD Na s daqG S US D C hina 45. 37 2,286. 3 255.6 142.2 55. 6% 0. 8x 1. 4x 2, 096
P NI Digital Media Inc. 6/30/2009 T S X V :P N T S XV C AD C anada 1. 74 54. 7 21. 0 2.3 11. 0% 2. 5x 22. 8x NA
Q uepa s a C orp. 6/30/2009 QP S A OT C B B US D United S ta tes 1 16. 6 0. 2 (10. 6) NM - - 74
O AO R B C Information S ys tems 12/31/2007 R BCI R TS US D R us s ia 1. 60 222. 0 157.4 20. 6 13. 1% 0. 0x 0. 4x NA
S handa Interactive E nterta inment Ltd. 6/30/2009 S NDA Na s daqG S US D C hina 49. 13 3,304. 2 629.0 296.7 47. 2% - - 3, 124
S hutterfly, Inc. 9/30/2009 S FLY Na s daqG S US D United S ta tes 15. 76 404. 6 223.1 27. 0 12. 1% 1. 3x 10. 8x 514
S K C ommunications C o., Ltd. 12/31/2008 A066270 K OS E KR W S outh K orea 7290. 00 255. 8 192.7 12. 5 6.5% 1. 3x 20. 4x NA
S NAP Interactive, Inc. 6/30/2009 S TVI OT C B B US D United S ta tes 0 2.2 3. 5 0.9 27. 0% 0. 2x 0. 6x 11
S NM G loba l Holdings 9/30/2008 S NMN OT C P K US D United S ta tes 0. 00 0.0 2. 0 (0.7) -34. 8% 1. 1x - 33
S ocial Media V entures Inc. 12/31/2008 S MV I OT C P K US D United S ta tes 0 0.0 0. 1 (0.1) -60. 6% 4. 5x - NA
S ocialwis e, Inc. 6/30/2009 S C LW OT C B B US D United S ta tes 0. 51 22. 6 0. 0 (5.6) NM - - NA
S ohu. com Inc. 9/30/2009 S O HU Na s daqG S US D C hina 56. 94 2,189. 7 501.0 218.4 43. 6% 3. 3x 7. 5x 3, 197
S park Networks , Inc. 9/30/2009 L OV AME X US D United S ta tes 3 53. 5 47. 5 10. 0 21. 0% 1. 0x 5. 0x 183
S pectrumDNA, Inc. 6/30/2009 S P XA OT C B B US D United S ta tes 0 7.3 0. 1 (2.5) NM - - 7
T encent Holdings Ltd. 6/30/2009 700 S E HK HK D C hina 148 34, 735.2 1, 391. 6 680.3 48. 9% 27.6x - 6, 421
T he P arent C ompany 8/2/2008 K IDS . Q OT C P K US D United S ta tes 0. 01 0.2 112.0 (13. 5) -12. 0% 0. 2x - 347
T he9 Limited 12/31/2008 NC T Y Na s daqG S US D C hina 7. 41 185. 9 250.6 85. 5 34. 1% - - 1, 626
T heS treet. com, Inc. 3/31/2009 TS CM Na s daqG M US D United S ta tes 2. 48 75. 9 67. 0 1.9 2.9% 0. 2x 5. 8x 310
T ree.C om, Inc. 9/30/2009 TR E E Na s daqG M US D United S ta tes 7. 30 79. 6 217.1 9.7 4.5% 0. 2x 5. 5x 700
Unis erve C ommunica tions C orp. 8/31/2009 T S X V :US S T S XV C AD C anada 0. 04 0.8 16. 1 0.1 0.9% 0. 3x 36. 4x NA
United O nline Inc. 9/30/2009 UNT D Na s daqG S US D United S ta tes 8. 22 695. 3 996.8 214.9 21. 6% 1. 0x 4. 4x 1, 469
UOMO Media, Inc 7/31/2009 UO MO OT C B B US D C anada 0 5.9 0. 8 (0.4) -54. 2% 8. 0x - NA
V alueC lick Inc. 9/30/2009 V C LK Na s daqG S US D United S ta tes 10 882. 4 545.7 130.8 24. 0% 1. 3x 5. 5x 1, 189
V OIS , Inc. 6/30/2009 V O IS OT C B B US D United S ta tes 0 5.5 0. 0 (1.0) NM - - 4
W ebzen Inc. 6/30/2009 W ZE N Na s daqG M US D S outh K orea 2. 96 35. 1 23. 2 2.3 9.9% - - 328
W izzard S oftwa re C orporation 6/30/2009 W ZE AME X US D United S ta tes 0. 49 24. 6 5. 3 (4.5) -84. 9% 4. 8x - 110
W orlds . com Inc. 6/30/2009 W DDD OT C B B US D United S ta tes 0. 10 5.2 0. 1 (0.7) NM - - 1
W ynds torm C orpora tion NA W Y ND OT C P K US D United S ta tes 0. 10 1.8 NA NM NM - - NA
XING AG 6/30/2009 O 1B C XT R A E UR G ermany 32. 70 252. 5 58. 9 17. 0 28. 8% 3. 4x 11. 8x 246
Y D O nline C orp. 12/31/2007 A052770 K OS E KR W S outh K orea 6520. 00 82. 0 57. 4 12. 4 21. 6% 1. 6x 7. 3x NA
Y nk K orea Inc. 12/31/2008 A023770 K OS E KR W S outh K orea 4380. 00 19. 6 11. 9 1.3 10. 5% - - NA
High 34, 735.2 2,002. 6 680. 3 63. 0% 47.2x 36. 4x 6, 421
Low 0.0 0. 0 -84.0 -98. 9% - - 1
Average 808.7 163.0 39.4 6.3% 5.1x 11.1x 945
Median 40. 5 55.7 1. 7 11. 6% 1. 6x 7. 8x 246
Figure 1. Web 2.0 Universe Summary
Source. Capital IQ
3. Page 3
C A P I T A L M A R K E T S A C T I V I T Y (M & A A N D F I N A N C I N G )
November picks up: Total transaction value in the W eb 2.0 universe for November is $131.9 million. November has shown
improvement with number of financings up to 14 averaging $9.4 million each (vs. an average of $7.4 million last week). In
comparison, total capital raised in October was $171.3 million, averaging $6.3 million (27 deals); September was $232.8
million, averaging $9.0 million (26 deals); and August was $221.6 million, averaging $7.6 million (29 deals).
Financing Activity Last Twelve Months
400.0 16.0
14.6
350.0 14.0
300.0 12.0
11.1
250.0 9.4 10.0
9.0
(US$m)
(US$m)
200.0 7.6 8.0
7.1
6.7 6.6
6.5 6.3
6.2
150.0 5.6 6.0
4.9
100.0 4.0
50.0 2.0
0.0 0.0
Nov-08 Dec-08 Jan-09 Feb-09 Mar-09 Apr-09 May-09 Jun-09 Jul-09 Aug-09 Sep-09 Oct-09 Nov-09
*May-09 includes $200m FB investment Total Average
Figure 2. Financings, Last Twelve Months
Source. Company reports
4. Page 4
eal round-up for November start: The large deal highlights for the month include:
• Playfish – the UK-based social gaming company – was acquired by Electronic Arts in a deal potentially valued up
to $400 million.
• Playfire – the social gaming company – raised $43 million in its first round of venture financing.
• Sezmi – maker of set top box tech – raised $25 million in a third round of VC funding.
• Motley Fool – the financial information site – raised $25 million in an unattributed financing.
• Phoenix New Media – the subsidiary of Phoenix Television, a popular Chinese news portal and media site – raised
$25 million from Intel Capital and Bertelsmann Asia Investment Fund.
All other deals in the month were in the amount of $10 million or less. For additional details on financings, see Figures 23
and 24 (at end of note).
Financing & M/A Summary - Last Three Months
200.0
180.0
160.0
140.0
120.0
Nov-09
(US$m)
100.0 Oct-09
Sep-09
80.0
60.0
40.0
20.0
0.0
Phoenix New Media
Motley Fool
DailyMotion
Millennial Media
Jive Software
Mzinga
InXpo
NextBio
Reality Mobile
HiveLive
Aviary
AppNexus
Mocapay
Fwix
Vantrix
Fizzback
Linkedex
Twitter
Yext
Box.net
Skype
PlayFish
Evernote
Ooyala
Jobvite
wooga
Eventbrite
YuMe
Booyah
Overtone
Playfire
Greystripe
DailyBooth
OnLive
NowPublic
Ecast Network
Livebookings
Alliance Health Networks
MashLogic
Tiny Pictures
DataSync
Dopplr
Unisfair
Fluther
Scoopler
VEVO
Mint
HubSpot
StatusNet
Aurora Feint
Sezmi
Technorati
Ensequence
Engine Yard
CubeTree
Vuclip
Vdopia
NeoEdge
Credit Karma
ViVu
Blekko
Godengo
Loomia
FourSquare
EduFire
Onehub
Hot Potato
IngBoo
Chango
Listia
Altruik
Scout Labs
Conduit Labs
Adfonic
Playdom
FeedRoom
Alice.com
Prosper.com
Spigit
ScanScout
Amie Street
TransGaming Inc.
PopCap Games
Riot Games
Sometrics
Imeem
Gamelab.com
Watercooler
Figure 3. Capital Market Activity, Last Three Months
Source. Company reports
5. Page 5
Social Networks the most active sector: Social Networks experienced the most financing activity among our W eb 2.0
sector categories in the past three months by number of transactions (9). Collaboration-related companies have been hot
recently, garnering the second highest number of deals (7). Advertising continues to be among the highest activity sectors
in the past quarter (7 deals) (Figure 4). The $2.0 billion acquisition of Skype skews the dollars transacted to the
SMS/Voice segment, while the $400 million acquisition of Playfish brings the Virtual W orlds segment to the second highest
total. Finally, the $170 million acquisition of Mint brings the Vertical Communities segment into third place.
Capital Market Activity by Sector - Last Three Months
200.0
180.0
160.0
140.0
120.0
(US$m)
100.0
80.0
60.0
40.0
20.0
2,025.0 417.1 178.3 100.9 93.3 87.0 57.0 51.4 45.5 44.9 37.5 30.0 25.6 18.6 17.2 16.2 13.0 10.0 9.9 6.4 6.0 4.0 3.6 2.2 1.5 1.3
0.0
Comment/Reputation
Social Commerce
Communities
Gaming
Documents
Microblog
Media
Collaboration
Enterprise
Mobile
Publishing
Online Learning
Music
Financial Services
SMS/Voice
Infrastructure
Search
Mobile Ad
Classified
Social Networks
Virtual World
Video
Advertising
Crowdsourced
Aggregation
Analytics
Vertical
Content
# companies
1 4 2 2 6 6 3 9 7 7 3 4 2 3 2 5 4 1 2 2 1 3 2 1 1 1
Figure 4. Capital Market Activity, by Sector, Last Three Months
Source. Company reports
6. Page 6
C A P I T A L M A R K E T S A C T I V I T Y (P R I C E P E R F O R M A N C E )
Web 2.0 index continues to outpace NASDAQ recovery: Our W eb 2.0 index (market-cap weighted) essentially mirrored
the performance of the NASDAQ composite index from mid-2008 until Q1/09. Since then, the index has diverged in a much
stronger recovery relative to the NASDAQ index (Figure 5).
Web 2.0 Index Price Performance
250
200
150
100
50
0
11/17/2008
12/1/2008
12/15/2008
12/29/2008
1/12/2009
1/26/2009
2/9/2009
2/23/2009
3/9/2009
3/23/2009
4/6/2009
4/20/2009
5/4/2009
5/18/2009
6/1/2009
6/15/2009
6/29/2009
7/13/2009
7/27/2009
8/10/2009
8/24/2009
9/7/2009
9/21/2009
10/5/2009
10/19/2009
11/2/2009
11/16/2009
Index: Web 2.0 (Market Cap) ^COMP - Share Pricing
Figure 5. Web 2.0 Price Performance
Source. Capital IQ
7. Page 7
Market pull-back: Sixteen companies in our universe had positive stock price performances over the past week (for
stocks with prices greater than $1) (Figure 6), while 30 companies showed negative 1-week returns.
1 Week P rice P erformance
Openw ave S y s tems Inc. 15.8%
G igaMedia Ltd. 14.1%
Y nk K orea Inc. 9.0%
Tencent Holdings Ltd. 6.7%
A ctoz S of t Co., Ltd. 6.5%
NEOWIZ Games Corporation 5.9%
Changy ou.com Limited 4.1%
Modern Times G roup Mtg A B 3.7%
G amania Digita l Entertainment 3.2%
Chines e Gamer International 3.0%
S K Communications Co., Ltd. 2.0%
IA C/InterA ctiveCorp. 1.6%
S hutterfly , Inc. 1.4%
XING A G 1.2%
TheS treet.com, Inc. 1.2%
CDC Corp. 0.8%
Fluid Mus ic Cana da, Inc. 0.0%
Eolith Co. Ltd. 0.0%
V alueClick Inc. -1.0%
PNI Digital Media Inc. -1.1%
Neteas e.com Inc. -1.2%
United Online Inc. -1.3%
S ohu.com Inc. -1.6%
NetDragon WebS of t, Inc. -1.9%
Open Tex t Corp. -2.0%
My riad Group A G -2.3%
S handa Interactive -2.5%
S park Netw orks , Inc. -2.6%
Frogs ter Interactive Pictures -3.3%
Cy berplex Inc. -3.6%
DA DA S pA -3.6%
Giant Interac tive G roup, Inc. -3.7%
HanbitS of t, Inc. -3.8%
K ings of t Co. Ltd. -3.8%
Webz en Inc. -4.2%
LookS mart, Ltd. -4.3%
G ameOn Co Ltd. -5.4%
Northgate Technologies Limited -5.5%
The9 Limited -6.0%
Tree.Com, Inc. -6.2%
G ravity Co., Ltd -7.0%
Quepas a Corp. -7.1%
Perfect World Co., Ltd. -7.6%
Y D Online Corp. -8.4%
Ngi G roup Inc. -9.8%
Mix i, Inc. -13.2%
A Q Interactive, Inc. -15.6%
G ree, Inc. -17.7%
-0.2 -0.15 -0.1 -0.05 0 0.05 0.1 0.15 0.2
Figure 6. 1-Week Price Performance
Source. Capital IQ
8. Page 8
P U B L I C C O M P A N Y I N D U S T R Y N E W S (P A R T N E R S H I P S , F I N A N C I A L R E S U L T S , N E W P R O D U C T S )
K ey Developments
C ompany Headline Notes
DigitalFX International, Inc . DigitalF X Interna tiona l, Inc. has a nnounced tha t it ha s filed a F orm 15 with the S ecurities a nd E xcha nge C ommis s ion to
(OTC B B : DG FX) Digita lF X Interna tional F iles F orm 15 volunta rily deregis ter its common s tock under the S ecurities E xcha nge Act of 1934, a s a mended. T he par va lue of the
common s tock is $0. 001 per s ha re.
Hunan TV & B roadc as t Intermediary S ha nda Intera ctive E nterta inment L td. a nd Huna n T V & B roa dca s t Intermedia ry C o. L td. ha ve partnered to launch a joint
C o., L td. (S ZS E : 000917); S handa venture. S ha nda will inves t $100 million in the new J V , for which L ong will be a ppointed chief opera ting officer (C E O ). No
Interac tive E ntertainment L td. S ha nda Interactive E ntertainment, Huna n T V to L a unch J oint V enture officia l la unch da te ha s been dis clos ed.
(Nas daqG S : S NDA)
Quepas a C orp. (OTC B B : QP S A) Quepa s a C orp. a nnounced the forma tion of a cros s -functiona l tea m dedica ted to e-ma il ma nagement a nd delivera bility. As
pa rt of this initiative, the company hired T ony P a tti a s Director of Delivera bilty. T ony is a recognized lea der in the field of e-
ma il delivera bility. W ith a record of s ucces s s pa nning over a deca de, T ony ha s developed focus ed, cus tomized deliverability
Quepas a C orp. Appoints T ony P a tti a s Director of Delivera bilty s olutions for s uch bra nds a s T ra velocity.com a nd T rue.com, helping them a chieve unprecedented delivery-to-inbox ra tes . As
a n expert in e-ma il ma rketing, IS P rela tions , a nd the la tes t in indus try trends a nd s ta ndards , T ony's delivera bility s tewa rds hip
ens ures tha t Quepas a's vita l ma rketing inves tment pa ys -ins tea d of being los t in s pa m filters .
Open Text C orp. (Nas daqG S : OTE X) Open T ext C orp. announced tha t it ha s developed enterpris e fa x functiona lity s ea mles s ly integra ted with Micros oft E xcha nge
S erver 2010. T his ens ures that enterpris es ca n migra te to E xcha nge S erver 2010, pres erve their inves tments in network-
ba s ed fa x ca pa bility and unified mes s a ging s ys tems and provides the ability to a cces s faxing from mobile devices . Open
T ext is a Micros oft G old C ertified P a rtner a nd 2009 IS V L ine of B us ines s P artner of the Y ea r fina lis t. F a xing continues to be
a critica l requirement for many bus ines s es tha t need s igna tures , dra wings , a nd other pa per-bas ed content. In indus tries a nd
bus ines s es s uch a s ba nking, hea lthca re, mortga ge compa nies , and patent offices , fa xes a re recognized a s importa nt lega l
documents a nd vita l to bus ines s opera tion. W ith O pen T ext F a x S erver, R ightF ax E dition a nd E xcha nge S erver 2010, faxing
becomes an integra l pa rt of the overall enterpris e infra s tructure, providing a s trong return on inves tment a nd reducing or
elimina ting the need for phys ical fa x ma chines .
Micros oft E xcha nge S erver 2010 is now a va ila ble for bus ines s es worldwide a nd will help orga niza tions reduce cos ts ,
protect communica tions a nd improve us er productivity. Open T ext F a x S erver is well-proven in the ma rketpla ce a nd
it gives cus tomers a fa x s olution tha t s ea mles s ly connects with E xcha nge S erver 2010 Unified Mes s a ging. W orking
Open T ext C orp. Develops E nterpris e F a x F unctiona lity S ea mles s ly Integra ted with Micros oft E xcha nge S erver 2010
clos ely with Micros oft, the compa ny developed the E xcha nge C onnector for E xchange S erver 2010, which routes
fa xes into a nd out of the E xcha nge S erver 2010 s ys tem us ing O pen T ext F a x S erver, R ightF a x E dition, a s olution
offered a s part of the Open T ext E C M S uite. W hen a fa x comes into a n enterpris e, E xcha nge S erver 2010 Unified
Mes s a ging forwa rds it to the O pen T ext F a x S erver, which proces s es the document s o it ca n be tra ns mitted to a nd
viewed within Micros oft O ffice Outlook a s a na tive fa x mes s a ge. It then routes the fa x through E xcha nge S erver to
the recipient's Outlook inbox. T he origina l fa x a ppea rs a s a n e-mail a tta chment tha t a us er ca n s elect a nd view. Us ers
ca n a ls o s end e-ma il mes s a ges and a tta chments to the F ax S erver from their Outlook inbox for fa xing to recipients
outs ide the enterpris e. A s ignifica nt adva nta ge of Open T ext F a x S erver, is tha t fa xes a re digita lly protected, helping to
prevent los s or a uthorized viewing of documents . L ogging a nd a uditing fea tures provide the a bility to review a nd tra ck
a ll fa xes from s ender to recipient.
VOIS , Inc . (OTC B B : VOIS ) V OIS Inc. a nnounced plans to introduce its Apple iP hone a pplica tion during the firs t quarter of 2010. T he new a pp is to be
des igned to ena ble members of V OIS to ea s ily pos t projects , bid on projects , a nd s ocia lize the s a me wa y they currently do
V OIS Inc. P la ns to Introduce Apple iP hone App During the F irs t Qua rter of 2010 on the V OIS web pla tform, but cus tomized to iP hone s pecifica tions . In a dva nce of the iP hone a pp V O IS is offering a V OIS
webclip. T his will open up 3 buttons .
Figure 7a. Key Developments
Source. Capital IQ
9. Page 9
K ey Developments
C ompany Headline Notes
IAC /InterAc tiveC orp. (Nas daqG S : IAC I) IAC /InterA ctiveC orp. a nnounced tha t J oey Levin, currently IA C 's S enior V ice P res ident, Mergers & Acquis itions and
F inance, ha s been na med C hief E xecutive Officer of Minds pa rk Intera ctive Network. S ha na F is her, currently S V P , Mergers
IA C /InterActivecorp. Announces E xecutive C hanges & A cquis itions a nd S tra tegy of IA C will a s s ume J oey's M& A res pons ibilities in a ddition to her own. C urrent V ice P res ident of
IAC F ina ncial P la nning & Ana lys is Ma rk S chneider will a s s ume J oey's fina nce res pons ibilities , reporting to E V P a nd C F O
T om McInerney.
R evyver, L L C ; S pec trumDNA, Inc . S pectrumDNA , Inc. (OT C B B : S P XA ) s igned a letter of intent to a cquire R evyver on November 10, 2008. T he fina ncia l terms
(OTC B B : S P XA) S pectrumDNA, Inc. (O T C B B : S P XA) ca ncelled the a cquis ition of R evyver. of the trans a ction were not dis clos ed. A fter the tra ns a ction R evyver will opera te a s s ubs idia ry of S pectrumDNA , Inc.
S ocialwis e, Inc . (OTC B B : S C L W ) On November 9, 2009, S ocia lwis e, Inc. has entered into a n a mendment of the 12% S enior Note between the compa ny a nd
G emini Ma s ter F und, L td. da ted Ma rch 31, 2009. T he a mendment cha nged the prior requirement under the Note for
ma nda tory ea rly repa yment to the following: T he compa ny will ma ke a ca s h pa yment of $250, 000 to the Holder on or before
November 20, 2009 (in a ddition to the $25, 000 pa id by the compa ny on or a bout November 3, 2009) a nd a n a dditional ca s h
Socialwise, Inc. Enters Amendment of the 12% Senior Note pa yment to the Holder of $100,000 on or before December 15, 2009. If the compa ny s ucces s fully ma kes both of the
previous two pa yments , then the compa ny, in its s ole dis cretion, ma y extend the ma turity da te until F ebrua ry 28, 2010 in
cons idera tion for 75, 000 s ha res of common s tock, provided tha t there is no brea ch or default or event of defa ult under this
Note.
DigitalFX International, Inc . DigitalF X Interna tiona l, Inc’s common s tock ha s been deleted from O T C B ulletin B oa rd effective November 11, 2009 on
(OTC B B : DG FX)
DigitalFX International Deleted From OTCBB a ccount of its filing form 15. T he compa ny ha s been a dded other NB B .
C yberplex Inc . (TS X: C X) Cyberplex Inc. Announces Unaudited Consolidated Financial Results for the Third Quarter and C yberplex Inc. a nnounced una udited cons olida ted fina ncia l res ults for the third quarter a nd nine months ended S eptember
30, 2009. F or the qua rter, the compa ny reported revenue of $28.2 million was a n increa s e of 156% over the $11. 0 million
genera ted during the s a me period a yea r a go. T his growth res ulted from the performa nce of the W eb A dvertis ing divis ion
a nd by focus ing on k ey bus ines s vertica ls a nd through interna tiona l ma rket expa ns ion. C omprehens ive income was
$919,996 or $0. 01 per ba s ic a nd diluted s ha re compa red to comprehens ive income of $633,167 or $0. 01 per ba s ic a nd
diluted s ha re a year ago. Income before a mortiza tion of capita l a s s ets a nd inta ngible a s s ets wa s $1, 067,274 compa red to
$752,513 a yea r a go. Income from opera tions wa s $954, 984 compa red to $645, 003 a yea r a go. Net income wa s $712, 371
compa red to $633, 167 a yea r a go.
Nine Months Ended September 30, 2009
C yberplex Inc . (TS X: C X) Cyberplex Inc. Reports Unaudited Consolidated Financial Results for the Third Quarter and C yberplex Inc. reported una udited cons olidated fina ncia l res ults for the third qua rter a nd nine months ended S eptember 30,
2009. F or the qua rter, the compa ny reported income before taxes of $1. 0 million aga ins t $0.6 million for s a me period a yea r
a go. E a rnings before a mortization, interes t, ta xes a nd foreign excha nge was $2. 7 million or 4 cents per s ha re.
F or nine months , the compa ny reported income before ta xes of $6.2 million a ga ins t $0. 9 million for s a me period a yea r a go.
Nine Months Ended September 30, 2009
NeuL ion Incorporated (TS X: NL N) NeuLion Incorporated Reports Unaudited Condensed Consolidated Earnings for the Third NeuL ion Incorporated reported unaudited condens ed cons olida ted ea rnings for the third qua rter a nd nine months ended
S eptember 30, 2009. F or the qua rter, the compa ny reported opera ting los s of $5, 408, 414, net los s a nd comprehens ive los s
of $7, 463, 951 or $0. 07 per bas ic a nd diluted s ha re on revenue of $6, 061, 302 a gains t opera ting los s of $1, 352, 218, net los s
a nd comprehens ive los s of $1, 377, 667 or $0. 03 per bas ic a nd diluted s ha re on revenue of $2,699, 041 for the s a me period a
year ago. C as h provided by opera ting a ctivities wa s $1,937, 748 a gains t $49, 431 for the s ame period a yea r a go. P roperty,
pla nt and equipment expenditures were $362,108 a ga ins t $182, 918 for the s a me period a year ago.
F or the nine months , the compa ny reported opera ting los s of $15,513, 615, net los s a nd comprehens ive los s of $18,185, 960
or $0.16 per ba s ic a nd diluted s ha re on revenue of $19,097,767 a ga ins t opera ting los s of $3,411, 255, net los s a nd
comprehens ive los s of $4, 413, 792 or $0.10 per ba s ic and diluted s hare on revenue of $7,635,789 for the s ame period a yea r
a go. C a s h provided us ed in opera ting a ctivities wa s $7,186, 903 a ga ins t $148,559 for the s a me period a yea r a go. P roperty, p
Quarter and Nine Months Ended September 30, 2009
Tencent Holdings L td. (S E HK : 700) T encent Holdings L td., B oa rd Meeting, Nov 11, 2009 Agenda : T o a pprove the una udited third qua rter res ults a nd
Tencent Holdings Ltd., Board Meeting, Nov 11, 2009 a nnouncement of the compa ny a nd its s ubs idiaries for the three a nd nine months ending 30 S eptember 2009 a nd
cons idering the pa yment of a dividend, if a ny.
is eemedia Inc . (TS XV: IE E ) is eemedia Inc. a nnounced tha t it ha s begun deployment of a n S MS -ba s ed pus h-ma il s ervice with T ata Indicom a nd T a ta
Docomo, the C DMA and G S M offering res pectively of T a ta T eles ervices L td. T he commercia l la unch is expected to be
iseemedia Inc. Provides SMS-Based Push-Mail Service to Tata Indicom and Tata Docomo completed by November 2009. T he cons umer ema il will join enterpris e ema il as a s ta nda rd s ervice on mobile devices in the
coming years . T T S L is pos itioning this s ervice to ca pture a s izea ble s ha re of the ra pidly growing us er s egment us ing On-T he-
G o ema il s ervices , us ing the is eemedia s olution.
Tencent Holdings L td. (S E HK : 700) Tencent Holdings Ltd. Reports Unaudited Consolidated Earnings Results for the Third Quarter T encent Holdings L td. reported una udited cons olida ted earnings res ults for the third qua rter ended S eptember 30, 2009. F or
the qua rter, the company reported tota l revenues were R MB 3, 368.9 million (US D 493. 3 million), a n increa s e of 17. 0% over
the s econd qua rter of 2009 or a n increas e of 66. 4% to R MB 2, 024. 5 million for the third qua rter of 2008. O perating profit wa s
R MB 1, 680. 3 million (US D 246. 1 million), an increas e of 20. 1% qua rter on qua rter or an increas e of 107. 3% yea r on yea r
compa red to R MB 810.5 million for the s a me qua rter a yea r a go. P rofit a ttributable to equity holders of the compa ny wa s
R MB 1, 419. 9 million (US D 207. 9 million), an increas e of 19. 1% qua rter on qua rter or an increas e of 92. 6% year on yea r or
R MB 0. 767 per diluted s ha re compa red to profit a ttributa ble to equity holders of the compa ny of R MB 737. 1 million or R MB
0. 400 per diluted s ha re for the s a me qua rter a yea r a go. P rofit before income ta x wa s R MB 1,683 million compa red to R MB
802.4 million for the s a me qua rter a yea r a go. C a pita l expenditure was R MB 269. 1 million for the third qua rter of 2009 a s
compa red with R MB 191.3 million for the previous qua rter.
Ended September 30, 2009
Openwave S ys tems Inc . Openwa ve S ys tems Inc. a nnounced the Openwa ve(R ) Mobile Internet R ea dyS et, a low-cos t, prepa cka ged pla tform tha t
(Nas daqG S : OP WV) provides opera tors with a centra l point from which to offer new, revenue genera ting, mobile internet s ervices . Openwa ve will
demons tra te its R ea dyS et s olution, a s well a s its la tes t mobile internet, mes s aging a nd loca tion s oftwa re a pplica tions a nd
infras tructure a t A frica C om C ongres s & E xhibition loca ted in C a pe T own, S outh Africa on November 11-12, 2009.
Openwa ve's R ea dyS et provides a complete mobile internet s olution cons is ting of tra ffic ma nagement tools including content
Openwave Introduces Mobile Internet Readyset Solution for Operators in Emerging Markets a da pta tion and a cceleration, ba ndwidth optimis ation, and s ervice promotion and billing, in a s ingle pa cka ge. W ith very low-
cos t hardwa re a nd s ta ndard pre-configured deployment options , R ea dyS et is idea l for s ma ller operators a nd newer ma rkets
which require a quick return on inves tment for minima l ca pita l outla y. Additiona lly, R ea dyS et is s ca la ble a nd will expand to
meet s ubs criber growth a nd dema nds both in terms of increa s ed numbers a nd increa s ed us er expecta tion.
Tencent Holdings L td. (S E HK : 700) Tencent Holdings Ltd., Q3 2009 Earnings Call, Nov-11-2009 T encent Holdings L td., Q3 2009 E a rnings C a ll, Nov-11-2009
S hutterfly, Inc . (Nas daqG S : S FL Y) Shutterfly, Inc. - Conference Presentation Call S hutterfly, Inc. - C onference P res enta tion C a lls
Tencent Holdings L td. (S E HK : 700) Tencent Holdings Ltd. Reports Unaudited Consolidated Earnings Results for the Nine Months T encent Holdings L td. reported una udited cons olida ted earnings res ults for the nine months ended S eptember 30, 2009. F or
the nine months , the compa ny reported profit of R MB 3, 688. 56 million a nd profit attributa ble to equity holders of the
compa ny was R MB 3, 647. 70 million or R MB 1.980 per s ha re on revenues of R MB 8,751. 69 million compa red to profit of
R MB 1, 939. 50 million a nd profit attributa ble to equity holders of the compa ny wa s R MB 1, 915.480 million or R MB 1.040 per
s ha re on revenues of R MB 5,057,163 million for the s a me period a yea r a go. P rofit before income ta x wa s R MB 4,254. 91
million compa red to R MB 2, 168. 06 million for the s a me period a yea r a go. Opera ting profit wa s R MB 4, 243.83 million
compa red to R MB 2, 313. 12 million for the s a me period a yea r a go. Net ca s h flows genera ted from opera ting a ctivities wa s
R MB 5, 741. 80 million compared to R MB 2, 087.18 million for the s a me period a yea r a go.
Ended September 30, 2009
C yberplex Inc . (TS X: C X) Cyberplex Inc., Q3 2009 Earnings Call, Nov-12-2009 C yberplex Inc. , Q3 2009 E a rnings C a ll, Nov-12-2009
G olden E agle B roadc as ting; S handa S ha nda Intera ctive E nterta inment L td. a nd G olden E agle B roa dcas ting (G B S ) a nnounced s trategic coopera tion in S hangha i
Interac tive E ntertainment L td. on November 12, 2009. Under the a greement, S ha nda a nd G B S will s et up a joint venture with a n inves tment of C N Y 600
(Nas daqG S : S NDA) Shanda Interactive Entertainment Ltd. and Golden Eagle Broadcasting to Set Up Joint Venture million. T he venture will be enga ged in film a nd T V pla yer ma king, dis tribution, a nd other rela ted s ervices . T he coopera tion
with G B S ena bles S ha nda to ma ke inroa ds into the film s ector, a pa rt from bus ines s es like online ga mes , litera ture, a s well
a s mus ic.
DigitalP os t Interactive, Inc . DigitalP os t Intera ctive Inc. announced the s igning of a contra ct with T he P icture P eople Inc. T his pa rtners hip will expa nd
(OTC B B : DG L P ); The P icture P eople, DigitalP os t's dis tribution cha nnel a long with providing potential revenue growth. P icture P eople plans to enha nce its online
Inc . pres ence by a dapting a nd re-bra nding Digita lP os t's fa mily webs ite pla tform for their cus tomer ba s e. T his new platform
DigitalPost Interactive Signs Agreement with the Picture People, Inc provides a s tunning vis ual dis pla y a nd eas y-to-us e a dminis tra tion fea tures tha t will ena ble T he P icture P eople to enter new
ma rkets with Digita lP os t's a ward winning photo/video-s haring technology.
Figure 7b. Key Developments – continued
Source. Capital IQ