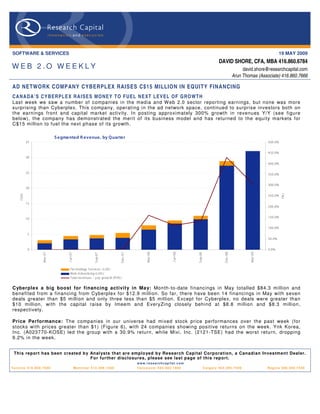
Last week we saw a number of companies in the media and Web 2.0 sector reporting earnings, but none was more surprising than Cyberplex. This company, operating in the ad network space, continued to surprise investors both on the earnings front and capital market activity. In posting approximately 300% growth in revenues Y/Y (see figure below), the company has demonstrated the merit of its business model and has returned to the equity markets for C$15 million to fuel the next phase of its growth.
Month-to-date financings in May totaled $84.3 million and benefited from a financing from Cyberplex for $12.9 million. So far, there have been 14 financings in May with seven deals greater than $5 million and only three less than $5 million. Except for Cyberplex, no deals were greater than $10 million, with the capital raise by Imeem and EveryZing close behind at $8.8 million and $8.3 million, respectively. The companies in our universe had mixed stock price performances over the past week (for stocks with prices greater than $1) (Figure 6), with 24 companies showing positive returns on the week. Ynk Korea, Inc. (A023770-KOSE) led the group with a 30.9% return, while Mixi , Inc. (2121-TSE) had the worst return, dropping 9.2% in the week.
The document summarizes activity in the Web 2.0 sector for April 2009. It notes that April saw the fewest financings of any month that year, totaling $144.5 million across 21 deals. However, Disney's investment in Hulu was a strategic move bringing three major media companies together in online video distribution. The document also highlights that the video sector saw the most capital raised over the prior three months, which could indicate future trends.
The San Jose Mine in Mexico is Fortuna Silver Mines' flagship asset. It is an underground silver and gold mine located in the Taviche Mining District of Oaxaca, Mexico. Fortuna owns 100% of the mine, which has proven and probable reserves of over 20 million ounces of silver and 170,000 ounces of gold based on over 3 million tonnes of ore. Fortuna plans to continue brownfields exploration around the existing mine to evaluate anomalies and expand resources and reserves.
Land and Home(s) No Longer Four Letter Words?Allen Matkins
The document discusses trends in the real estate development and new home market. It provides the following key points:
1. The new home market is recovering from the housing crisis as excess supply is worked through the system and new construction has stopped for five years, while economic fundamentals are improving.
2. Job growth is strong in many states including California, Texas, and Florida. The San Jose and Washington D.C. metro areas have the highest number of job postings per capita. California employment is growing fastest in professional and business services and health care.
3. Single family permits in California are rising again after hitting a low point during the recession but remain well below historical averages, indicating the new home market
The document summarizes renewable energy and energy efficiency investment opportunities in Morocco. Morocco imports a large portion of its energy needs and aims to reduce its dependence on imports through developing renewable sources like wind and solar. Morocco has significant potential for wind and solar energy due to its unique location and climate. The country also has a goal of reducing energy consumption 12% by 2020 through national energy efficiency programs focused on industry, transport, and residential sectors.
The document contains charts and graphs showing trends in diesel fuel costs and surcharges from 2002 to 2010. It shows that the average cost of diesel fuel peaked in 2008 at over $4.75 per gallon before declining. It also shows fuel surcharge percentages for air and trucking industries ranging from 14-21% depending on the carrier. Bunker fuel costs for transpacific shipping routes peaked in July 2008 at over $800 per metric ton before falling.
This document summarizes mobile device usage trends in Europe based on data from comScore. It finds that smartphone adoption continues to rise rapidly, with Android becoming the second most popular platform behind Symbian. Tablet usage is also growing, with over 6% of mobile phone owners also using a tablet. Usage patterns show PCs are still dominant for internet access but mobile and tablets are growing. Tablet usage peaks in the evenings while mobile peaks align with commuting hours.
This document contains graphs and charts with meteorological data predictions for Carcavelos, Portugal over a 3 day period from November 11th to November 14th. The data includes predictions for wave height, period and quality for surfing as well as tide height, precipitation, temperature, wind speed and direction, cloud cover and other atmospheric conditions.
The document discusses opportunities and challenges for achieving nutrition security in low and middle income countries. It finds that while stunting in children under 5 has decreased from 44% to 29% between 1990 and 2010, 171 million children are still stunted. Overweight in children is also increasing steadily. There has been slow progress in reducing micronutrient deficiencies and low birth weight. Undernutrition and overnutrition can coexist in the same country, individual, and even household. Improving nutrition is important as malnutrition impacts cognitive development, economic productivity, and overall societal and economic costs. To accelerate progress in nutrition, countries need to focus on prevention during the first 1000 days of life from conception to 24 months, invest in nutrition-specific and nutrition
- November saw an increase in financing activity for Web 2.0 companies, with 14 deals totaling $131.9 million, up from previous months. The average deal size was $9.4 million.
- Of the 89 public Web 2.0 companies tracked, 16 saw positive 1-week stock returns while 30 saw negative returns.
- The document analyzes valuation metrics for several Web 2.0 companies, finding average valuations of 5.1x trailing revenue and 11.1x trailing EBITDA across the sector.
- Dell was able to generate over $3 million in sales over the last two years from exclusive promotions and coupons tweeted from its @DellOutlet Twitter account. It gained 620,000 followers and over $1 million in sales in the last six months alone.
- While the $3 million is small compared to Dell's annual revenue of $61 billion, Twitter provides another channel for Dell to quickly sell returned inventory.
- There is discussion of whether Twitter may generate revenue through premium corporate accounts that use Twitter for direct sales, as Dell has demonstrated.
This report identifies 77 public Web 2.0 companies and provides an overview and analysis. The average market cap is over $300 million with average revenue over $100 million. The companies are profitable with an average EBITDA margin of 18.4%. Valuation metrics like average trailing revenue of 3.8x and EBITDA of 8.6x are provided. Recent financing activity, including 20 financings in January totaling $139.6 million, is also summarized.
Financing activity continued to ramp up in April after a slow start to the month. Total financings (month-to-date) jumped to $92.2 million (this week) from $66.3 million (last week) – a significant +40%. As of last week, a total of 12 deals closed, with a $16 million raise by GOOM Radio being a major contributor. A total of four deals greater than $10 million each helped the overall statistics. Social Networking company DigitalTown Inc. (DGTW-OTCBB) was the top price performer for the week, returning 20%, closely followed by Kingsoft Co. Ltd. (3888-EHK) at 17.6%. The9 Ltd. (NCTY-NasdaqGS) had the worst return, dropping 27.6% in the week after news of its losing the license to operate World of Warcraft in China. Of the 34 companies (with stock price greater than $1), 10 companies on our list had price performances greater than +10%. Only one company returned more than
20%.
This document discusses Twitter's recent increase in valuation from $250 million to $1 billion despite only a modest increase in the valuation per unique visitor, from $29 to $42. It also provides an overview of deal flow and stock performance in the broader Web 2.0 sector, noting an increase in transaction value and positive stock returns for most companies covered. The document concludes with background on the Research Capital Web 2.0 universe of 90 public companies with a combined $69 billion market cap.
The document summarizes a report on 80 public Web 2.0 companies. It finds that the companies have a combined market cap of almost $25 billion and include a variety of sectors like gaming, social networking, and media sharing. On average, the companies have a market cap over $300 million and annual revenue of $100 million. They also have high profitability with an average EBITDA margin of 17.6%. The report provides analysis of these companies' recent financing activities, industry news, and valuation metrics.
This presentation by Embraer Defense and Security discusses its vision, mission, results, and future plans. It includes forward-looking statements about financial trends that could affect performance. While revenues and backlog have grown significantly in recent years, future results may differ from expectations due to economic or geopolitical risks. The presentation outlines Embraer Defense's strategic focus on developing defense and security solutions for Brazil and partner countries.
This document shows that bearish sentiment among individual investors, as measured by the American Association of Individual Investors survey, reached high levels in 2002, 2004, 2005, and 2009. However, in each of those periods except 2009, the S&P 500 rose over the following six months, suggesting high bearish sentiment may predict future stock price increases. The JSCO Pain Index, which measures stock market volatility, is also relatively low currently.
This document shows that bearish sentiment among individual investors as measured by the American Association of Individual Investors was near its highest level in 21 years in March 2009. However, the S&P 500 rose in the subsequent 6 months after high bearish readings in 2002, 2004, and 2005. The JSCO Pain Index, which measures investor pessimism, was also at its lowest level since June 2007 in March 2009.
This document compares bearish sentiment levels from the American Association of Individual Investors (AAII) survey to the JSCO Pain Index and subsequent 6-month performance of the S&P 500 index. It shows that in 2002, 2004, and 2005, when bearish sentiment levels approached the highs seen in March 2009, the S&P 500 performance over the next 6 months was mixed, with both gains and losses.
Hn & Hcm Market Presentation Q4 2009 Final Ensavillsvietnam
The Ha Noi office market saw a significant increase in activity in Q4 2009. Grade A office space rents are about double those of Grade C space. Occupancy rates remain high across all grades, though Grade A space commands the highest rents at around $40-50 per square meter per month. Overall supply consists of 83 buildings, with 14 considered Grade A and the rest Grade B or C. New supply entering the market includes the Capital Tower and CEO Tower projects.
Global SNCF Mobility Index Presentation at SPREAD André Schneider
The document provides an overview and analysis of the Global SNCF Mobility Index for 2012. It examines trends in global and national mobility across four dimensions: goods mobility stress, regional urban mobility stress, mobility health check, and future mobility fitness. The index aims to better inform policymaking on mobility issues by benchmarking countries' performance and highlighting stresses on transportation systems from factors like trade, urbanization, environmental impacts and infrastructure investment. Selected results show most countries facing increasing stresses on goods mobility and negative environmental impacts from transportation that current policies are not adequately addressing.
- The first quarter of 2009 saw a rebound in financing for web 2.0 companies, with $521 million invested across 77 financings, up 54% from the previous quarter but down 44% from the first quarter of 2008.
- Video and social networking sectors attracted the most investment in the quarter, with Twitter raising the most of any single company at $35 million.
- The document identifies 90 public web 2.0 companies, with a total market cap of $34.8 billion, and provides a table comparing various financial metrics like revenue, market cap, employees and valuation for these companies.
This document summarizes the current US economic outlook from an asset management firm. It finds that while housing starts are at their highest level since 2008, they remain well below long-term levels. Additionally, job growth has not kept pace with population growth, and the US still needs to add around 6 million jobs to reach the Fed's unemployment target. Cheap funding for the government has supported stimulus efforts but internal growth remains weak as consumers, businesses, and investors wait for better economic conditions.
Anita Charlesworth: Productivity across the NHSNuffield Trust
This document discusses productivity trends in the NHS from 2003/12. It finds that while aggregate workforce spending has increased, it now forms a smaller proportion of total expenditure. This is due to a rise in medical staff numbers outpacing nursing staff. Productivity has remained largely unchanged according to ONS measures but some acute trusts have achieved gains through better cost control. The document identifies factors correlated with variations in trust-level productivity.
- The month of May saw the highest level of financing activity in over 12 months, totaling $327.1 million across 20 financings. This was buoyed by a $200 million investment by Digital Sky Technologies in Facebook.
- Excluding the Facebook transaction, May would have seen the lowest financing total for 2009 at $127.1 million. Ad networks saw the highest level of activity over the last three months.
- The report analyzes 93 public web 2.0 companies with a total market cap of around $53 billion. On average, companies have $577 million in market cap and $152 million in revenue.
This document is a presentation from Embraer Defense and Security that provides an overview of the company and its portfolio. It discusses Embraer Defense and Security's strategic vision to be a leader in the Brazilian defense market and expand into adjacent markets. The presentation outlines the company's main programs such as the KC-390 tactical aircraft, modernization programs, and integrated border monitoring systems. It also profiles partners and growth opportunities through acquisitions and joint ventures.
MoPub Mobile Advertising Marketplace Report (Q2 2012)Jim Payne
The document provides a summary of a report on the mobile advertising marketplace from Q2 2012. Some key findings include:
- Demand from advertisers for mobile ad impressions through real-time bidding auctions increased 300% from Q1 to Q2 2012.
- While iOS commands higher prices (eCPMs) than Android by 86%, Android is gaining share of total ad impression volume.
- Social networking, music, lifestyle, and health/fitness apps saw the largest growth in impression volumes, while music, lifestyle, and business apps achieved the highest eCPMs.
This document provides a digital marketing plan for Connecting Classrooms China for 2013. The plan focuses on making online platforms more resourceful and user-friendly, using social media to reach target audiences, and establishing an understanding of target audience behaviors. Key strategies include developing multi-portal delivery platforms, using social marketing, and analyzing customer behavior data. The plan outlines market insights, segmentation, positioning, digital tactics, and an evaluation framework.
This document contains a graph showing wind speed and direction forecasts for Carcavelos, Portugal over a 24 hour period from 20/12Z to 22/00Z. Wind speeds are predicted to be between 0-5 meters per second for most of the period with a brief increase up to 7 meters per second around 21/15Z. The wind is forecast to come primarily from the west-northwest.
This document contains weather forecast data for Carcavelos, Portugal from July 15-18, 2012. It includes graphs of wave height, tide level, wave period, air temperature, wind speed and direction, precipitation, and cloud cover over time. The forecasts are intended to help with surfing conditions prediction.
This document contains weather forecast data for Carcavelos, Portugal from July 15-18, 2012. It includes graphs of wave height, tide level, wave period, air temperature, wind speed and direction, precipitation, and cloud cover over time, as well as forecasts for average and maximum wind speed. The data is intended to help surfers determine wave conditions and quality for surfing.
AAII Sentiment (Bearish Index) w/JSCO Pain index using SP500 weekly data; JSCO Pain index using daily DJIA data, and JSCO Pain index using daily VIX data
The document summarizes findings from Mercer's 2010 worldwide survey on international assignment policies and practices. Some key findings include:
- Over 1,000 multinational companies participated in the survey from the Americas, Asia Pacific and EMEA regions.
- On average, companies sent 860 expatriates on assignment in 2010, with a median of 257. The Americas had the highest average use of expatriates.
- Common changes to assignment policies in the last two years included decreasing use of expatriates, heavier reliance on local employees, and increased use of cost-of-living allowances.
- Areas of global mobility policy under review included global policy development, short-term assignments,
1st chart 12/31/2001 thru 11/11/2009
2nd chart is a closeup showing 12/31/2007 thru 11/11/2007. Past results do not guarantee or imply future results. For educational purposes only. No investment advice given or implied.
Web 2.0 Weekly - Aug. 10, 2010: "Consolidation by Google"David Shore
Deals (M&A, Finance) – Consolidation by Google
Google confirmed or announced two acquisitions during the week, including Jambool
($70 mm) involved in virtual goods monetization processes, and widget market, Slide
($182 mm).
In other acquisition-related news, Forbes sold investment media website Investopedia to ValueClick for $42 mm. Zynga acquired Japanese mobile app and game developer,
Unoh, for an estimated $29 mm. Finally, dubbed “the Spanish Facebook,” social
networking site, Tuenti, was acquired by Telefonica in a $99 mm deal.
The largest financing (aside from the aforementioned M&A activity) involved “the
Chinese Youtube,” Tudou, raising $50 mm in Series E funds.
Price Performance
Distinctly negative price momentum, with 49% of stocks falling over the past week (after 48% of stocks declines last week, and 51% declined the week prior).
Web 2.0 Weekly - Aug. 4, 2010: "Playdom is going to Disney World"David Shore
Deals (M&A, Finance) – Disney Gets In To Social/Mobile Video Games
Disney acquired social and mobile game developer, Playdom, for $563 mm in upfront consideration and the potential for $200 mm in further earn-out based consideration. Disney management notes that the company continues to be on the acquisition war path.
The largest deals in the week involved (wait for it…) the advertising sector, with $15 mm in follow-on financings to eXelate and AdMeld, and $8 mm to BuzzLogic.
Four different social network/media companies received financing in the week, including, Hot Potato (acquired for $10 mm by Facebook), PlacePop ($1.4 mm round), Rapportive ($1 mm seed round), and dating site, Triangulate ($0.75 seed round).
Price Performance - Web 2.0 Valuation Reverse Course and Head Upward
The Web 2.0 public company universe was positive this week with 47% of stocks rising, 46% falling, and 7% flat.
Web 2.0 Weekly - July 27, 2010: "July Financings - Approaching High for 2010"David Shore
Deals (M&A, Finance)
Jive Software received the biggest investment of the week at $30 mm, bringing its total capital raised to date to $57 mm – the company brings social network-like functions to the realm of enterprise collaboration.
Advertising networks continue to receive the most attention among sectors we track – this week, $24.6 mm in financings were announced, including sports-related ad network Sportgenic (acquired by Glam Media for $12 mm), and TurnHere ($12.6mm in Series B funds).
Rumour alert – we continue to hear more frequent buzz concerning the potential acquisition of social gaming developer Playdom by Disney.
Synchronica (AIM:SYNC) intends to acquire iseemedia (TSXV:IEE) for C$8.8 mm in stock – both companies are engaged in mobile communications development, such as email-to-SMS.
Price performance turns positive
The Web 2.0 public company universe was positive this week, with 54% of companies seeing their market cap rise vs. 34% falling and 12% flat.
Web 2.0 Weekly - July 20, 2010: "DST Cashing Up"David Shore
Large deals drive July financing to near record levels: With another huge financing (DST - see below) July financing is near record monthly levels. Total raised month-to-date is $742.6 million over 29 deals - averaging $25.6 million each. Excluding the Zynga ($100 million) and DST ($388 million) deals, the average deal size is $9.4 million. In comparison, total capital raised in July 2009 was $209.0 million, averaging $5.2 million over 40 deals. The monthly median total is ~$280 million with a median deal size of $8.1 million.
Deals (M&A, Finance)
Naspers, a South African media and print conglomerate, invested $388 mm in Digital Sky Technologies, the Russian digital media holding company with significant stakes in Facebook, Groupon, Mail.ru, and Zynga.
The next biggest raise of the week was Australian enterprise software developer, Atlassian, receiving $60 mm in Series A funds from Accel Partners.
Social Commerce continues to garner attention – this week BlueSwarm ($0.8 mm angel round) and Shopkick ($15 mm Series B round) raised money.
Another $31 mm in venture funds found their way to Advertising-related start-ups, including Israel-based Adsmarket ($17 mm), as well as a pair of India-based companies – Komli Media ($6 mm) and InMobi ($8 mm).
Price performance split
The Web 2.0 public company universe was split this week, with 48% of companies seeing their market cap fall vs. 43% rising and 9% flat.
Google/Zynga deal drives July financing results: After starting very slowly (just one deal announced in the prior week) July financing increased substantially as a result of the Google/Zynga financing ($100-200 million). Total raised month-to-date is $158.8 million over 12 deals - averaging $13.2 million each. In comparison, total capital raised in July 2009 was $206.5 million, averaging $5.3 million over 39 deals. Excluding Dec 09 and Apr 10, the average monthly total is ~$280 million.
Deals (M&A, Finance)
Google invested a rumoured $100-$200 mm in social game developer, Zynga, bringing that company’s total funding to almost $500 mm (assuming the lower end of the range).
The Gaming sector remains hot – along with Google’s investment in Zynga, The9 Ltd. (Chinese online game developer and operator) invested $5 mm in Delaware-based Aurora Feint (focused on gaming for the mobile space).
A triad of financings in the Social Commerce space this week, including Beyond the Rack ($12 mm), ThredUP ($1.7 mm), and BuyWithMe ($16 mm in a Series B financing).
Sysomos, Canadian social media monitoring firm, was acquired by MarketWire for between $25 mm and $35 mm.
Price performance turns positive
The Web 2.0 public company universe rose this week, with 58% of companies seeing their market cap rise vs. 32% rising and 10% flat.
Summer financing doldrums: After a very strong June (with total transaction value (excluding M&A) of $542.8 million from 66 transactions, averaging $8.4 million each), July has started very slowly with only one small financing announced. However, we have seen some large M&A transactions (see below). In comparison, total capital raised in July 2009 was $206.2 million, averaging $5.4 million over 38 deals. Excluding Dec 09 and Apr 10, the average monthly total is ~$270 million.
Deals (M&A, Finance)
Google, acquired ITA Software, search provider for the travel industry for $700 mm.
infoGROUP, provider of business and consumer databases for sales leads, mailing lists, direct marketing, database marketing, e-mail marketing, and marketing research solutions, was taken private for $645 mm by CCMP Capital Advisers.
GroupSpaces, a provider of web-based tools for sports clubs, university societies, organizations, and groups of friends or coworkers, raised $1.3 mm.
Domain based online advertising services provider, OCTANE360, was acquired by Local.com for $10.9 mm.
Negative price performance
The Web 2.0 public company universe fell again this week, with 61% of companies seeing their market cap fall vs. 27% rising and 12% flat.
June financing well ahead of average: Financing in the Web 2.0 universe in June was the third highest month (over the past 12) with total transaction value (excluding M&A) of $459.6 million from 51 transactions, averaging $9.0 million each - led by the $147 million Zynga financing. In comparison, total capital raised in June 2009 was $226.3 million, averaging $4.5 million over 50 deals. Excluding Dec 09 and Apr 10, the average monthly total is ~$260 million.
Deals (M&A, Finance)
Alloy, a provider of news and commentary concerning New Media, was acquired by ZelnickMedia for $127 mm.
Facebook’s implied valuation rose to $24 bn as Elevation Partners purchased 5 mm shares of the company for $120 mm in the secondary market.
Danish Skype competitor, Vopium, received $16.5 mm in financing from Indian financier, Raghuvinder Kataria.
Social networking software developer based in France, Pearltrees, raised $1.6 mm.
PapayaMobile, mobile application software company based in China, raised $4 mm.
Two Israeli mobile developers received funding this week, including Perfecto Mobile ($4 mm) and Snaptu ($6 mm).
Negative price performance
The Web 2.0 public company universe fell this week, with 68% of companies seeing their market cap fall vs. 25% rising and 7% flat.
Web 2.0 Weekly - June 22, 2010: "AOL Sells Bebo for Massive Loss"David Shore
Deals (M&A, Finance)
AOL is reported to have sold Bebo, the UK-based social network it bought just two years ago for $850 mm, to private equity firm Criterion Partners for under $10 mm. Based on our calculations, AOL paid the equivalent of $38 per Unique Visitor (UV) for Bebo, and sold it for under $1 per UV.
Positive price performance
The Web 2.0 public company universe rose again this week, with 60% of companies seeing their market cap rise vs. 33% falling and 7% flat.
Google acquired advertising analytics firm Invite Media for $70 million. Zynga acquired virtual goods game maker Challenge Games for $20.5 million. FetchBack, a post-customer interaction advertising platform, was acquired by GSI Commerce for $40 million. Shanda Interactive reported a 16% year-over-year revenue decline to $1.1 billion as the company's gaming revenues registered a decline.
Web 2.0 Weekly - May 26, 2010: "Market Declines Impact Web 2.0 Universe Valua...David Shore
May tracking to average monthly levels: After a slow start to the month, financing in the Web 2.0 universe has rebounded and is now on track with prior months. Total transaction value (excluding M&A) in the Web 2.0 universe for May (month-to-date) is $189.9 million from 30 transactions, averaging $6.3 million each. In comparison, total capital raised in May 2009 was $375.0 million, averaging $12.5 million over 30 deals. Excluding May 09, Dec 09 and Apr 10, the average monthly total is $212 million.
Deals (M&A, Finance)
Cyberplex (TSX:CX) announced plans to acquire Tsavo Media for US$75.6 mm, partially funded through a C$30 mm bought deal financing at $0.55.
Online gaming company Gaikai, raised $10.0 mm in Series B financing.
Blip.TV, online TV provider, raised $10.1 mm in Series C financing.
Financial Results/Guidance
Netease.com (NasdaqGS:NTES, online gaming) reported Q1/F10 revenue of RMB 1.2 bn (vs. RMB 781.7 mm in the same period last year).
Snap Interactive (OTCBB:STVI, online dating) reported Q1/F10 revenue growth of 20% to $0.927 mm from $0.768 mm.
Bearish week again: Price performance was largely negative in our Web 2.0 universe. This impacted valuation multiples, which fell for ~80% of the companies in our universe.
The document summarizes recent developments in the online luxury retail sector. It notes that Brandsclub, a Brazilian luxury flash retailer, received $17 million in funding and Gilt Groupe raised $35 million. It also discusses financial results for two publicly traded companies, Fluid Music and Points International, showing revenue growth for both. Tables provide aggregate data on over 100 public companies in the web 2.0 sector, including metrics like market cap, revenue, growth rates, and valuations. A chart shows the geographic distribution of these companies and another charts their sector breakdown.
Slow start in May after record April: Total transaction value (excluding M&A) in the Web 2.0 universe for April was $813.5 million - the highest monthly total we have recorded. The number of financings was also a record, at 49, averaging $16.6 million each. Note that this includes the $300 million investment in DST by Tencent. Excluding this transaction, the average is $10.7 million. May 2010, in contrast, has started slowly, with only $37.4 million in financing announced thus far, averaging just $3.4 million across 11 deals. In comparison, total capital raised in May 2009 was $375.0 million, averaging $12.5 million over 30 deals.
Deal round-up for May: The large deal highlights for the month include:
Fluid Music (TSX:FMN, digital music distributor) will acquire Mood Media (provider of sensorial marketing solutions) for €160 mm.
Lithium is purchasing analytics developer, Scout Labs, for $20 mm.
Fatfoogoo (purveyor of virtual goods) is being acquired by Digital River for $10 mm.
Groupalia, the Spanish answer to online group discount retailers, Groupon and LivingSocial, raised $2.5 mm in a Series A financing – the online group discounters have been raising money quickly (DST invested $135 mm in Groupon in April) with a total of $222 mm in funding coming to just these three players thus far.
Bearish week again: Price performance was largely negative in our Web 2.0 universe, with prices dropping for over 70% of the companies.
April 2010 a record month for Web 2.0 Financing: Total transaction value (excluding M&A) in the Web 2.0 universe for April was $808.2 million - the highest monthly total we have recorded. The number of financings was also a record, at 48, averaging $16.8 million each. Note that this includes the $300 million investment in DST by Tencent. Excluding this transaction, the average is $9.6 million. In comparison, total capital raised in March was $168.1 million, averaging $5.4 million over 31 deals.
Deal round-up for April: The large deal highlights for the month include:
Tencent invested $300mm in DST (investor in Facebook, Zynga, Groupon).
Apple acquired Siri, a mobile local search developer for a rumoured $225 mm.
DST acquired ICQ, the instant messaging company, for $187.5 mm.
Warner Bros. acquired gaming company, Turbine, for $160 mm.
DST invested $135mm in social-shopping service Groupon.
Salesforce.com acquired crowd-sourced personal contact service, Jigsaw, for $142 mm.
Ankeena Networks, media infrastructure solution provider was acquired by Juniper for $100mm.
Bearish week: Price performance was largely negative in our Web 2.0 universe, with prices dropping for over 60% of the companies.
April on track to be record month?: Total transaction value in the Web 2.0 universe April-to-date is $726.1 million. The number of financings stands at 40 averaging $18.2 million each. Note that this includes the $300 million investment in DST by Tencent. Even excluding this transaction, the average is $15.2 million. In comparison, total capital raised in March was $168.1 million, averaging $5.4 million over 31 deals. The highest monthly total in our Web 2.0 financing database was April 2008 with a total of $765.5 million raised in 47 transactions.
Deal round-up for April: The large deal highlights for the month include:
§
•Tencent invested $300mm in DST (investor in Facebook, Zynga, Groupon).
DST invested $135mm in social-shopping service Groupon.
Salesforce.com acquired crowd-sourced personal contact service, Jigsaw, for $142 mm.
•Warner Bros. acquired gaming company, Turbine, for $160 mm.
•Ankeena Networks, media infrastructure solution provider was acquired by Juniper for $100mm.
Bullish week for Web 2.0: Sixty-nine percent of the companies in our universe had increased or flat market caps over the past week, sixty-nine percent had increased EV/Revenue multiples, 75% had increased or flat EV/EBITDA multiples and 73% had increased or flat P/E mutliples .
10 01 05 Web 2.0 Weekly Special EditionDavid Shore
TOP FIVE DEALS OF 2009
The Top Five: Despite over 400 transactions in 2009, it wasn’t hard choosing our Top Five transactions for 2009 (with a little bit of massaging). Our Top Five transactions are: Facebook’s $200 million D round, Twitter’s $100 million E round, the $2.25 billion acquisition of Skype, the almost $1 billion in financing/M&A for Social Gaming companies (including Zynga, Playdom and Playfish), and the incredible per unique visitor value ascribed in the financing for location-based social networking company Gowalla.
• Facebook raises $200 million D round: In May 2009, Facebook announced a new financing round – raising $200 million from Digital Sky Technologies. The transaction gave Digital Sky a 1.96% stake, valuing Facebook at $10 billion. This financing brought the company’s total to $678.2 million. This was also the largest financing we recorded in 2009.
• Twitter raises $100 million E round: The third largest financing round in 2009 belonged to Twitter – a $100 million Series E in September 2009. The financing reportedly valued Twitter at $1 billion – a remarkable valuation for a company that has not yet formalized a revenue model! More recently, it has been reported that Twitter was actually profitable in 2009 due to the $25 million in search deals it signed in October with Google and Microsoft.
• Skype is acquired for $2.025 billion: By far the largest overall transaction in our database in 2009 was the acquisition of a majority position (65%) in Skype from eBay for $2.025 billion – announced in September 2009. The transaction was completed in November 2009. eBay had purchased Skype for $4.0 billion in 2005.
• Social Gaming financing activity reaches ~$1 billion (Zynga, Playfish, Playdom, etc.): Perhaps the hottest sector overall in 2009 was Social Gaming. This segment of the Web 2.0 market had the third highest number of deals (39) and generated almost $1 billion in financing/M&A activity – the second highest total overall (Figure 1). Three transactions in particular stand out in the social gaming space – the $400 million acquisition of Playfish (by Electronic Arts, November 2009), the $180 million financing of Zynga (Series C, December 2009, by Digital Sky), and the $43 million first round of financing for Playdom (New Enterprise lead, November 2009, Series A). There has been much speculation as to how the larger social gaming companies will proceed, with potential IPO or further strategic M&A most likely.
• Hottest new sector? Location-based social networks (Foursquare, Gowalla, etc.). Unique visitor value skyrockets: Financing activity for location-based social networks really heated up late in 2009. While the total financing raised in 2009 was quite small (~$15 million), the hype surrounding location-based SNS companies was substantial. In our opinion, this was highlighted by the $8.4 million December Series B financing for Gowalla. The reported valuation of $28.4 million implies a value of $568 for each of its 50,000 users (Figure 2). That compares to a $40 per user value we estimate for the Foursquare financing in September.
LATTER HALF OF 2009: FORGING FORWARD
DEAL VALUE ON PACE TO MEET NOVEMBER LEVEL
December starts at strong pace: Total transaction value in the Web 2.0 universe for the first week of December is $68.8 million. The number of financings stands at seven, averaging $9.8 million each. In comparison, total capital raised in November was $203.4 million, averaging $11.3 million (18 deals); October was $171.3 million, averaging $6.3 million (27 deals); and September was $232.8 million, averaging $9.0 million (26 deals).
Broad-based sector financing: Video, Gaming, Advertising, Collaboration, and Analytics experienced the most financing activity among our Web 2.0 sector categories in the past three months by number of transactions (six each). Social Networks remain strong with five deals in the past quarter. Infrastructure and Search round out the top three positions at four deals each over the past three months. The $400 million acquisition of Playfish skews the Virtual Worlds segment to the highest total.
Market pull-back abates – universe split between risers and decliners: Twenty-five companies in our universe had positive stock price performances over the past week (for stocks with prices greater than $1), while 22 companies showed negative 1-week returns.
- The analyst initiated coverage of Multiplied Media Corporation with a BUY recommendation and a $0.40 target price based on their analysis in the report "Growth is the Poynt".
- The Poynt user base has grown 50% monthly on average since launch in April 2009 and is expected to reach a revenue inflection point in Q4/F09 with 100% sequential growth.
- As the growing user base is monetized through fees and advertising, the company is expected to become EBITDA positive in the second half of 2010.
This document provides an analysis of Google's new free turn-by-turn navigation feature for Android phones. It will negatively impact dedicated GPS device makers TomTom and Garmin, whose share prices dropped on the news. It also threatens Apple and BlackBerry, as they will need to purchase their own mapping data or ship phones without the free navigation. The new feature strengthens Android's position in the mobile market through free, innovative applications.
Google acquired AdMob, a mobile ad network, for $750 million. This implies a price to sales valuation of 7.5x for AdMob, which has annual revenue of around $100 million. Electronic Arts acquired social gaming company Playfish for up to $400 million, valuing Playfish at between 4-5.3x its estimated annual revenue of $75 million. Capital market activity in the Web 2.0 sector slowed in November, with total funding so far at $24.2 million from six deals averaging $4 million each, down from previous months.
1. Elemental Economics - Introduction to mining.pdfNeal Brewster
After this first you should: Understand the nature of mining; have an awareness of the industry’s boundaries, corporate structure and size; appreciation the complex motivations and objectives of the industries’ various participants; know how mineral reserves are defined and estimated, and how they evolve over time.
STREETONOMICS: Exploring the Uncharted Territories of Informal Markets throug...sameer shah
Delve into the world of STREETONOMICS, where a team of 7 enthusiasts embarks on a journey to understand unorganized markets. By engaging with a coffee street vendor and crafting questionnaires, this project uncovers valuable insights into consumer behavior and market dynamics in informal settings."
Lecture slide titled Fraud Risk Mitigation, Webinar Lecture Delivered at the Society for West African Internal Audit Practitioners (SWAIAP) on Wednesday, November 8, 2023.
In a tight labour market, job-seekers gain bargaining power and leverage it into greater job quality—at least, that’s the conventional wisdom.
Michael, LMIC Economist, presented findings that reveal a weakened relationship between labour market tightness and job quality indicators following the pandemic. Labour market tightness coincided with growth in real wages for only a portion of workers: those in low-wage jobs requiring little education. Several factors—including labour market composition, worker and employer behaviour, and labour market practices—have contributed to the absence of worker benefits. These will be investigated further in future work.
^%$Zone1:+971)581248768’][* Legit & Safe #Abortion #Pills #For #Sale In #Duba...mayaclinic18
Whatsapp (+971581248768) Buy Abortion Pills In Dubai/ Qatar/Kuwait/Doha/Abu Dhabi/Alain/RAK City/Satwa/Al Ain/Abortion Pills For Sale In Qatar, Doha. Abu az Zuluf. Abu Thaylah. Ad Dawhah al Jadidah. Al Arish, Al Bida ash Sharqiyah, Al Ghanim, Al Ghuwariyah, Qatari, Abu Dhabi, Dubai.. WHATSAPP +971)581248768 Abortion Pills / Cytotec Tablets Available in Dubai, Sharjah, Abudhabi, Ajman, Alain, Fujeira, Ras Al Khaima, Umm Al Quwain., UAE, buy cytotec in Dubai– Where I can buy abortion pills in Dubai,+971582071918where I can buy abortion pills in Abudhabi +971)581248768 , where I can buy abortion pills in Sharjah,+97158207191 8where I can buy abortion pills in Ajman, +971)581248768 where I can buy abortion pills in Umm al Quwain +971)581248768 , where I can buy abortion pills in Fujairah +971)581248768 , where I can buy abortion pills in Ras al Khaimah +971)581248768 , where I can buy abortion pills in Alain+971)581248768 , where I can buy abortion pills in UAE +971)581248768 we are providing cytotec 200mg abortion pill in dubai, uae.Medication abortion offers an alternative to Surgical Abortion for women in the early weeks of pregnancy. Zone1:+971)581248768’][* Legit & Safe #Abortion #Pills #For #Sale In #Dubai Abu Dhabi Sharjah Deira Ajman Fujairah Ras Al Khaimah%^^%$Zone1:+971)581248768’][* Legit & Safe #Abortion #Pills #For #Sale In #Dubai Abu Dhabi Sharjah Deira Ajman Fujairah Ras Al Khaimah%^^%$Zone1:+971)581248768’][* Legit & Safe #Abortion #Pills #For #Sale In #Dubai Abu Dhabi Sharjah Deira Ajman Fujairah Ras Al Khaimah%^^%$Zone1:+971)581248768’][* Legit & Safe #Abortion #Pills #For #Sale In #Dubai Abu Dhabi Sharjah Deira Ajman Fujairah Ras Al Khaimah%^^%$Zone1:+971)581248768’][* Legit & Safe #Abortion #Pills #For #Sale In #Dubai Abu Dhabi Sharjah Deira Ajman Fujairah Ras Al Khaimah%^^%$Zone1:+971)581248768’][* Legit & Safe #Abortion #Pills #For #Sale In #Dubai Abu Dhabi Sharjah Deira Ajman Fujairah Ras Al Khaimah%^^%$Zone1:+971)581248768’][* Legit & Safe #Abortion #Pills #For #Sale In #Dubai Abu Dhabi Sharjah Deira Ajman Fujairah Ras Al Khaimah%^^%$Zone1:+971)581248768’][* Legit & Safe #Abortion #Pills #For #Sale In #Dubai Abu Dhabi Sharjah Deira Ajman Fujairah Ras Al Khaimah%^^%$Zone1:+971)581248768’][* Legit & Safe #Abortion #Pills #For #Sale In #Dubai Abu Dhabi Sharjah Deira Ajman Fujairah Ras Al Khaimah%^^%$Zone1:+971)581248768’][* Legit & Safe #Abortion #Pills #For #Sale In #Dubai Abu Dhabi Sharjah Deira Ajman Fujairah Ras Al Khaimah%^^%$Zone1:+971)581248768’][* Legit & Safe #Abortion #Pills #For #Sale In #Dubai Abu Dhabi Sharjah Deira Ajman Fujairah Ras Al Khaimah%^^%$Zone1:+971)581248768’][* Legit & Safe #Abortion #Pills #For #Sale In #Dubai Abu Dhabi Sharjah Deira Ajman Fujairah Ras Al Khaimah%^^%$Zone1:+971)581248768’][* Legit & Safe #Abortion #Pills #For #Sale In #Dubai Abu Dhabi Sharjah Deira Ajman Fujairah Ras Al Khaimah%^^%$Zone1:+971)581248768’][* Legit & Safe #Abortion #Pills #For #Sale In #Dubai Abu Dhabi Sharjah Deira Ajman
Solution Manual For Financial Accounting, 8th Canadian Edition 2024, by Libby...Donc Test
Solution Manual For Financial Accounting, 8th Canadian Edition 2024, by Libby, Hodge, Verified Chapters 1 - 13, Complete Newest Version Solution Manual For Financial Accounting, 8th Canadian Edition by Libby, Hodge, Verified Chapters 1 - 13, Complete Newest Version Solution Manual For Financial Accounting 8th Canadian Edition Pdf Chapters Download Stuvia Solution Manual For Financial Accounting 8th Canadian Edition Ebook Download Stuvia Solution Manual For Financial Accounting 8th Canadian Edition Pdf Solution Manual For Financial Accounting 8th Canadian Edition Pdf Download Stuvia Financial Accounting 8th Canadian Edition Pdf Chapters Download Stuvia Financial Accounting 8th Canadian Edition Ebook Download Stuvia Financial Accounting 8th Canadian Edition Pdf Financial Accounting 8th Canadian Edition Pdf Download Stuvia
Seminar: Gender Board Diversity through Ownership NetworksGRAPE
Seminar on gender diversity spillovers through ownership networks at FAME|GRAPE. Presenting novel research. Studies in economics and management using econometrics methods.
2. Elemental Economics - Mineral demand.pdfNeal Brewster
After this second you should be able to: Explain the main determinants of demand for any mineral product, and their relative importance; recognise and explain how demand for any product is likely to change with economic activity; recognise and explain the roles of technology and relative prices in influencing demand; be able to explain the differences between the rates of growth of demand for different products.
1. SOFTWARE & SERVICES 19 MAY 2009
DAVID SHORE, CFA, MBA 416.860.6784
WEB 2.O WEEKLY david.shore@researchcapital.com
Arun Thomas (Associate) 416.860.7666
AD NETWORK COMPANY CYBERPLEX RAISES C$15 MILLIO N IN EQ UITY FINANCING
CA N AD A’ S C Y B ER PL E X RA I SE S MO N E Y T O F U EL N E XT L E V EL OF G RO WT H
Last week we saw a number of companies in the media and W eb 2.0 sector reporting earnings, but none was more
surprising than Cyberplex. This company, operating in the ad network space, continued to surprise investors both on
the earnings front and capital market activity. In posting approximately 300% growth in revenues Y/Y (see figure
below), the company has demonstrated the merit of its business model and has returned to the equity markets for
C$15 million to fuel the next phase of its growth.
S egmented R evenue, by Quarter
35 500. 0%
450. 0%
30
400. 0%
25 350. 0%
300. 0%
20
(% )
( $m)
250. 0%
15
200. 0%
10 150. 0%
100. 0%
5
50. 0%
0 0.0%
Mar-07
J un-07
Dec-07
Mar-08
J un-08
Dec-08
Mar-09
S ep-07
S ep-08
Technology S ervices (L HS )
Web A dvertis ing ( LHS )
Total revenues - y oy grow th (R HS )
C yberplex a big boost for financing activity in May: Month-to-date financings in May totalled $84.3 million and
benefited from a financing from Cyberplex for $12.9 million. So far, there have been 14 financings in May with seven
deals greater than $5 million and only three less than $5 million. Except for Cyberplex, no deals were greater than
$10 million, with the capital raise by Imeem and EveryZing closely behind at $8.8 million and $8.3 million,
respectively.
Price Performance: The companies in our universe had mixed stock price performances over the past week (for
stocks with prices greater than $1) (Figure 6), with 24 companies showing positive returns on the week. Ynk Korea,
Inc. (A023770-KOSE) led the group with a 30.9% return, while Mixi, Inc. (2121-TSE) had the worst return, dropping
9.2% in the week.
This report has been created b y Anal ysts that are emplo yed b y Research Capital Corporation, a Canadian Investment Dealer.
For further disclosures, please see last page of this report.
w w w . r e s e a rc h c a p i t a l . c o m
T o ro n t o 4 1 6 . 8 6 0 . 7 6 0 0 Montreal 514.399.1500 Vancouver 604.662.1800 Calgary 403.265.7400 Regina 306.566.7550
2. Page 2
THE WEB 2.0 UNIVERSE
Ninety-three public Web 2.0 companies identified: Our W eb 2.0 universe contains 93 companies, with a combined
market cap of ~ $46 billion (Figure 1). The average market cap for the group is ~$500 million (but a median of only $50.6
million), with average trailing revenue of $148.5 million (median $55.6 million). The companies are also generally
profitable, with a median EBITDA margin of 16.0%. On a valuation basis, the overall average is 5.2x trailing revenue
(median 1.6x) and 9.3x trailing EBITDA (median 8.7x). Fourteen of the companies have more than 500 employees.
C omparable C ompan y A nalys is > W eb 2.0
Trading Cu rr ent U S D Market U S D LT M To tal US D L TM T otal E BITD A TE V/LT M T E V/LT M
C om pany Nam e L TM as o f T ic ker E xc hange Currenc y H Q P ric e C ap ($m) R ev ($m) E B ITDA ($m) % R evenu e E B IT DA E mployees
Acce le riz e N ew Me dia, Inc. 3 /31 /200 9 AC LZ OT C B B USD U nited S ta tes 0 .50 1 3.8 4.1 (4 .4) NM 4.6 x - 11
Actoz S of t C o., L td. 1 2/31 /200 8 A0 527 90 K OS E KR W S outh K orea 14, 400 9 9.4 75. 7 1 5.1 20 .0% 0.9 x 4.7x NA
AQ Inte ractive , Inc. 1 2/31 /200 8 38 38 TSE J PY J apan 48 ,000 .00 2 6.8 61. 8 4 .9 8 .0% - - NA
As s ocia ted Media Holdings Inc. 6 /30 /200 7 AS MH OT C P K USD U nited S ta tes 0 0 .1 0.1 (2 .3) NM 8.1 x - 3
B igstring Co rp. 1 2/31 /200 8 BS GC OT C B B USD U nited S ta tes 0 .02 1 .2 0.1 (2 .1) NM 30.6 x - 4
B e tawave Corpora tion 1 2/31 /200 8 B W AV OT C B B USD U nited S ta tes 0 3 .2 7.7 (1 1.8) NM - - 45
B e yond Commerce, Inc. 1 2/31 /200 8 B Y OC OT C B B USD U nited S ta tes 1 .04 4 3.0 1.8 (8 .6) NM 25.4 x - 43
B right T hings plc 9 /30 /200 8 AIM :B G T AIM GBP U nited K ingdom 0 5 .6 0.2 (1 .7) NM 22.1 x - 9
B roa dW ebAs ia Inc. 9 /30 /200 8 BW BA OT C P K USD U nited S ta tes 0 .30 2 5.3 0.0 (4 .6) NM - - 46
C DC C orp. 3 /31 /200 9 C HIN .A Nas da qG S USD H ong K ong 1 15 7.3 389 .9 3 0.8 7 .9% 0.4 x 5.5x NA
C ha ngyou. com Limite d 3 /31 /200 9 C Y OU Nas da qG S USD C hina 29 .80 1,5 27.3 222 .5 13 5.1 60 .7% 6.0 x 9.9x 628
C hina G ate wa y C orpora tion 9 /30 /200 8 C GW Y OT C P K USD U nited S ta tes 0 0 .0 6.7 (6 .6) -9 8.9% 0.0 x - 37
C hine s e G amer In ternational 3 /31 /200 9 G T S M:308 3 GT S M TWD T aiwan 225 .00 57 5.6 56. 2 3 1.5 56 .0% 9.1 x 1 6.2 x NA
C ornerW orld C orporation 1 /31 /200 9 C WR L OT C B B USD U nited S ta tes 0 6 .4 1.3 NM NM 6.0 x - NA
C yberplex Inc. 3 /31 /200 9 T S X:C X TSX C AD C ana da 1 .87 8 6.5 70. 3 7 .3 10 .4% 1.2 x 1 1.3 x NA
D ADA S pA 9 /30 /200 8 C M:D A CM EUR Ita ly 6 13 9.4 231 .1 3 6.9 16 .0% 0.8 x 5.0x 574
D XN Holdings B hd 2 /28 /200 9 D XN KL SE MY R Ma la ys ia 0 .44 2 9.1 78. 7 1 0.8 13 .7% 0.6 x 4.2x NA
D ibz Inte rnational, Inc. NA D IB Z OT C P K USD U nited S ta tes 0 0 .0 NA NM NM - - NA
D igitalP ost Inte ra ctive , Inc. 1 2/31 /200 8 D G LP OT C B B USD U nited S ta tes 0 .02 1 .1 0.5 (3 .2) NM 5.1 x - 7
D igitalT own, Inc. 2 /28 /200 9 DGT W OT C B B USD U nited S ta tes 3 6 7.7 NM (3 .0) NM - - 3
D olphin D igital Me dia, Inc. 1 2/31 /200 8 D P DM OT C B B USD U nited S ta tes 0 .68 3 3.5 0.9 (3 .0) NM 37.2 x - NA
E olith C o. L td. 1 2/31 /200 7 A0 410 60 K OS E KR W S outh K orea 900 5 2.4 20. 2 (0 .1) -0 .3% 2.7 x - NA
E xte ns ions , Inc. 1 2/31 /200 8 E XT I OT C P K USD U nited S ta tes 0 .15 1 4.2 NM NM NM - - NA
F inancia l Media G roup, Inc. 2 /28 /200 9 F NG P OT C B B USD U nited S ta tes 0 0 .4 7.2 2 .4 NM - - 22
F luid M us ic Ca nada, In c. 1 2/31 /200 8 T S X:F MN TSX C AD U nited S ta tes 0 .45 2 0.4 4.6 (9 .3) -6 0.6% 1.9 x - NA
F rogs te r Interactive P icture s AG 6 /30 /200 8 F RG XT R A EUR G ermany 8 2 4.6 5.5 (3 .3) 16 .6% 4.4 x - NA
G a ma nia D igital E ntertainment C o., L td. 3 /31 /200 9 61 80 GT S M TWD T aiwan 38 .60 17 8.2 126 .0 2 0.9 25 .9% 1.2 x 7.4x NA
G a me On C o L td. 1 2/31 /200 8 38 12 TSE J PY J apan 91, 800 9 1.0 76. 5 1 9.8 NM 0.4 x 1.7x NA
G e oS e ntric O yj 1 2/31 /200 8 G E O1 V HLS E EUR F inland 0 .04 4 8.8 6.0 (1 3.4) 61 .9% 6.9 x - 94
G iant Intera ctive G roup, Inc. 1 2/31 /200 8 GA NY S E USD C hina 8 1,8 62.2 233 .6 14 4.6 24 .2% - - NA
G iga Media Ltd. 1 2/31 /200 8 G IG M Nas da qG S USD T aiwan 6 .38 34 4.7 190 .4 4 6.0 19 .2% 1.4 x 5.8x NA
G ravity C o., L td 9 /30 /200 8 GR VY Nas da qG M USD S outh K orea 1 2 7.0 39. 7 7 .6 36 .0% - - 636
G ree, Inc. 6 /30 /200 8 T S E : 363 2 TSE J PY J apan 5 ,260 .00 1,2 03.8 30. 1 1 0.8 17 .8% 37.3 x - NA
G ungH o O nline E ntertainment, Inc. 1 2/31 /200 8 37 65 OS E J PY J apan 1 42, 600 16 7.5 115 .3 2 0.6 -2 8.2% 1.3 x 7.1x NA
H anbitS of t, Inc. 1 2/31 /200 8 A0 470 80 K OS E KR W S outh K orea 4 ,855 .00 8 6.3 56. 4 (1 5.9) 3 .0% 1.2 x - NA
IAC /InterActiveC orp. 3 /31 /200 9 IAC I Nas da qG S USD U nited S ta tes 16 2,3 92.0 1 ,40 6.4 4 2.6 NM 0.4 x 1 1.9 x 3 ,20 0
IAS E nergy, Inc. 1 /31 /200 9 IAS C.A OT C B B USD C ana da 0 .28 1 9.6 0.0 (0 .8) NM - - NA
IdeaE dge, Inc. 1 2/31 /200 8 OT C B B :ID AE OT C B B USD U nited S ta tes 1 2 4.3 0.0 (4 .6) NM - - NA
is ee media Inc. 1 2/31 /200 8 IE E T S XV C AD C ana da 0 .09 4 .0 1.3 (5 .1) 37 .2% 1.8 x - NA
J umbuck E ntertainment P ty Ltd. 1 2/31 /200 8 AS X:J MB AS X AU D Aus tra lia 0 1 5.3 13. 7 5 .1 -6 2.6% 0.8 x 2.1x 72
J umpT V Inc. 1 2/31 /200 8 T S X:J T V TSX C AD C ana da 0 .71 6 9.7 13. 4 (8 .4) 10 .0% 4.0 x - 237
K a boos e Inc. 1 2/31 /200 8 T S X:K AB TSX C AD C ana da 1 7 2.5 70. 7 7 .0 38 .7% 1.1 x 1 1.2 x NA
K ings oft Co. Ltd. 1 2/31 /200 8 38 88 S E HK HKD C hina 4 .14 57 6.9 120 .2 4 6.6 NM 4.2 x 1 0.9 x 2 ,27 1
Lingo Media Corporation 1 2/31 /200 8 T S XV : LM T S XV C AD C ana da 1 1 1.1 0.8 (1 .5) -4 .3% 10.9 x - NA
Live Wo rld Inc. 1 2/31 /200 8 LV WD OT C P K USD U nited S ta tes 0 .07 2 .2 11. 8 (0 .5) -6 .3% 0.1 x - NA
LookS mart, Ltd. 3 /31 /200 9 LOOK Nas da qG M USD U nited S ta tes 1 2 4.6 60. 7 (3 .8) NM - - 90
Magnitude Information S ys tems Inc. 1 2/31 /200 8 MA G Y OT C B B USD U nited S ta tes 0 .01 4 .4 0.1 (3 .0) 38 .0% - - 14
Mixi, Inc. 1 2/31 /200 8 21 21 TSE J PY J apan 4 50, 000 70 8.4 120 .3 4 5.8 15 .3% 5.0 x 1 3.2 x NA
Mode rn Times G roup Mtg AB 3 /31 /200 9 MT G B OM S EK S weden 237 .50 2,0 20.2 1 ,73 7.6 26 6.2 NM 1.5 x 9.7x 2 ,96 9
Moggle , Inc 1 2/31 /200 8 MMOG OT C B B USD U nited S ta tes 2 8 3.5 NM (1 .1) NM - - 3
MOK O.mobi L imited 1 2/31 /200 8 MK B AS X AU D Aus tra lia 0 .08 5 .0 1.1 (2 .3) 1 .9% 3.5 x - NA
Myriad G rou p AG 1 2/31 /200 8 MY R N SWX C HF S witzerla nd 5 9 8.2 40. 0 0 .8 26 .8% 2.8 x - 405
N E OW IZ G ames C orpora tion 1 2/31 /200 8 A0 956 60 K OS E KR W S outh K orea 62 ,400 .00 48 7.1 200 .8 5 3.9 45 .7% 2.4 x 8.9x NA
N etD ragon W ebS oft, Inc. 1 2/31 /200 8 77 7 S E HK HKD C hina 6 37 7.2 87. 3 3 9.9 65 .0% 2.8 x 6.1x 2 ,42 6
N ete as e.com I nc. 1 2/31 /200 8 NT E S Nas da qG S USD C hina 30 .96 3,8 09.7 451 .8 29 3.7 NM - - NA
N eXplore Corpora tion 9 /30 /200 7 N XP C OT C P K USD U nited S ta tes 1 3 9.0 NM (4 .9) 30 .8% - - 19
N gi G roup Inc. 1 2/31 /200 8 24 97 TSE J PY J apan 31 ,700 .00 4 0.2 100 .8 3 1.0 17 .6% - - NA
N orthgate Te chnologies L imited 1 2/31 /200 8 59 005 7 BS E INR India 39 2 7.6 136 .2 2 4.0 25 .5% 0.2 x 1.2x 286
Open T e xt Corp. 3 /31 /200 9 OT E X Nas da qG S USD C ana da 31 .73 1,6 69.7 782 .6 19 9.2 -1 .0% 2.2 x 8.7x 3 ,40 0
Openwave S ys tems Inc. 3 /31 /200 9 OP W V Nas da qG S USD U nited S ta tes 1 10 5.8 197 .2 (2 .1) 54 .1% 0.0 x - 630
P e rf ect W orld C o., Ltd. 1 2/31 /200 8 PW R D Nas da qG S USD C hina 18 .90 99 7.1 210 .5 11 3.9 -4 .9% - - NA
P hotoChannel N etwork s Inc. 1 2/31 /200 8 T S XV : P N T S XV C AD C ana da 2 4 7.0 17. 2 (0 .8) NM 2.7 x - NA
Quepa s a C orp. 1 2/31 /200 8 QP S A Nas da qC M USD U nited S ta tes 0 .97 1 2.3 0.1 (1 1.4) 13 .1% - - 74
OA O R B C Information S ys tems 1 2/31 /200 7 R BC I R TS USD R us s ia 1 17 3.4 146 .9 1 9.2 46 .0% 0.0 x 0.3x NA
S handa Interactive E ntertainme nt L td. 1 2/31 /200 8 S N DA Nas da qG S USD C hina 49 .38 3,4 26.1 522 .7 24 0.2 13 .2% 0.2 x 0.4x NA
S hutte rf ly, Inc. 3 /31 /200 9 S F LY Nas da qG S USD U nited S ta tes 13 32 3.5 215 .2 2 8.3 6 .5% 1.2 x 9.1x 514
S K C ommunications Co., Ltd. 1 2/31 /200 8 A0 662 70 K OS E KR W S outh K orea 9 ,390 .00 31 3.1 186 .7 1 2.1 31 .4% 1.7 x 2 5.8 x NA
S N AP Inte ra ctive , Inc. 1 2/31 /200 8 S T VI OT C B B USD U nited S ta tes 1 8 .1 3.0 0 .9 -3 4.8% 2.2 x 7.0x 11
S N M G lobal H oldings 9 /30 /200 8 S N MN OT C P K USD U nited S ta tes 0 .00 0 .0 2.0 (0 .7) -6 0.5% 1.1 x - 33
S ocia l Media V e nures , Inc. 1 2/31 /200 8 S MV I OT C P K USD U nited S ta tes 0 0 .0 0.1 (0 .1) 43 .6% 0.0 x - NA
S ohu. com Inc. 3 /31 /200 9 S OHU Nas da qG S USD C hina 55 .32 2,1 16.8 460 .0 20 0.5 NM 3.8 x 8.7x 3 ,19 7
S ite s earch C orporation 1 /31 /200 9 S T PC OT C B B USD U nited S ta tes 3 2 8.2 NM (1 .1) 21 .5% - - 15
S park N etworks , Inc. 1 2/31 /200 8 LOV AME X USD U nited S ta tes 2 .75 5 6.5 57. 3 1 2.3 NM 1.0 x 4.6x 183
S pectrumDN A, Inc. 1 2/31 /200 8 S P XA OT C B B USD U nited S ta tes 0 2 0.5 0.1 (2 .5) 48 .9% - - 7
T encent Holdings L td. 1 2/31 /200 8 70 0 S E HK HKD C hina 71 .30 16,5 68. 2 1 ,04 7.8 51 2.5 -1 2.0% 17.2 x 3 5.3 x 6 ,19 4
T he P arent C ompany 8/2/2008 K ID S .Q OT C P K USD U nited S ta tes 0 0 .3 112 .0 (1 3.5) 33 .7% 0.2 x - 347
T he 9 L imited 1 2/31 /200 8 N CT Y Nas da qG S USD C hina 9 .46 25 3.7 250 .2 8 4.3 2 .9% - - NA
T he S treet.com, Inc. 3 /31 /200 9 TSCM Nas da qG M USD U nited S ta tes 2 6 2.8 67. 0 1 .9 -5 0.6% - - 310
T otal S port Online A S 3 /31 /200 6 T OS O OT C NO NOK N orwa y 0 .03 0 .1 2.1 (1 .1) -6 .2% 4.6 x - 16
T ree.C om, Inc. 3 /31 /200 9 TR EE Nas da qG M USD U nited S ta tes 12 13 0.5 215 .6 (1 3.3) 0 .4% 0.6 x - 700
U nis erve C ommunications Corp. 1 1/30 /200 8 T S XV : US S T S XV C AD C ana da 0 .04 0 .8 25. 8 0 .1 21 .9% 0.1 x 2 9.5 x NA
U nited Online Inc. 3 /31 /200 9 U NT D Nas da qG S USD U nited S ta tes 7 60 5.1 811 .2 17 7.3 -7 8.2% 1.1 x 5.0x 1 ,46 9
U OMO Media , Inc 1 /31 /200 9 U OMO OT C B B USD C ana da 0 .25 2 1.0 0.6 (0 .5) 17 .8% 33.6 x - NA
V a lueC lick Inc. 3 /31 /200 9 V C LK Nas da qG S USD U nited S ta tes 10 89 9.2 591 .7 10 5.5 NM 1.3 x 7.5x 1 ,18 9
V O IS , Inc. 1 2/31 /200 8 V OIS OT C B B USD U nited S ta tes 0 .32 2 .7 0.0 (1 .3) -1 9.8% - - 4
W ebze n Inc. 1 2/31 /200 8 W ZE N Nas da qG M USD S outh K orea 3 3 8.9 23. 1 (4 .6) -9 8.2% - - NA
W izza rd S of twa re Corpora tion 1 2/31 /200 8 W ZE AME X USD U nited S ta tes 0 .62 2 9.2 6.1 (6 .0) NM 4.8 x - 110
W orlds .com Inc. 1 2/31 /200 8 W DD D OT C B B USD U nited S ta tes 0 8 .9 0.1 (0 .7) NM - - 1
W ynds torm C orporation NA W YND OT C B B USD U nited S ta tes 0 .03 0 .5 NA NM 32 .0% - - NA
XIN G AG 1 2/31 /200 8 O1B C XT R A EUR G ermany 29 20 8.1 47. 6 1 5.2 22 .4% 3.1 x 9.8x 174
Y e dangOnline Corp. 1 2/31 /200 7 A0 527 70 K OS E KR W S outh K orea 8 ,900 .00 11 3.3 55. 6 1 2.4 -7 .6% 2.0 x 9.0x NA
Y nk K orea Inc. 1 2/31 /200 7 A0 237 70 K OS E KR W S outh K orea 6, 850 1 3.6 15. 8 (1 .2) NM 0.9 x - NA
ZipLocal Inc. 1 2/31 /200 8 T S XV : ZIP T S XV C AD C ana da 0 .01 0 .3 2.8 (3 .0) 0 .0% 0.6 x - NA
H igh 16,5 68. 2 1 ,737 .6 51 2.5 65 .0% 37.3 x 3 5.3 x 6 ,194
Low 0 .0 0.0 -15.9 -9 8.9% 0.0 x 0.3x 1
A vera ge 496.0 148.5 33.1 8.3% 5.2x 9.3x 682
Median 5 0.6 55. 6 0 .9 16 .0% 1.6 x 8.7x 210
Figure 1. Web 2.0 Universe Summary
Source. Capital IQ
3. Page 3
C A P I T A L M A R K E T S A C T I V I T Y (M & A A N D F I N A N C I N G )
C yberplex a big boost for financing activity in May: Month-to-date financings in May totalled $84.3 million and benefited
from a financing from Cyberplex for $12.9 million. So far, there have been 14 financings in May with seven deals greater
than $5 million and only three less than $5 million. Except for Cyberplex, no deals were greater than $10 million, with the
capital raise by Imeem and EveryZing closely behind at $8.8 million and $8.3 million, respectively. The average value for
April was $6.5 million on 21 financings. The March average was $6.6 million on 24 financings. Except for two deals
(Kaixin001.com and Collective Media), all were below $20 million for the last three months and a total of four deals were
greater than or equal to $15 million.
Financing Activity Last Three Months
180.0 6.7
6.6
160.0
6.5
140.0
6.4
120.0
6.3
100.0
(US$m)
(US$m)
6.2
80.0
6.1
60.0
6.0
40.0
5.9
20.0
5.8
0.0 5.7
Mar-09 Apr-09 May-09
Total Average
Figure 2. Financings, Last Three Months
Source. Company reports
C yberplex largest deal in May: After two weeks into May, Cyberplex tapped the equity markets for $12.9 million. Imeem,
a company from the social networks sector, follows with an $8.8 million raise, followed very closely by EveryZing at $8.3
million. Eleven of the 14 deals in the month are equal to or greater than $5 million. For additional details, see Figures 23
and 24 (at end of note). Further, the month of May also witnessed the spin-off of StumbleUpon from E-bay on a $29 million
valuation. E-bay had bought StumbleUpon for $75 million.
4. (US$m)
0.0
5.0
10.0
15.0
20.0
25.0
30.0
35.0
StumbleUpon
Kaixin001.com
Collective Media
Source. Company reports
GOOM Radio
Vidyo
Marin Software
The Rubicon Project
Cyberplex
Buzznet
FreeWheel
SendMe Inc.
Figure 3. Capital Market Activity, Last Three Months
LendingClub
Miva
Auditude
Conductor Inc.
Cellufun
Glam Media
SuperSecret
Visible Measures
Imeem
GoViral
EveryZing
ScanScout
Batanga
BlogHer Inc.
Gist
Fuhu Inc.
Azuki Systems
I Love Rewards
Greystripe
Viximo
OLX
DoubleTwist
TimeBridge
DocuSign
OMGPOP
the last few months: Ad Network, Media, Video, and Social Networks.
IMShopping
Socialtext
Apture
Mixercast
Simulmedia
Medialets
Tynt
SoundCloud
AnySource Media
Financing & M/A Summary - Last Three Months
Pixazza
TubeMogul
Tribal Nova
Tripbase
Hunch
Resonate Networks
Sports Composite
Bit.ly
Mo'Minis
Socialcast
Brandtology
Scan & Target
AdultSpace
Myngle
Jodange
33Across
Three Melons
Foodista
Apr-09
Mar-09
May-09
Page 4
companies raising over $78.7 million (Figure 4). The Media sector has the next highest totals, with eight companies
Ad Network is the most active sector: Activity over the last three months was busiest in the Ad Network sector, with 10
raising $63.4 million. It is important to note that the following sectors continue to generate the most capital activity over
5. Page 5
Capital Market Activity by Sector - Last Three Months
90.0
80.0
70.0
60.0
50.0
(US$m)
40.0 78.7
63.4
30.0
49.5 48.5
20.0
30.2 29.1
10.0 18.3
14.4 12.0 12.0 10.4 8.9 7.5 7.0 6.8 5.5 5.0 4.7 4.1 3.1 2.0 2.0 2.0 1.3 1.3
0.0
Comment/Reputation
Social Commerce
Gaming
Visual Commerce
Travel
Media
Mobile
Collaboration
Publishing
Microblog
Online Learning
Widget
Search
Lending
Infrastructure
Blog
Mobile Ad
SAS
Social Networks
Video
Virtual World
Aggregation
Crowdsourced
Ad Network
Analytics
Content
# companies
10 8 5 6 2 6 2 3 1 1 2 2 2 1 1 1 1 1 1 1 1 1 1 1 1
Figure 4. Capital Market Activity, by Sector, Last Three Months
Source. Company reports
C A P I T A L M A R K E T S A C T I V I T Y (P R I C E P E R F O R M A N C E )
Web 2.0 Index outperforms: Our W eb 2.0 index (market-cap weighted) essentially mirrored the performance of the
NASDAQ composite index from mid-2008 until recently when it has moved higher than the NASDAQ index (Figure 5).
6. Page 6
Web 2.0 Index Price Performance
120.0
100.0
80.0
60.0
40.0
20.0
-
Index: Web 2.0 X (Market Cap Weights) NASDAQ Composite Index - Share Pricing
Figure 5. Web 2.0 Price Performance
Source. Capital IQ
A positive week: The companies in our universe had mixed stock price performances over the past week (for stocks with
prices greater than $1) (Figure 6), with 24 companies showing positive returns on the week. Ynk Korea, Inc. (A023770-
KOSE) led the group with a 30.9% return, while Mixi, Inc. (2121-TSE) had the worst return, dropping 9.2% in the week.
7. Page 7
1 Week P rice P erformance
Y nk K orea Inc. 30.9%
Chines e G amer International 30.4%
G ungHo Online Entertainment, Inc. 21.5%
A Q Interactive, Inc. 18.9%
Northgate Technologies Limited 16.9%
L ingo Media Corporation 15.0%
HanbitS oft, Inc. 13.3%
Quepas a Corp. 11.1%
S hutterf ly , Inc. 10.7%
NetDragon WebS oft, Inc. 9.8%
PhotoChannel Netw orks Inc. 9.7%
Tencent Holdings Ltd. 8.2%
Eolith Co. Ltd. 7.3%
X ING A G 5.2%
K ings oft Co. Ltd. 4.0%
Tree.Com, Inc. 3.8%
G ree, Inc. 3.8%
S handa Interactive Entertainment Ltd. 2.7%
B ey ond Commerce, Inc. 2.5%
S K Communica tions Co., Ltd. 1.7%
G amania Digital Entertainment Co., Ltd. 1.3%
G iant Interactive G roup, Inc. 1.1%
Y edangOnline Corp. 0.8%
The9 Limited 0.5%
G ameOn Co Ltd. 0.0%
Open Tex t Corp. -0.4%
Changy ou.com Limited -1.1%
Neteas e.com Inc. -1.6%
V alueClick Inc. -1.9%
NEOWIZ G ames Corporation -2.6%
My riad G roup A G -2.9%
Openw ave S y s tems Inc. -3.2%
Webz en Inc. -3.4%
Modern Times G roup Mtg A B -3.8%
S ohu.com Inc. -4.7%
A ctoz S oft Co., Ltd. -5.1%
IA C/InterA ctiveCorp. -5.3%
Frogs ter Interactive Pictures A G -7.4%
Cy berplex Inc. -7.4%
G igaMedia Ltd. -7.6%
Ngi G roup Inc. -8.0%
Perf ect World Co., Ltd. -8.2%
TheS treet.c om, Inc. -8.4%
S park Netw orks , Inc. -8.7%
Mix i, Inc. -9.2%
-15.0% -10.0% -5.0% 0.0% 5.0% 10.0% 15.0% 20.0% 25.0% 30.0% 35.0%
Figure 6. 1-Week Price Performance
Source. Capital IQ
8. Page 8
INDUSTRY NEWS (PARTNERSHIPS, FINANCIAL RESULTS, NEW PRODUCTS)
K ey Developments
C ompany Headline Notes
Open T ext C orp. (Nas daqG S : OT E X) O pen T ext C orp. to S how E C M S uite for U se with S AP (R ) O pen T ext C orp. announced tha t it will be work ing with S AP cus tomers to demons trate the O pen T ext E C M S uite for us e with S AP (R )
S olutions At S AP P H IR E (R ) 2009 O rlando C onference solutions during the S AP P H IR E (R ) 2009 O rla nd o and the 2009 A S UG Annual c onferences . During S AP P H I R E 2009, cus tomers will ha ve the
opportunity to lea rn firs thand how the O pen T ex t E C M S uite for use with S AP s oluti ons provides trans parent acces s to enterpris e content of
a ll k inds - whether c ustomer c orrespondence, s ca nned ima ges of inv oices , c ontra cts , or word proc es sing documents and sprea ds heets -
from within us ers' fa milia r S AP a pplic ations. T his s ignific antly boosts produc tiv ity beca us e the c ontent they need is automa tic ally a va ila ble in
the context of their work . O pen T ext de livers E C M extensions that integrate with a nd c ompl ement S A P s olutions , helping orga niza tions
reduce risk , inc rease opera tiona l effic ienc y a nd driv e I T c onsolidation. Among the sav ings being highlighted at the O pen Tex t booth (No. 336)
this week inc lude: L owered AP proces sing cos ts as well as cost of goods, with the S AP I nvoic e M a na gement a pplication by O pen T ext;
E limin a tion of legac y sy stem c ost (maintena nce, servers, c ons ulting, etc) with Lega cy D ecommiss ioning; R eduction of 50% or more in cons ult
Modern Times G ro up Mtg AB (OM: MTG Modern Times M ulls Acquisitions Modern Times G roup Mtg AB pla ns to ma k e ac quis itions . Modern T imes G roup a nnounc ed that the 2009 Annual G enera l M eeting of MT G
B) sha reholders voted to s upport all of the resol utions propos ed to the Meeting. T he firm s a id, “T he Meeting also approved the B oa rd of
Direc tors ' propos a l tha t the B oard be able to pa s s a resolution on one or more occa sions during the period up until the next Annua l G eneral
Meeting to trans fer the Compa ny 's own C las s A a nd/or C las s B shares within the quoted s hare pric e spread on the N AS D AQ O M X
S tockhol m in connection with potential a cquisitions . This authoriz a tion incl udes the right to res olve on the disapplica tion of the preferentia l
rights of shareholders and tha t payment s ha ll be able to be made in forms other tha n cas h. T he purpos e of thes e authoriz a tions is to provide
the B oa rd of Direc tors with inc reased freedom to adapt the C ompa ny 's ca pital structure a nd thereby increas e s ha reholder value, a nd/or to
fina nc e potential a cquisitions .”
Modern Times G ro up Mtg AB (OM: MTG Modern Times G roup Mtg A B announces an E quity Modern Times G roup Mtg AB (O M : MT G B ) wa s gra nted shareholder approval to repurchase own shares at its A nnua l G eneral Meeting held
B) B uybac k on M ay 11, 2009m. Under the progra m, the c ompany will repurc ha s e M TG C la s s A and/or Cla s s B shares , provided that the G roup's holding
does not a t a ny time exceed 10% of the tota l number of iss ued a nd outsta nding sha res . T he repurchase of s ha res sha ll take pla ce on the
O MX N ordic E x change S toc k holm and ma y only occ ur at a price wi thin the sha re price interva l regis tered at tha t time, where s hare pric e
interv al means the differe nce between the highes t buy ing pric e a n d lowes t s elling pri ce. T he c ompany wa s a ls o a uthoriz ed to repurchas e its
own Cla s s C s hares. T he repurc ha s e may only be effected through a public offer direc ted to a ll holders of C lass C sha res a nd sha l l c ompris e
a ll outstanding Clas s C s ha res. T he pu rchas e ma y be affected a t a purc ha se pric e c orresponding to not les s than S E K 5. 00 a nd not more
tha n S E K 5.10. T he total price will not exc eed S E K 1. 89 million and pay ment for the C las s C s hares s hall be ma de in ca s h. T he purpos e of
the repurcha s e is to ensu re the delivery of Clas s B s ha re s under the P lan. T he share buyba ck a uthority i s va lid until the conclus ion of the next A nnua l
Northgate Tec hno logies Limited Northga te T echnologies Limited R eports Una udited Northga te Technologies Limited reported una udited cons olida ted a nd standa lone ea rnings results for the third quarter and nine months
(B S E :590057) Cons olida ted a nd S tanda lone E a rnings R esults for the ended D ecember 31, 2008. O n cons olidated ba s is, the compa ny reported a net profit and E B I T of I NR 124. 3 million or I N R 3.44 per diluted
T hird Q ua rter a nd Nine Months E nded December 31, sha re on rev enues of I NR 1, 484.0 million for the qua rter compared to net profit of I NR 140. 6 million or I NR 3. 94 per diluted s hare on
2008 revenues of I NR 1,404. 8 million and E B I T of I NR 140. 0 million in the sa me period a year ago. C onsolidated E B IT DA for the qua rter rais ed to
IN R 310.8 million, a y ear-on-yea r increa se of 60% .
F or the nine months ended December 31, 2008 on c ons olidated ba sis , the c ompany reported a net profit of I N R 572.7 mi llion or IN R 16.12
per diluted s hare on revenues of I NR 5, 112.7 million a nd E B I T of IN R 572. 3 million compared to net profit of IN R 526.6 million or I NR 15. 26
per diluted s hare on revenues of I NR 3, 885.8 million a nd E B I T of IN R 525. 6 million in the s ame period a y ea r a g o. Cons olidated E B I TD A for
the period ra is ed to IN R 1,148. 7 million, a y ear-on-yea r increa s e of 83% .
Magnitude Information S ys tems Inc. Ma gnitude I nformation S ys tems I nc. announced delayed O n 05/12/2009, Magnitude I nforma tion S y stems Inc . a nnounc ed that they will be unable to file their next 10-Q by the dea dline required by the
(OT CB B: MAG Y) 10-Q filing S E C.
S hanghai Telecom mun ic ation Co., T he9 Limited a nd T he9 L imited J ointly P romote 3G S hanghai T elec ommunic ation Co. Ltd. a nd T he9 Limited jointly promote a 3G service. U s er c an pa y for the service while la mbing down their
L td.; The9 L im ited (N as daqG S :N CTY ) S ervice tolls generated by mobile phone ca lls . B oth s ides wil l c oopera te in the publiciz ing and ma rketing of the service. In the future, they will sh a re
sales network s . S ha ngha i T elec om will s oon promote other va lue-a dded s ervic es lik e mobile pa yment, location-base d information serv ice,
mobile c ommunity, a nd mobile games .
Hurray! Holding Co. L td. S handa S peculated T o B e Ac quiring Hurra y! T here was widespread spec ulation that H urra y ! Holding Co. may be a cquired by S handa Interactive E ntertainment Ltd. Hurra y ’s American
(Nas daqG M:HR AY ); S han da Interactive deposita ry receipts ros e by 30% to $2. 87 in N AS DAQ s tock market trading. “C aijing magazine reported that S handa is looki ng a trans a ction
E ntertain ment Ltd. (Nas daqG S : S N DA) a nd a dea l is likely to be finalized in the next two week s.
is eemedia Inc . (T S XV: IE E ); R emoba iseemedia Inc. 's is eedoc s(T M) T ec hnology G oes Liv e in iseemedia Inc. and R emoba I nc. a nnounced that the new la unch of R emoM a il(TM ) and R emoS y nc(T M) solutions by R emoba utilizing
Inc. R emoba 's La test M obile E ma il S olution iseemedia 's is eedocs (TM ) rich ema il attac hment viewing ca pa bilities , is now av ailable on the V eriz on wireless network . T hese new mobile
email s ervices, integra ting is eedocs (T M) tec hnology, ena bles Microsoft E xchange ema ils with rich document a tta chments to be viewed on
B R E W (T M) enabled mobile phones tha t V erizon sell s. T hey turn every B R E W (T M) enabled mobile phone into a S martphone. T hes e new
email attac hment solutions ha ve now begun to provide both c ompa nies with a recurring royalty-bas ed revenue strea m per email a ccount
monthly.
S ocialwis e, Inc. (OT CB B: IDA E ) IdeaE dge I nc. will C ha nge its T ick er to S C LW from ID AE E ffectiv e M a y 13, 2009, IdeaE dge I nc. will change its O T C B B s tock ticker sy mbol to S C L W from I DAE .
C DC C orp. (Nas daqG S : CHIN.A) CD C Corp. A nnounces E arni ngs R es ults for the F irs t CD C Corp. a nnounc ed earnings results for the firs t quarter ended M a rch 31, 2009. F or the quarter, the company's rev enue totaled $79. 0
Q uarter E nded Marc h 31, 2009 million a 20% dec line over revenues of $98. 2 million in the firs t qua rter of 2008. T he compa ny's net income wa s $7. 9 million or $0. 07 per
sha re, a n improvement over a net loss of $11.9 million or $0.11 per sha re in the corres ponding qua rter of the prior y ea r.
B etawave Corporatio n (OT CB B: B WA V) B etawa ve Corporation R eports Una udited Cons olida ted B etawa ve Corporation reported un audited cons olida ted earnings res ults for the first quarter en ded M arch 31, 2009. F or the quarter, the
E a rnings R esults for the F irst Q uarter E nded M arch 31, company reported net los s of $4, 413,667 or $0.15 net los s per s ha re ba s ic a nd dilute d a nd net cas h used in operating a ctivities of
2009 $4,647, 942 on revenues of $1,388, 420 against net l oss of $4, 179, 398 or $0.17 net los s per s hare ba sic and diluted and net c ash used in
opera ting activi ties of $641, 002 on revenues of $657, 150 aga ins t a year. T otal revenue increa sed 111% to $1,388, 420 for the three months
ended M a rch 31, 2009 from $657, 150 for the firs t quarter of 2 008.
C yberplex Inc . (TS X: C X) Cy berplex Mulls Acquis itions Cy berplex Inc. announced tha t it ha s entered into an a greement with a s yndica te of underwriters led by G MP S ec urities L .P . , whic h hav e
a greed to purchas e, on a bought dea l basis , 9, 375,000 common s hares of the Compa ny at a purchas e price of $1.60 per c ommon s ha re, for
a ggrega te gross proceeds of $15, 000, 000. T he Compa ny intends to us e the net proceeds of the prospectus for general c orpora te purpos es
a nd potential acquisitions .
C yberplex Inc . (TS X: C X) Cy berplex Inc. ha s filed a F ollow-on E quity O ffering in the Cy berplex Inc. ha s filed a F ollow-on E quity O ffering in the a mount of CAD 15. 00 million.
a mount of CAD 15 .00 millio n.
C DC C orp. (Nas daqG S : CHIN.A) CD C Corp. R eports E a rnings R esults for the F irst Q ua rter CD C Corp. reported ea rnings results for the first qua rter of 2009. F or the period, the compa ny reported Adjus ted E B I T D A from c ontinuing
of 2009 opera tions of $6.7 mill ion c ompa red to $0. 9 million, for the firs t qua rter of 2008. I n the firs t quarter of 2009, the compa ny als o recorded
opera ting cas h flows of $2.1 million c ompa red to $5.3 milli on in opera ting ca sh flows in the firs t quarter of 2008.
9. Page 9
Neteas e. com Inc. (Nas daqG S : NT E S ); Netea se. c om I nc. E nters into A S trategic P a rtners hip Netea se. com Inc. ha s entered into a s trategic partnership a greement with On2 T echnologies I nc . NetE ase will deploy On2's V P 6 enc oding
On 2 Tech nolo gies In c. (AME X:ONT ) Agreement with O n2 T ec hnologies I nc forma t a nd F lix E ngine trans c oding s oftwa re in a number of its v ideo channels . On2 V P 6(R ) is a proprieta ry video format developed by On2
a nd licensed by Adobe(R ) for F la s h(R ) P la yer a nd S un for J avaF X , a ss uring ha ss le-free pla ybac k . On2 V P 6 offers s uperior compres sion
performance to S orens on S pa rk and H .264 B as eline profile. O n2 F lix E ngine is a leading s erver-s ide tra ns coding s olution for crea ting a nd
publishing web video. Flix E ngine ena bles s upport for a broad ra nge of input formats including M P E G -2, MP E G -4, H. 263, H .264, Q uick Time,
W indows M edia a nd more. Flix E ngine outputs On2 V P 6, H .264, a nd S orens on S pa rk ba sed video for Adobe F la s h P l ayer as well as H. 264
video for Apple(R ) iP od(R ) and iP hone(TM ), 3G P video for mobile devices a nd video S un J avaF X.
K aboo s e Inc. (T S X:K AB) K a boos e I nc. A nnounces U na udited C onsolida ted K a boose Inc . a nnounc ed unaudi ted cons olidated ea rnings res ults for the first qua rter ended M a rch 31, 2009. F or the period, the compa ny
E a rnings R esults for the F irst Quarter E nded M arch 31, reported loss before income ta x es of CAD 4,062, 000 a ga ins t C AD 4,706, 000 a y ear ago. Los s from c ontinuing operations wa s C AD
2009 4,652, 000 or CA D 0.03 per ba s ic a nd diluted s hare agains t CA D 3,934, 000 or CAD 0.03 per bas ic and diluted s hare a year ago. Net loss
wa s C AD 4,912, 000 or C AD 0.03 per b a sic a nd diluted s ha re on revenues of C AD 16, 751, 000 a ga ins t CA D 3,787, 000 or C AD 0.03 per ba s ic
a nd diluted s ha re on revenues of C A D 16,297, 000 a year a go. N et ca s h provided by operating a ctivities was CA D 2,760, 000 agains t net
cas h us ed in operating activities of C AD 3,084, 000 a yea r a go. P urchas es of property , plant a nd equipment, net of tax credits were
a mounted to CAD 334, 000 ag ainst C AD 537, 000 a yea r ago.
T enc en t Ho ldings Ltd. (S E H K: 700) T enc ent H oldings Ltd. Announces E a rnings R es ults for T enc ent Holdin gs Ltd. announced ea rnings results for the firs t qua rter ended March 2009. F or the quarter, the company reported net income
the F irst Q ua rter E nded M a rch 2009 of HK D 1. 05 billion ($135. 5 million), or 57 cents a s hare, compa red to H K D 534 million, or 30 cents, in the y ear-earlier period. R ev enue
through Ja nuary to Ma rch tota led HK D 2.5 billion, up from H K D 1. 4 billion.
T enc en t Ho ldings Ltd. (S E H K: 700) T enc ent H oldings Ltd. announces a n E quity B uybac k T enc ent Holdin gs Ltd. (S E HK : 700) was granted s ha reholder a pprova l for a n E quity B uybac k a t the Ann ua l G eneral Meeting held on Ma y 13,
2009. Under the progra m, the compa ny will repurchas e 180, 093,334 s hares, repres enting 10% of the is sued s ha re ca pital of the C ompany .
Any repurcha s e will be made out of funds which a re lega lly available for the purpos e in a ccordance with the memorandum of as socia tion and
bye-la ws of the Compa ny a nd the Companies A ct. T he repurc ha ses will be in a cc orda nce with l aws a nd requirements and regulations of the
S tock E xc ha nge of Hong K ong L imited or on any other stoc k exc ha nge on whic h the sha res of the Compa ny may be lis ted and recogniz ed
by the S ec uri ties and F utures C ommis sion a nd the S tock E x cha nge of Hong K ong L imited for this purpose, s ubject to and in ac corda nc e
with a ll applicabl e la ws a nd requirements of the S ec urities and F utures C ommis s ion, T he S tock E x change of H ong K ong L imited or a ny other
stock exch ange a s a mended from time to time. T he s hare buy ba ck progra m shall be valid until the ea rlies t of the conclus ion of the next
Annual G enera l Meeting, or the expiration of the period within whic h the next Annua l G eneral Meeting of the C ompa ny is required by the B ye-l
J u mpTV Inc . (TS X : J TV) J umpT V I nc. Announces E arnings R es ults for the F irst J umpTV I nc. annou nced ea rnings resu lts for the firs t qua rter ended March 31, 2009. F or the qua rter, the company reported revenue of $6. 6
Quarter E nded Marc h 31, 2009 million c ompared to $1. 9 million in the s ame period in 2008, mark ing a y ear ov er y ear inc reas e of 247% . T he net loss wa s $5. 8 million
(including $1.7 million of non-cas h charges (1)) or $0.05 per s hare ba sic and diluted for the firs t qua rter of 2009 compa red to $1.5 million
(including $0.7 million of non-cas h charges (1)) or $0.03 per s hare ba sic and diluted for the sa me period in 2008. The revenue a nd net loss
for the three months ended M arch 31, 2008 reflec t the res ults of o pera tions of N euL ion Inc. the ac counting a cquirer, prior to the merger
between N euLion I nc. and J umpTV Inc. on O ctober 20, 2008.
S ocialwis e, Inc. (OT CB B: IDA E ) S oci a lwis e, Inc . has C ha nged its T ick er to S CL W from E ffectiv e M a y 13, 2009, S ocia lwis e, Inc . c ha nged its O T C B B s tock ti ck er s ymbol to S C LW from ID AE .
ID AE
S ocialwis e, Inc. (OT CB B: IDA E ) IdeaE dge , Inc. ha s C hanged its N a me to S ocia lwis e, Inc . On M ay 13, 2009, I dea E dge, Inc . c ha nged its name to S ocialwise, Inc.
T enc en t Ho ldings Ltd. (S E H K: 700) T enc ent H oldings Ltd. R eports Una udited Cons olida ted T enc ent Holdin gs Ltd. reported una udited cons olida ted earnings res ults for the first quarter ended M a rch 31, 2009. F or the quarter, the
E a rnings R esults for the F irst Quarter E nded M arch 31, company reported profit before inc ome tax of R M B 1. 2 billion compared to R MB 0.64 billion in the s a me period a y ear ago.
2009
P hotoC han nel N etworks Inc. P hotochannel Network s Inc . R eports U naudited E arnings P hotoC ha nnel N etworks Inc . reported una udited earnings res ults for the s econd qua rter and six months ended M arch 31, 2009. F or the
(T S XV: PN) R es ults for the S econd Q ua rter a nd S ix Months E nded quarter, the c ompany has pos ted tota l revenue of CAD 5, 015, 041 c ompared to C AD 3,259, 499 for the s econd quarter of 2008. G AAP net
Ma rc h 31, 2009 loss for the qua rter of CA D 1,475, 124 c ompa red to C AD 2, 622,228 for the s a me period of fis c al 2008. N on-G AAP net profi t for the quarter
wa s C AD 543,278, compared to a non-G AAP net los s of C AD 1,285, 808 in the s econd qua rter of 2008. B asic and diluted net l oss per sha re
wa s C AD 0.04 compared to bas ic a nd diluted net loss per s ha re of CAD 0. 08 for the compa ra ble period in F is c al 2008. N on-G AAP a djusted
E a rnings per s hare, defined a s net profit, exc luding amortization and s hare-based c ompens ation expen se, of C AD 0. 02 c ompared to a Non-
G AAP a dj usted net los s per sha re of C AD 0.04 for the compa ra ble period for F is c al 2008.
F or the six month, the company ha s posted tota l rev enue of C AD 12, 191,374 compared to CAD 7, 558, 093 for the s ame period of 2008.
G AAP net loss for the quarter of C AD 534,480 compared to C AD 3,704, 828 for the sa me peri od of fisca l 2008. Non-G AA P net profit for the
quarter wa s C AD 3, 336,333, c ompared to a non-G AAP net los s of CAD 1,403, 291 for the same pe ri od of 2008. B asic and diluted net los s per
T heS treet.c om, Inc . (Nas daqG M: T S CM) T heS treet.com, Inc. Announc es E xec utive C ha nges T heS treet. com, I nc. announced tha t E ric As hman res igned as the company's C hief F ina ncial Offic er, effectiv e M a y 8, 2009. E ffective the
same day, R ichard B roitma n, the company's V ice P resident of F ina nc e, was app ointed to the interim pos ition of the compa ny 's Acting Chief
Accounti ng O fficer. Mr. B roitman, who is 56, joi ned the c ompa ny a s its Controller in J uly 2000 a nd wa s appointed V ice P res ident of F inance
in Oc tober 2007. B efore joinin g the compa ny, M r. B roitman was C ontroller of I ndividua l Investor G roup.
X ING AG (XTR A: O1B C) X IN G AG R ep orts E arnings R es ults for the F irs t Quarter XI NG AG reported earnings res ults for the firs t quarter of 2009. For the year, the company reported profit of E U R 1.68 million, a n inc rea s e of
of 2009 3.7% from E UR 1. 62 million for the s ame period a y ea r a go. R eve nues for the quarter were E U R 10.76 million compa red to E U R 7. 51 million
for the same period a yea r ago.
S park Networks , Inc . (AME X: L OV) S park N etwork s , Inc . R eports U naudited C onsolidated S park Network s, Inc . reported unaudited c ons olidated ea rnings res ults for the firs t qua rter ended March 31, 2009. F or the qua rter, the
E a rnings R esults for the F irst Quarter E nded M arch 31, company reported net inc ome of $311, 000 a nd operating income of $1, 208, 000 or $0.02 ba s ic a nd diluted earnings per s ha re on net revenue
2009 ; Announces I mpairment C ha rges of $12,032, 000 compa red to net income of $1,566, 000 a nd operating income of $2, 477, 000 or $0.06 ba s ic a nd diluted earnings per s ha re on
net revenue of $15, 022,000 for the s a me period a y ea r a go. I ncome before inc ome tax es for the period wa s $716, 000 compa red to
$2,811, 000 for the same period a yea r a go. E B I TD A for the period wa s $1,174, 000 and a djus ted E B I TD A wa s $2, 801,000 compared to
E B IT DA of $3, 335,000 and adjusted E B IT DA of $4, 042,000 for the s a me period a y ea r a go. F irst qua rter 2009 net earnings were reduced by
a n $880, 000 as s et impai rment c ha rge prima rily rela ted to Hurry Da te ac quis ition.
T he company a ls o a nnounc ed that first quarter 2009 net ea rn ings were reduced by an $880, 000 a ss et impa irme nt cha rge prima rily rela ted to
Hurry Da te ac quisition.
Figure 7. Key Developments
Source. Capital IQ