Download to read offline

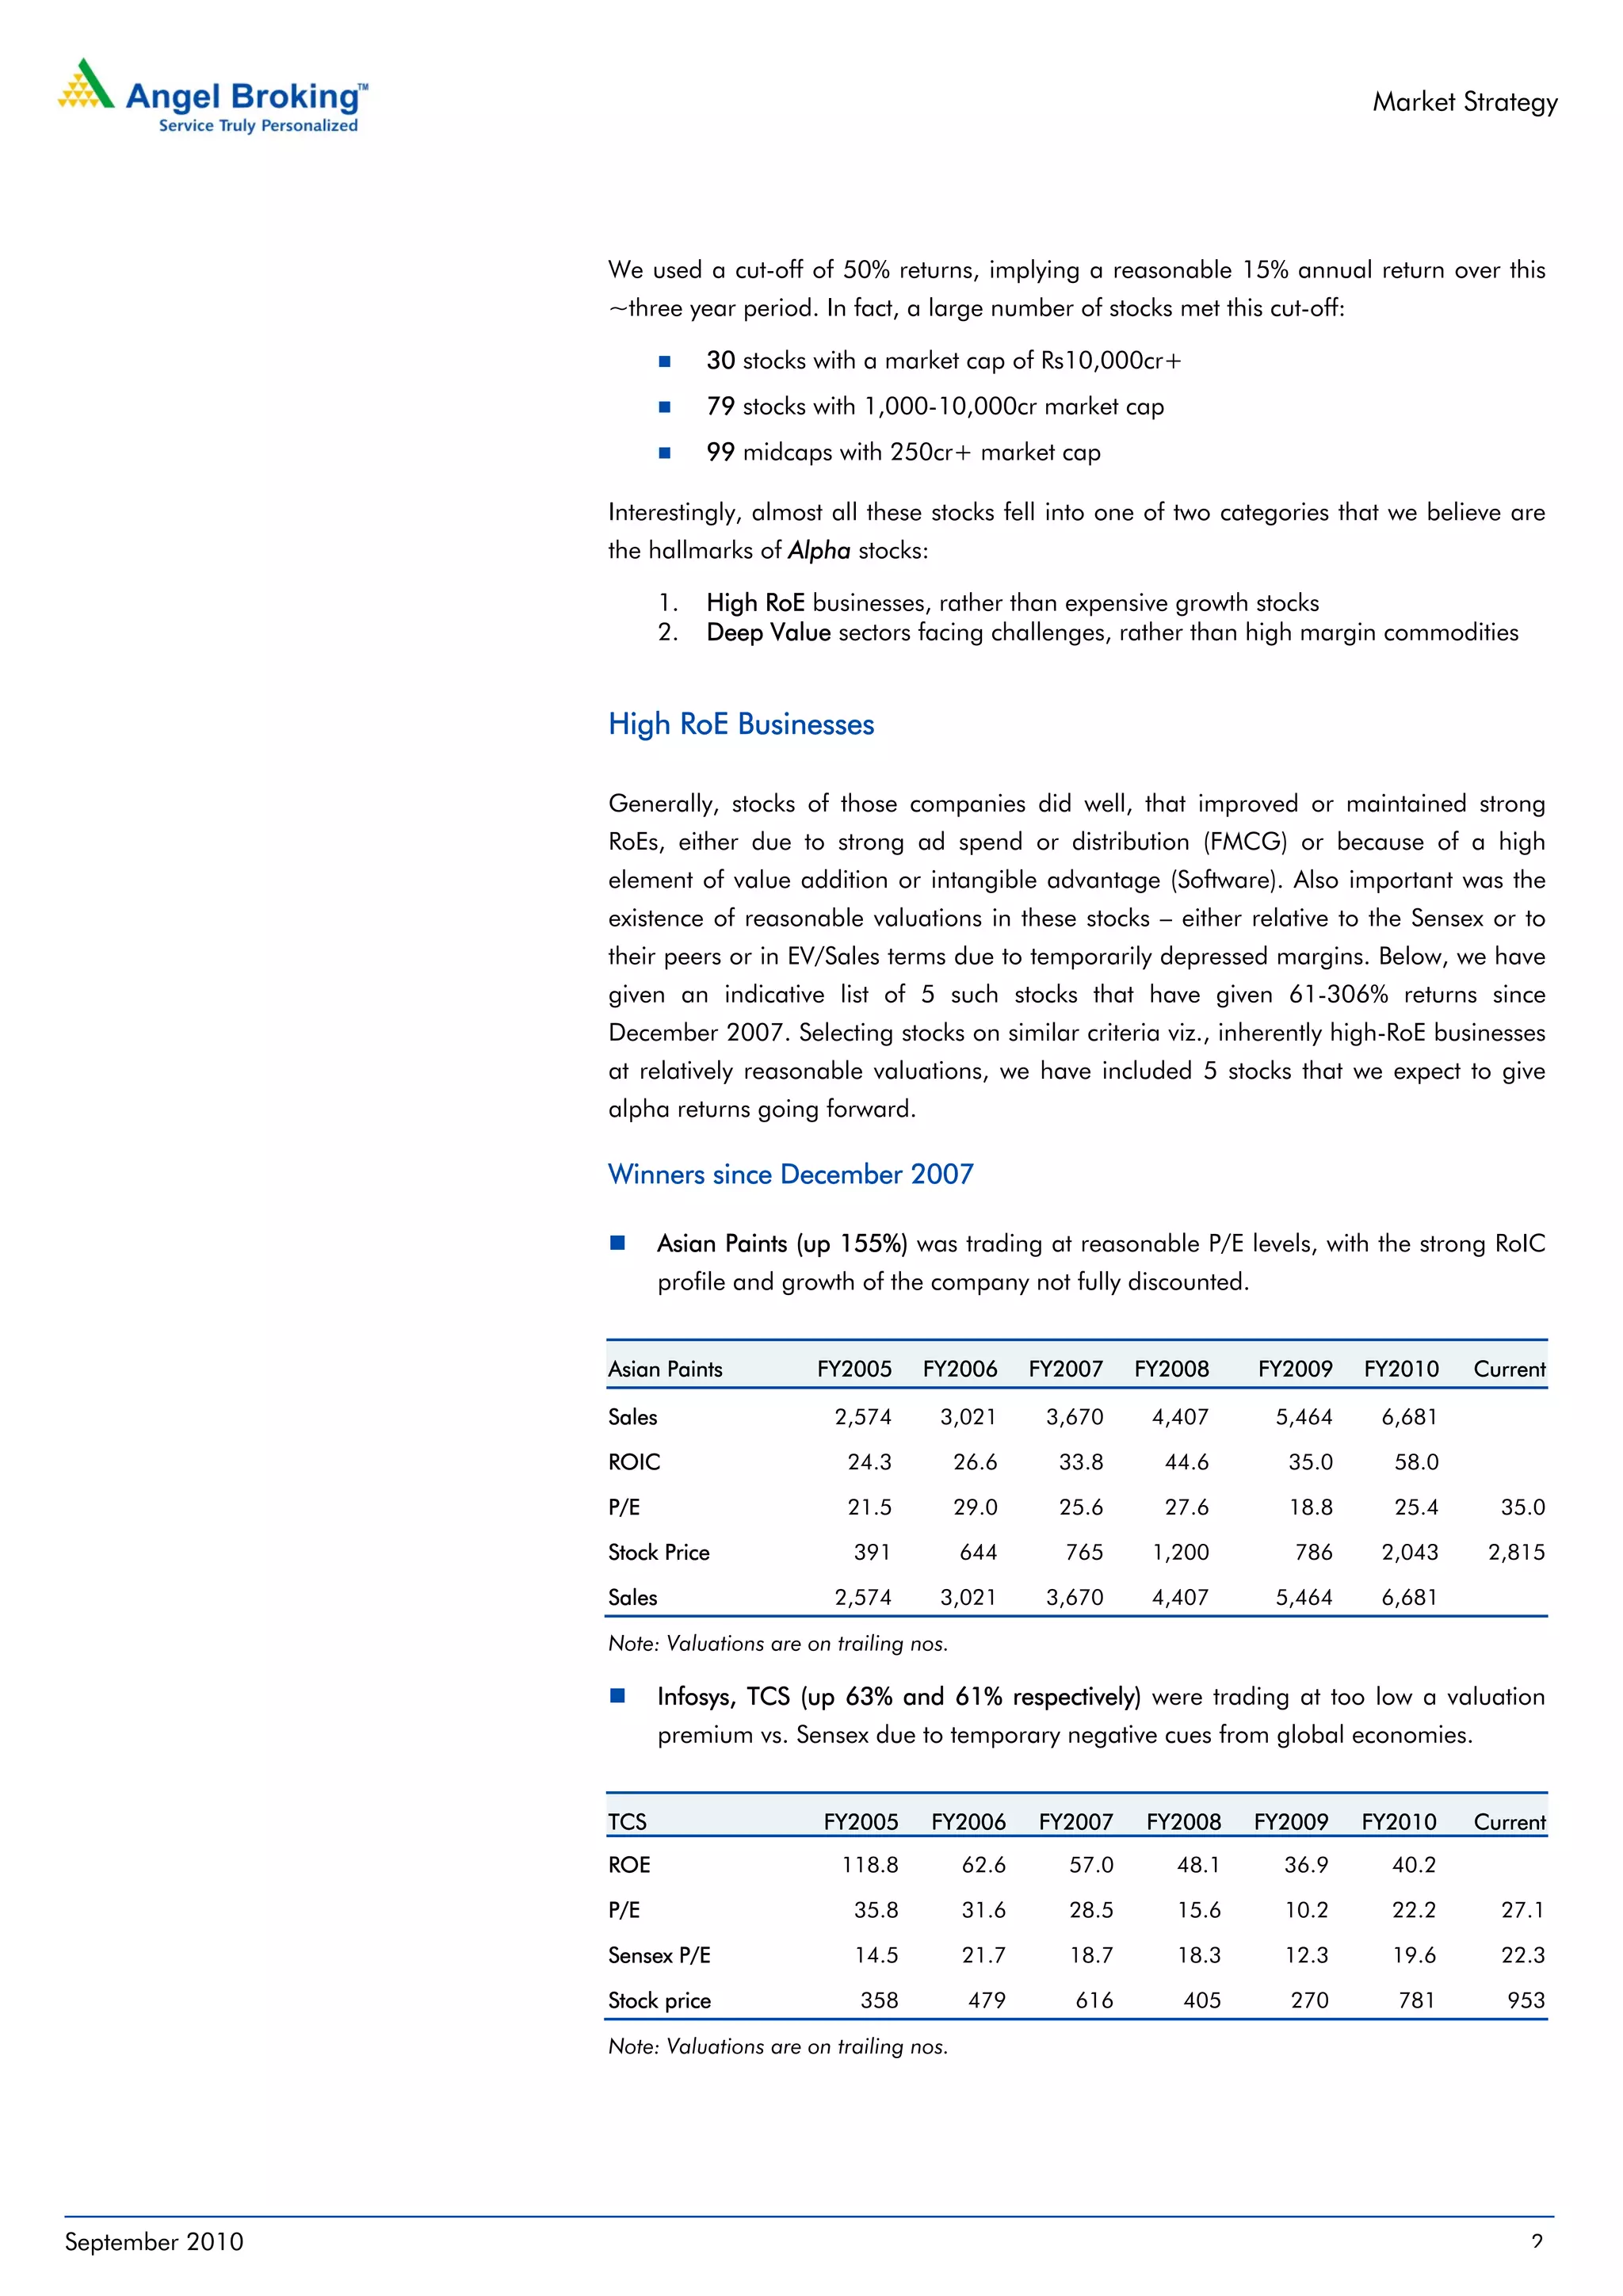
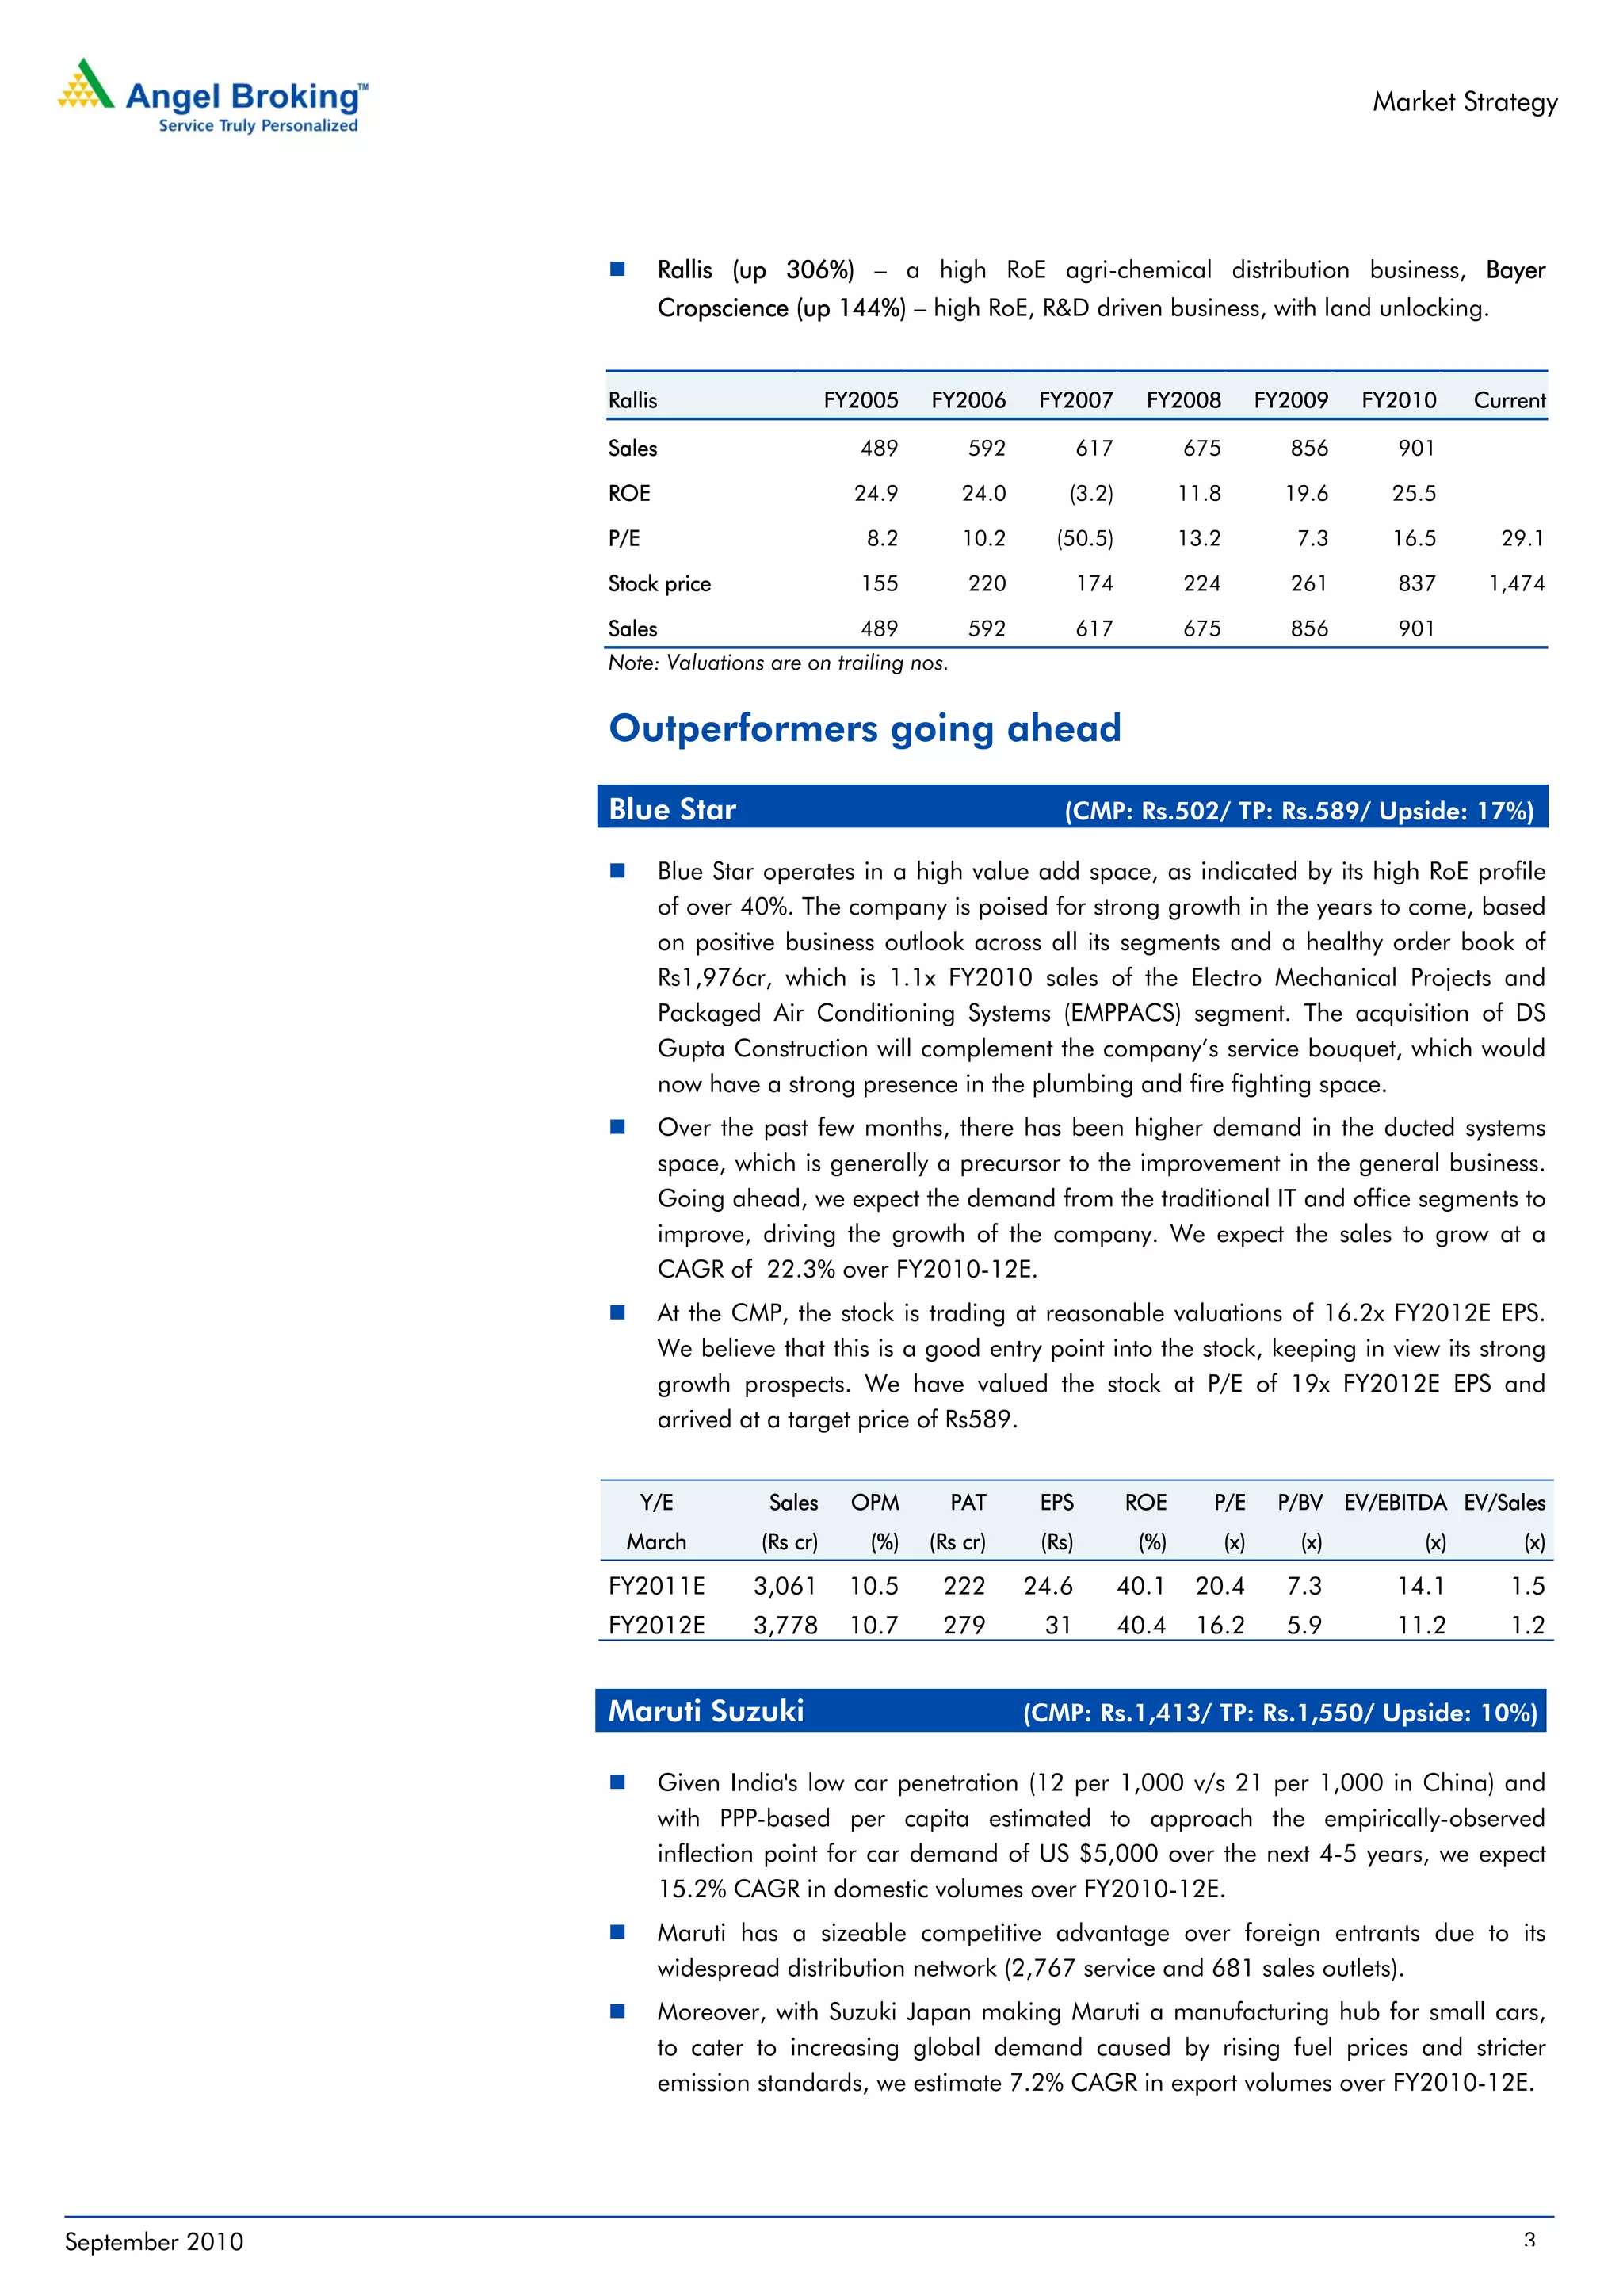


This document discusses market strategy and identifies stocks that have the potential to generate positive returns even if the BSE Sensex remains at its current level of 20,000. It analyzes stocks that have performed well since the last time the Sensex was at this level in December 2007. Many stocks have doubled or tripled in value since then. Stocks that fell into two categories in particular tended to perform well: 1) companies with high returns on equity (RoE), and 2) deep value sectors facing challenges. The document provides examples of stocks in these categories that increased 61-306% and identifies similar stocks that are expected to provide "alpha returns" going forward.


