The document provides an overview of the Turkish business environment and retail sector. Key points include:
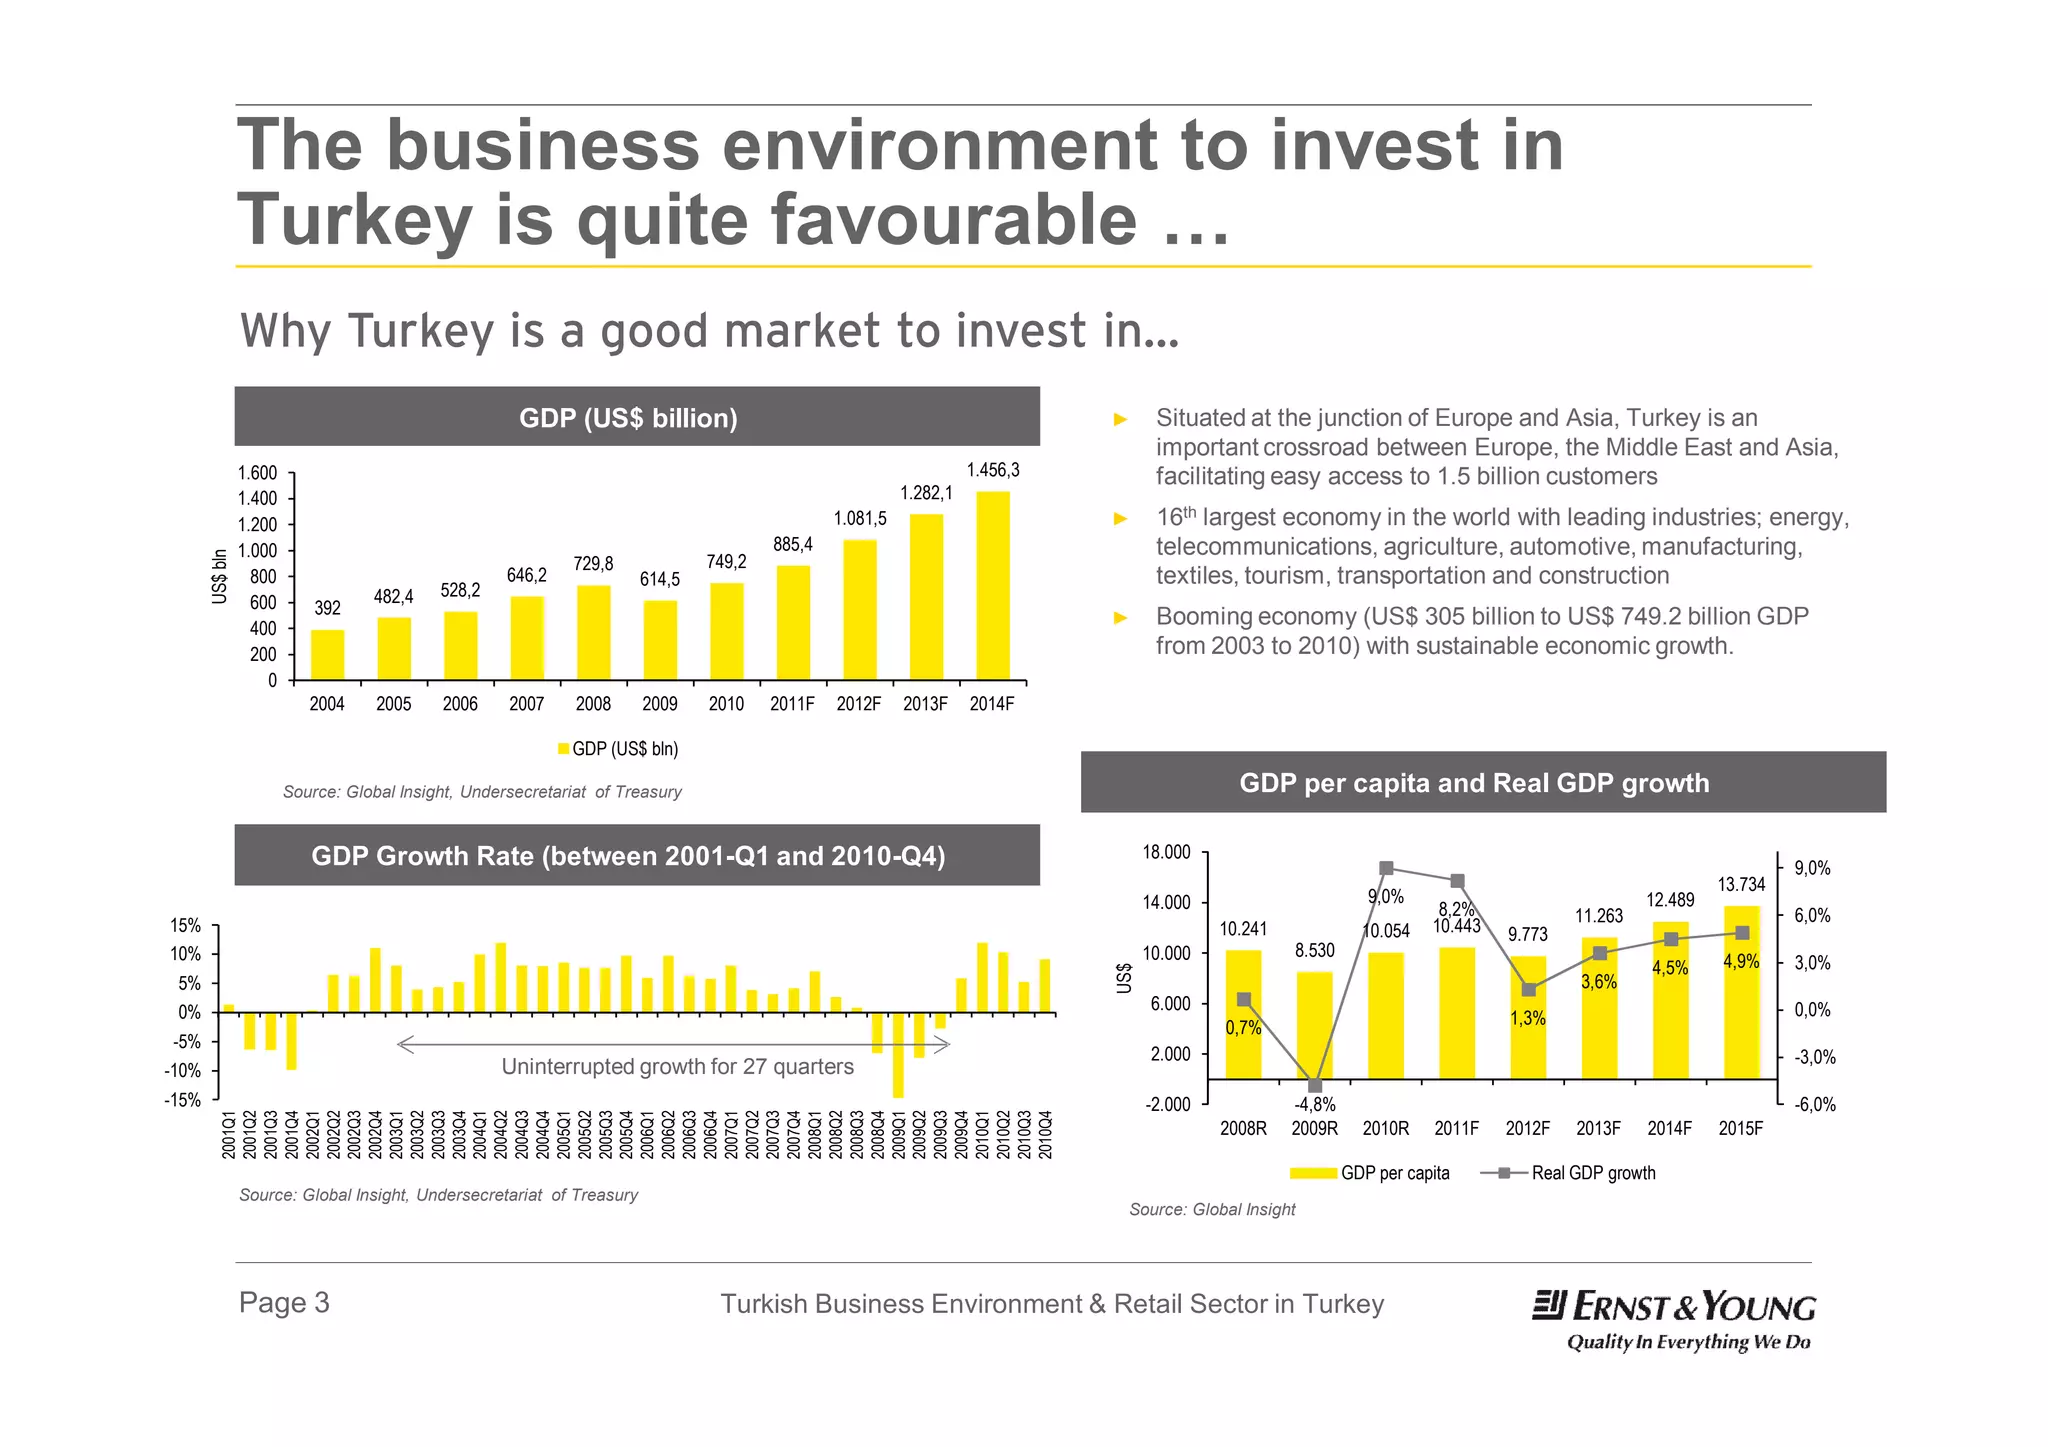
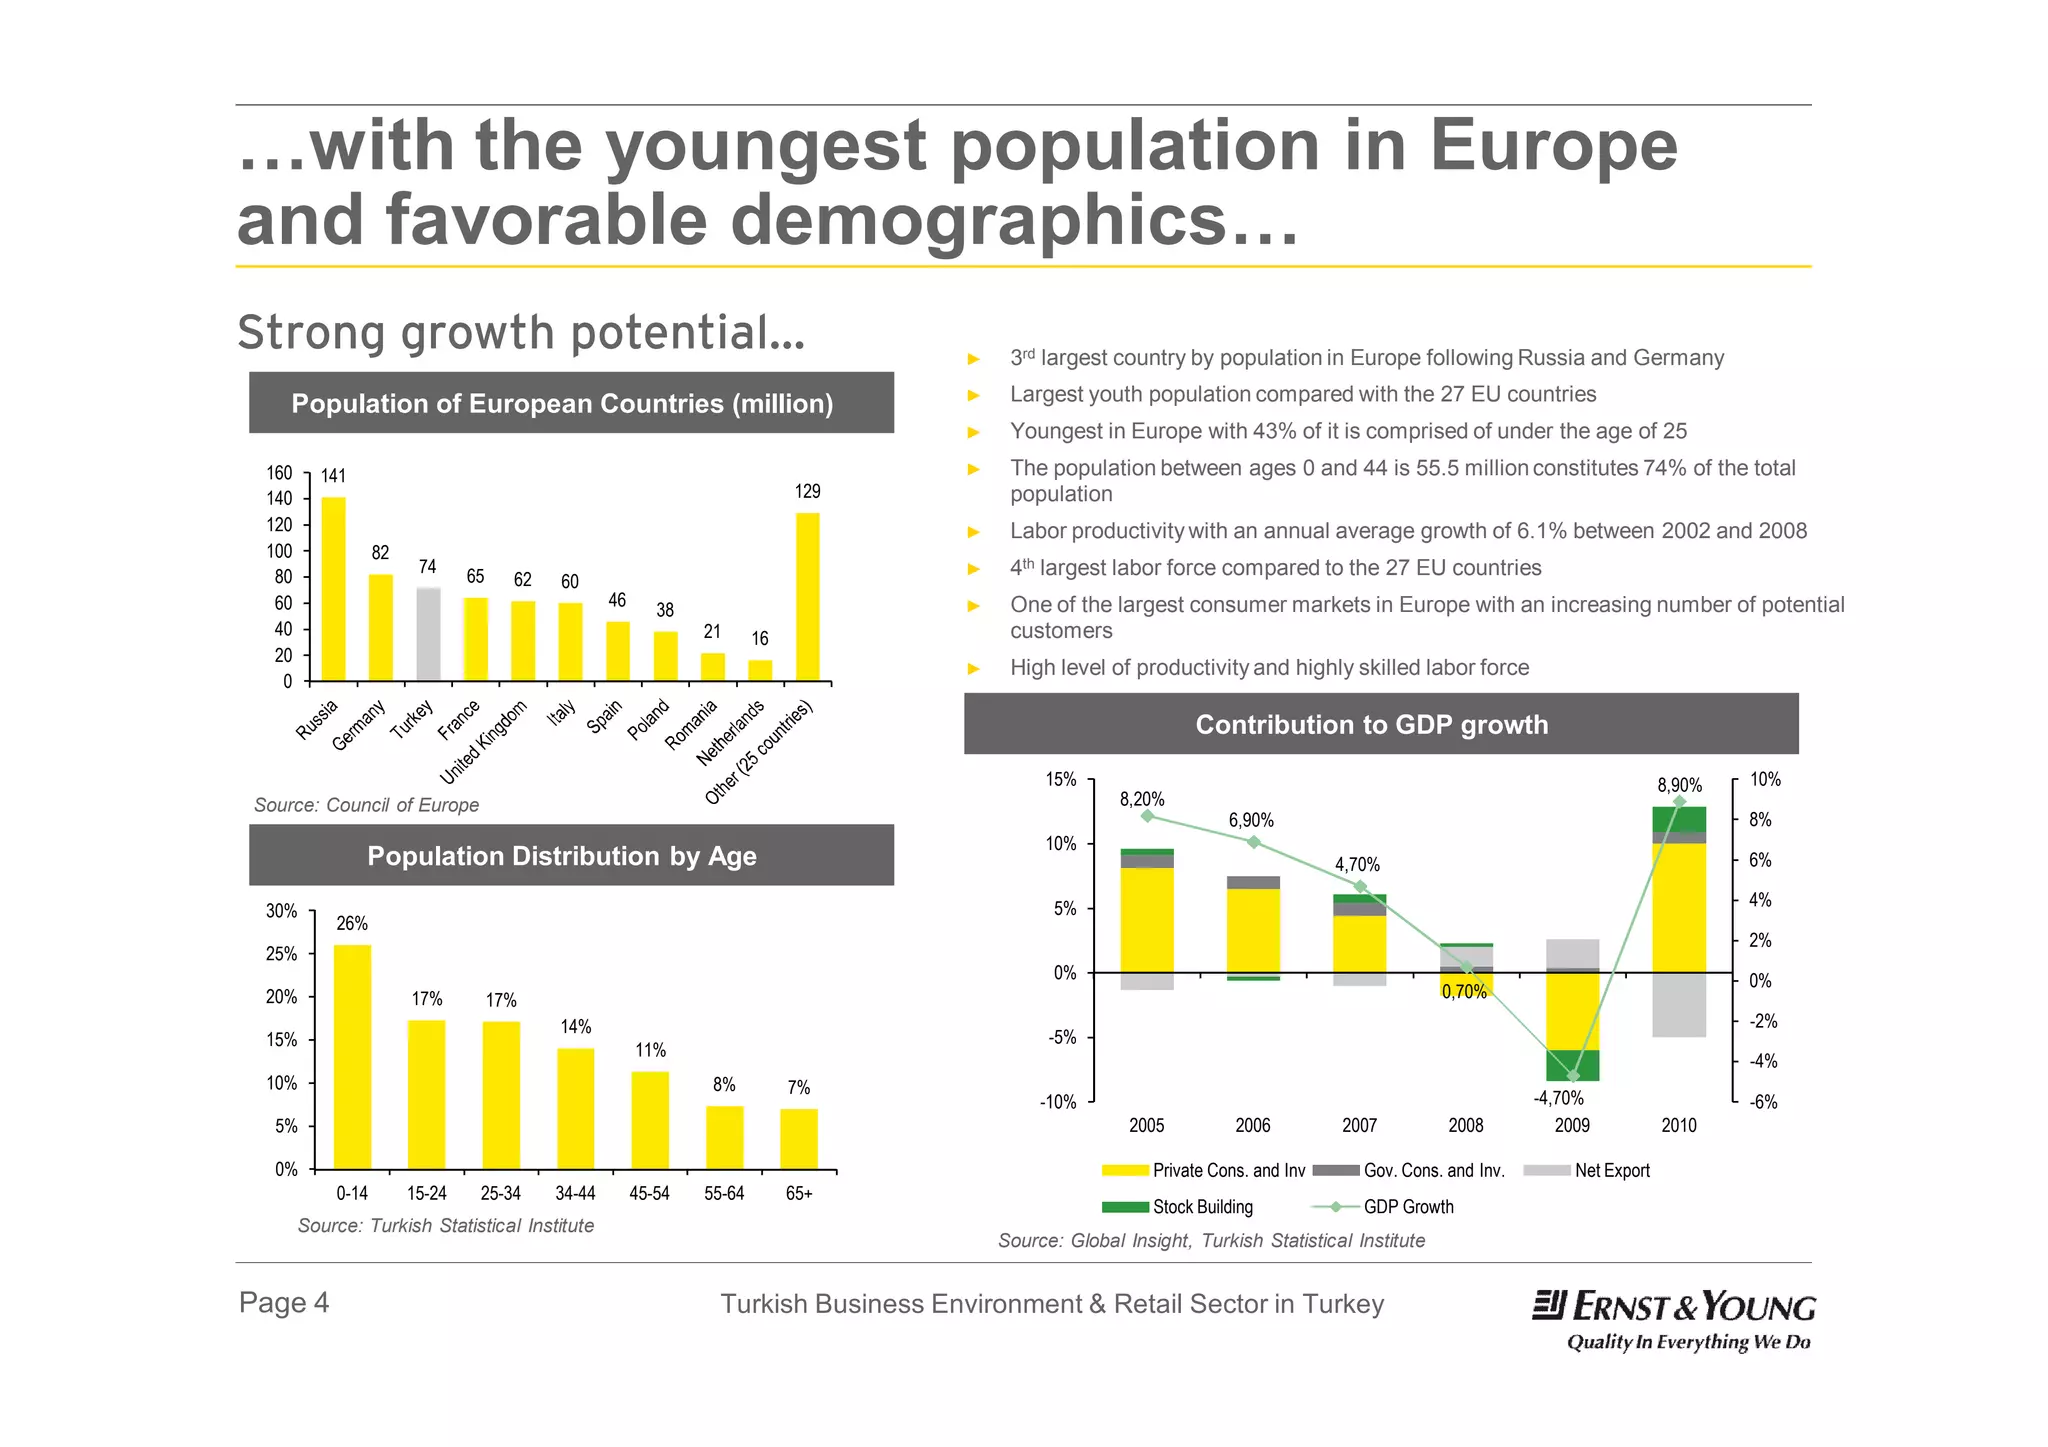
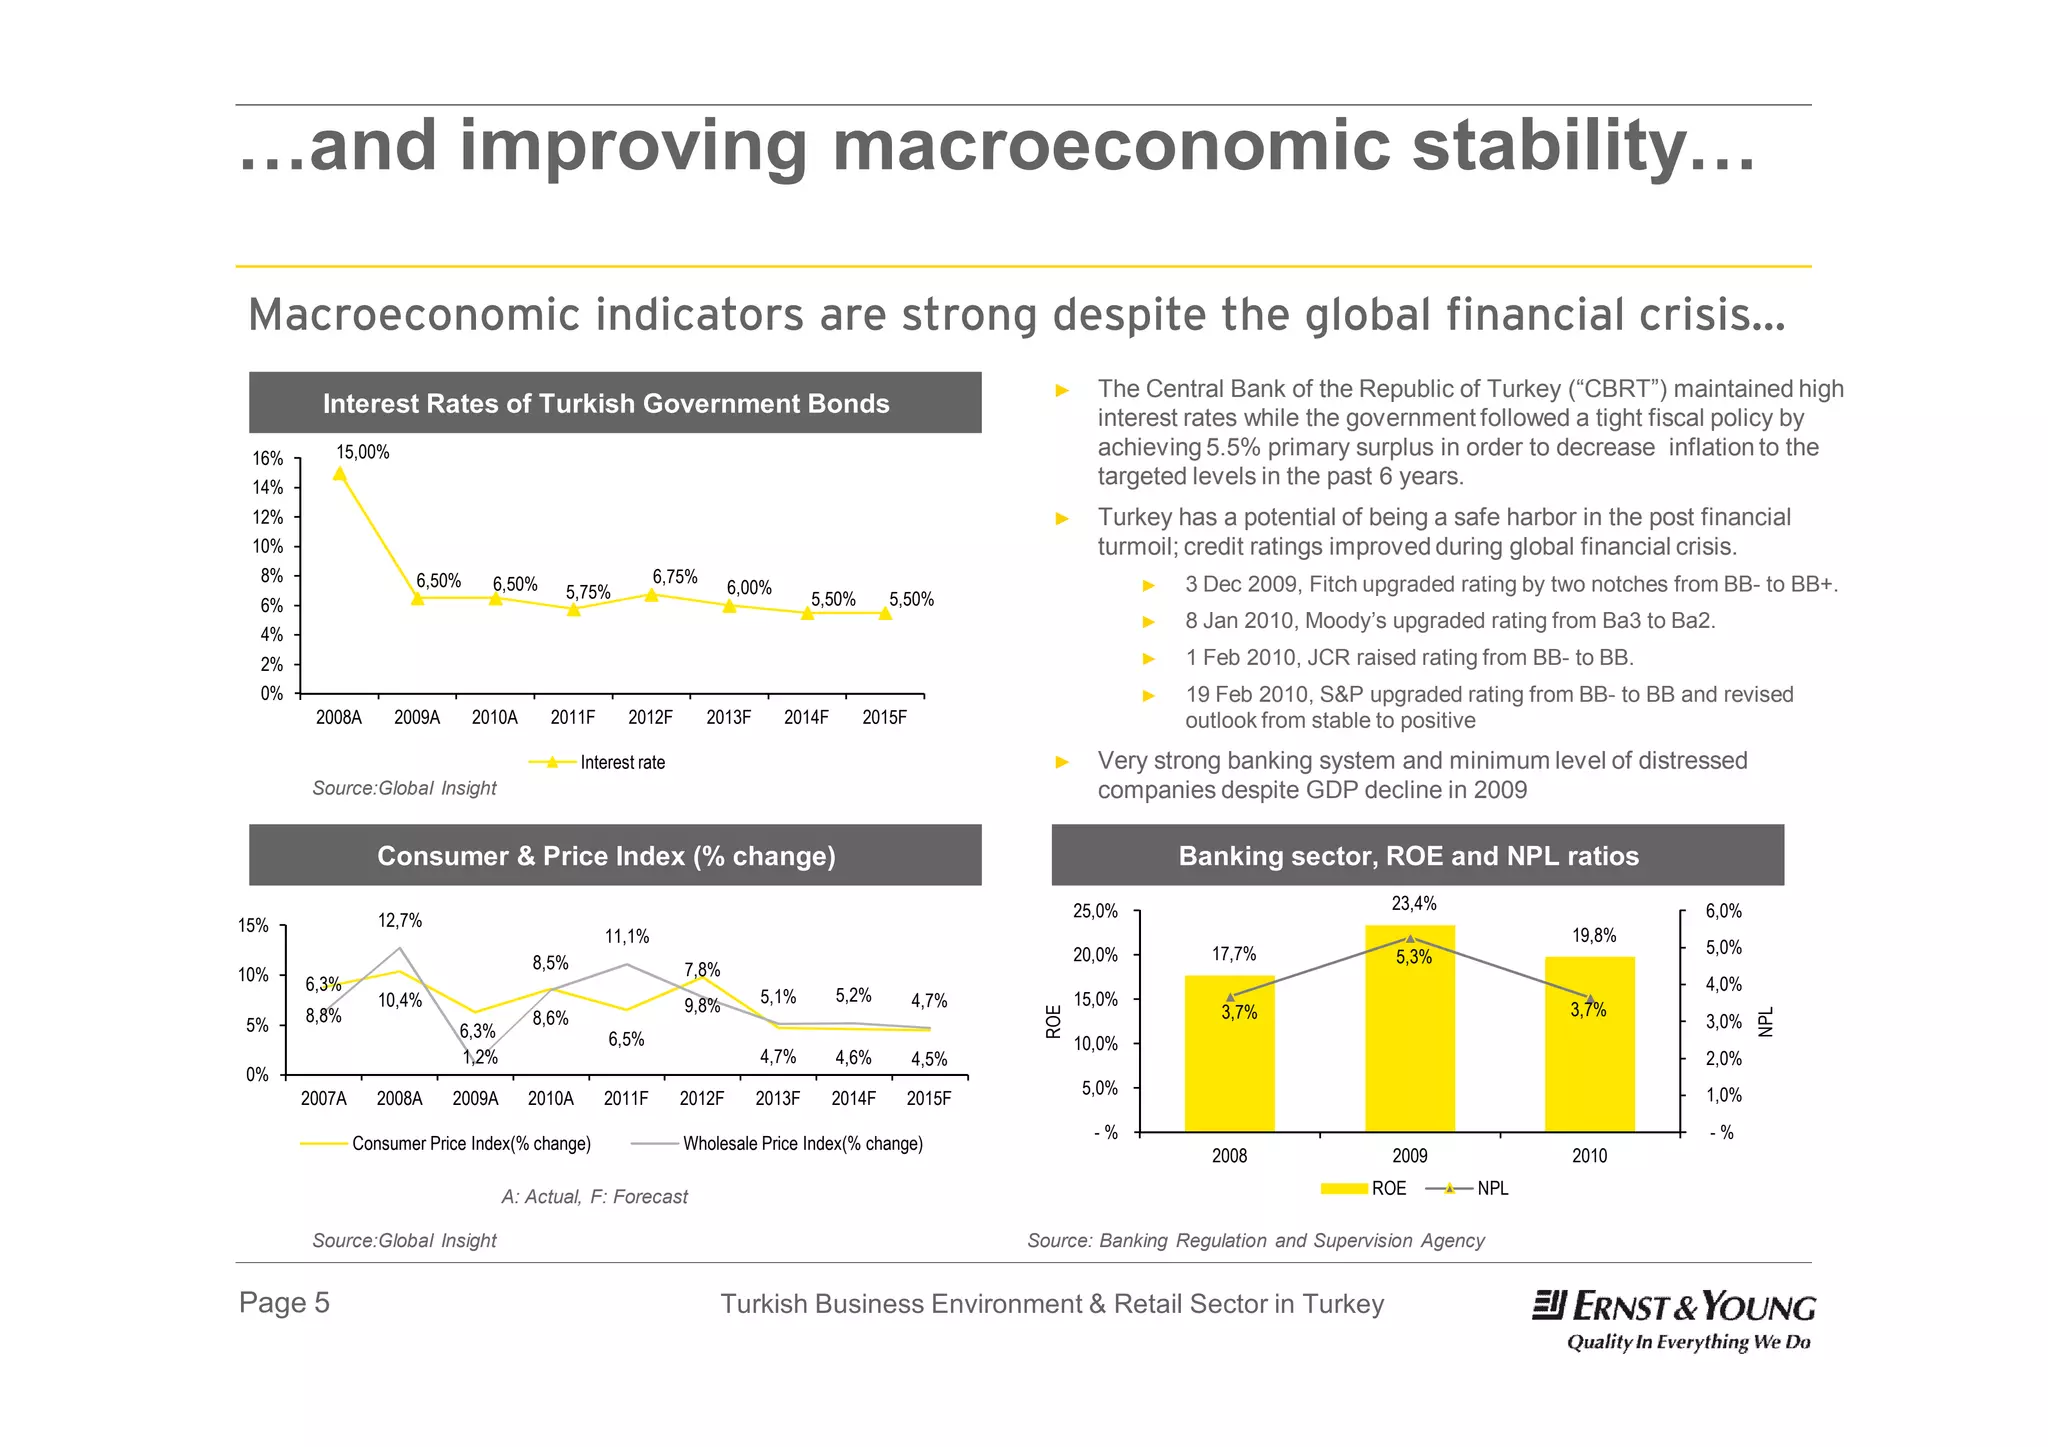
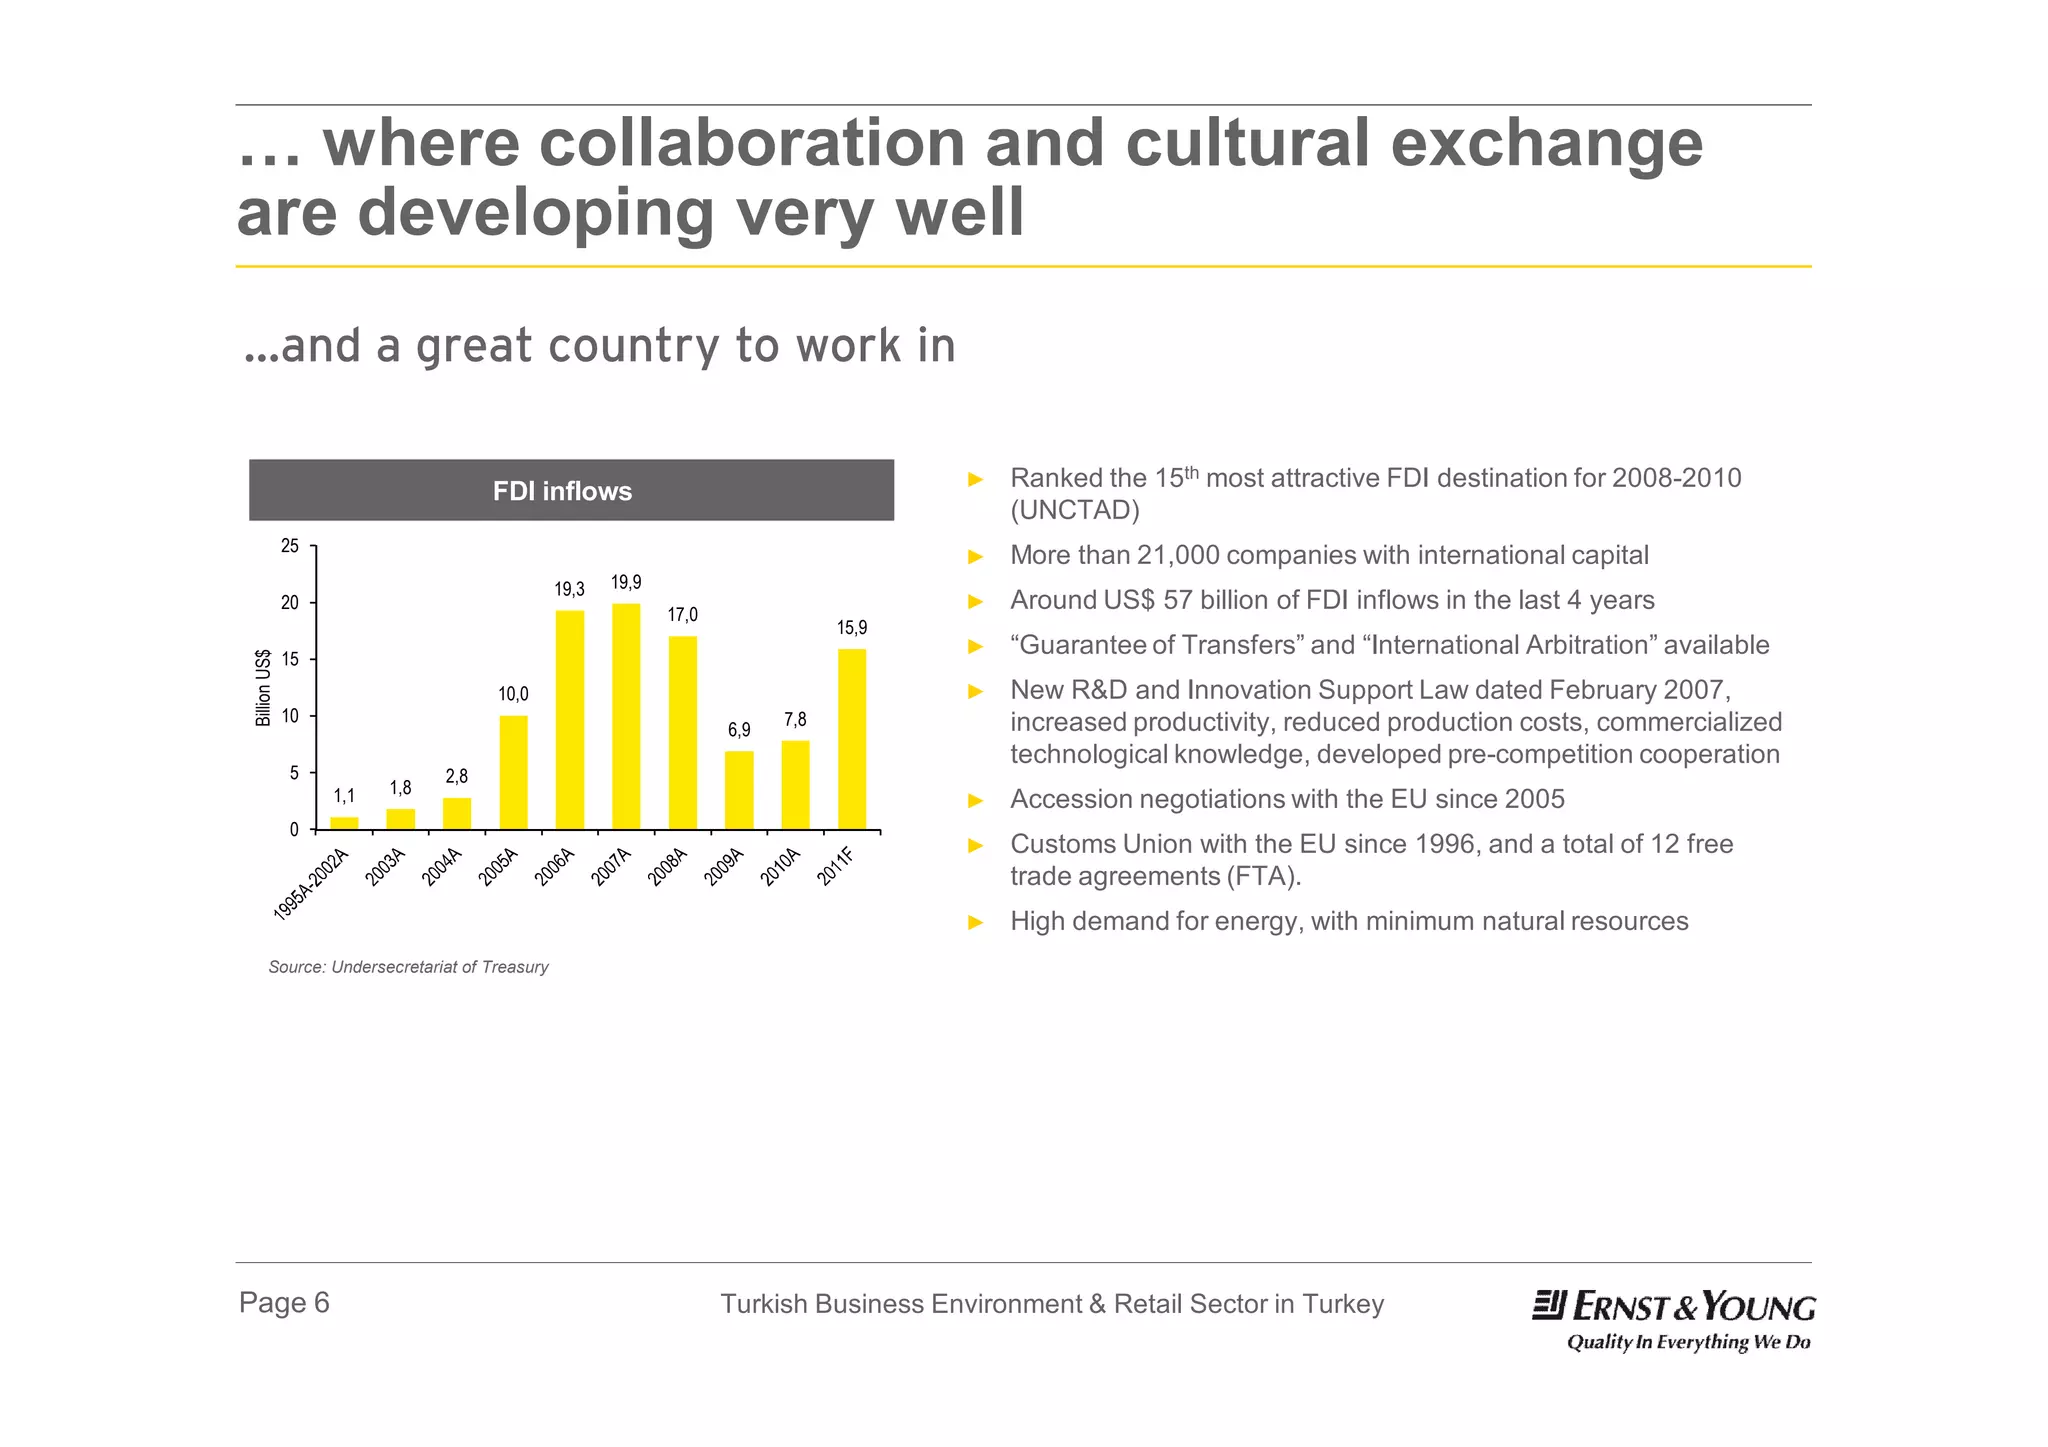
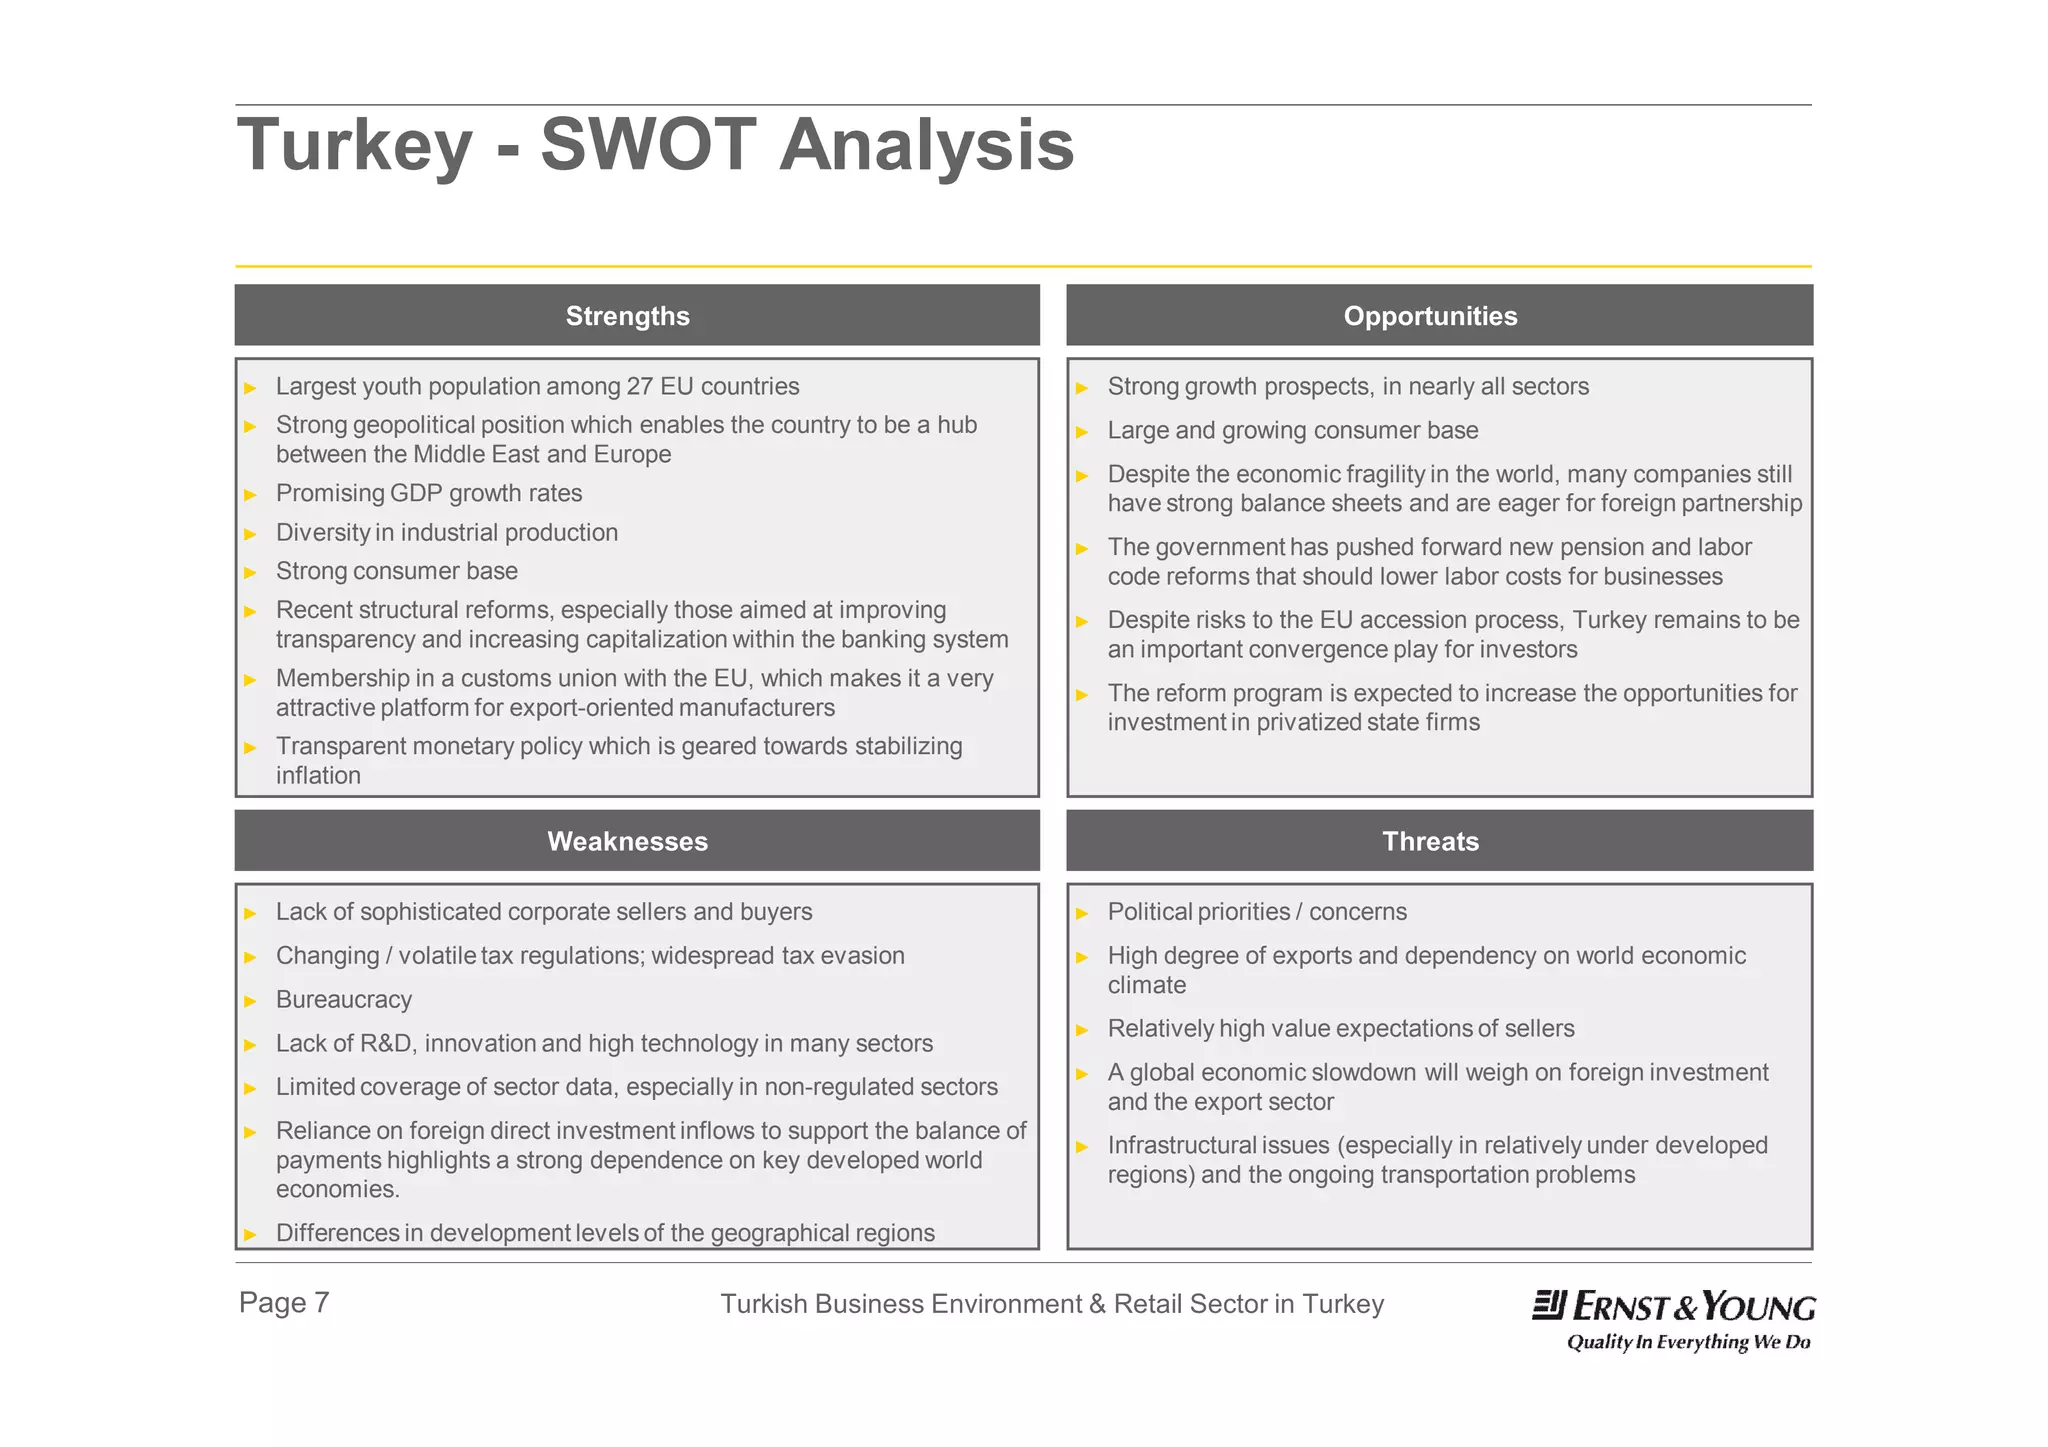
1) Turkey has a young population, strong economic growth, and strategic location between Europe and Asia, making it an attractive market for investment.
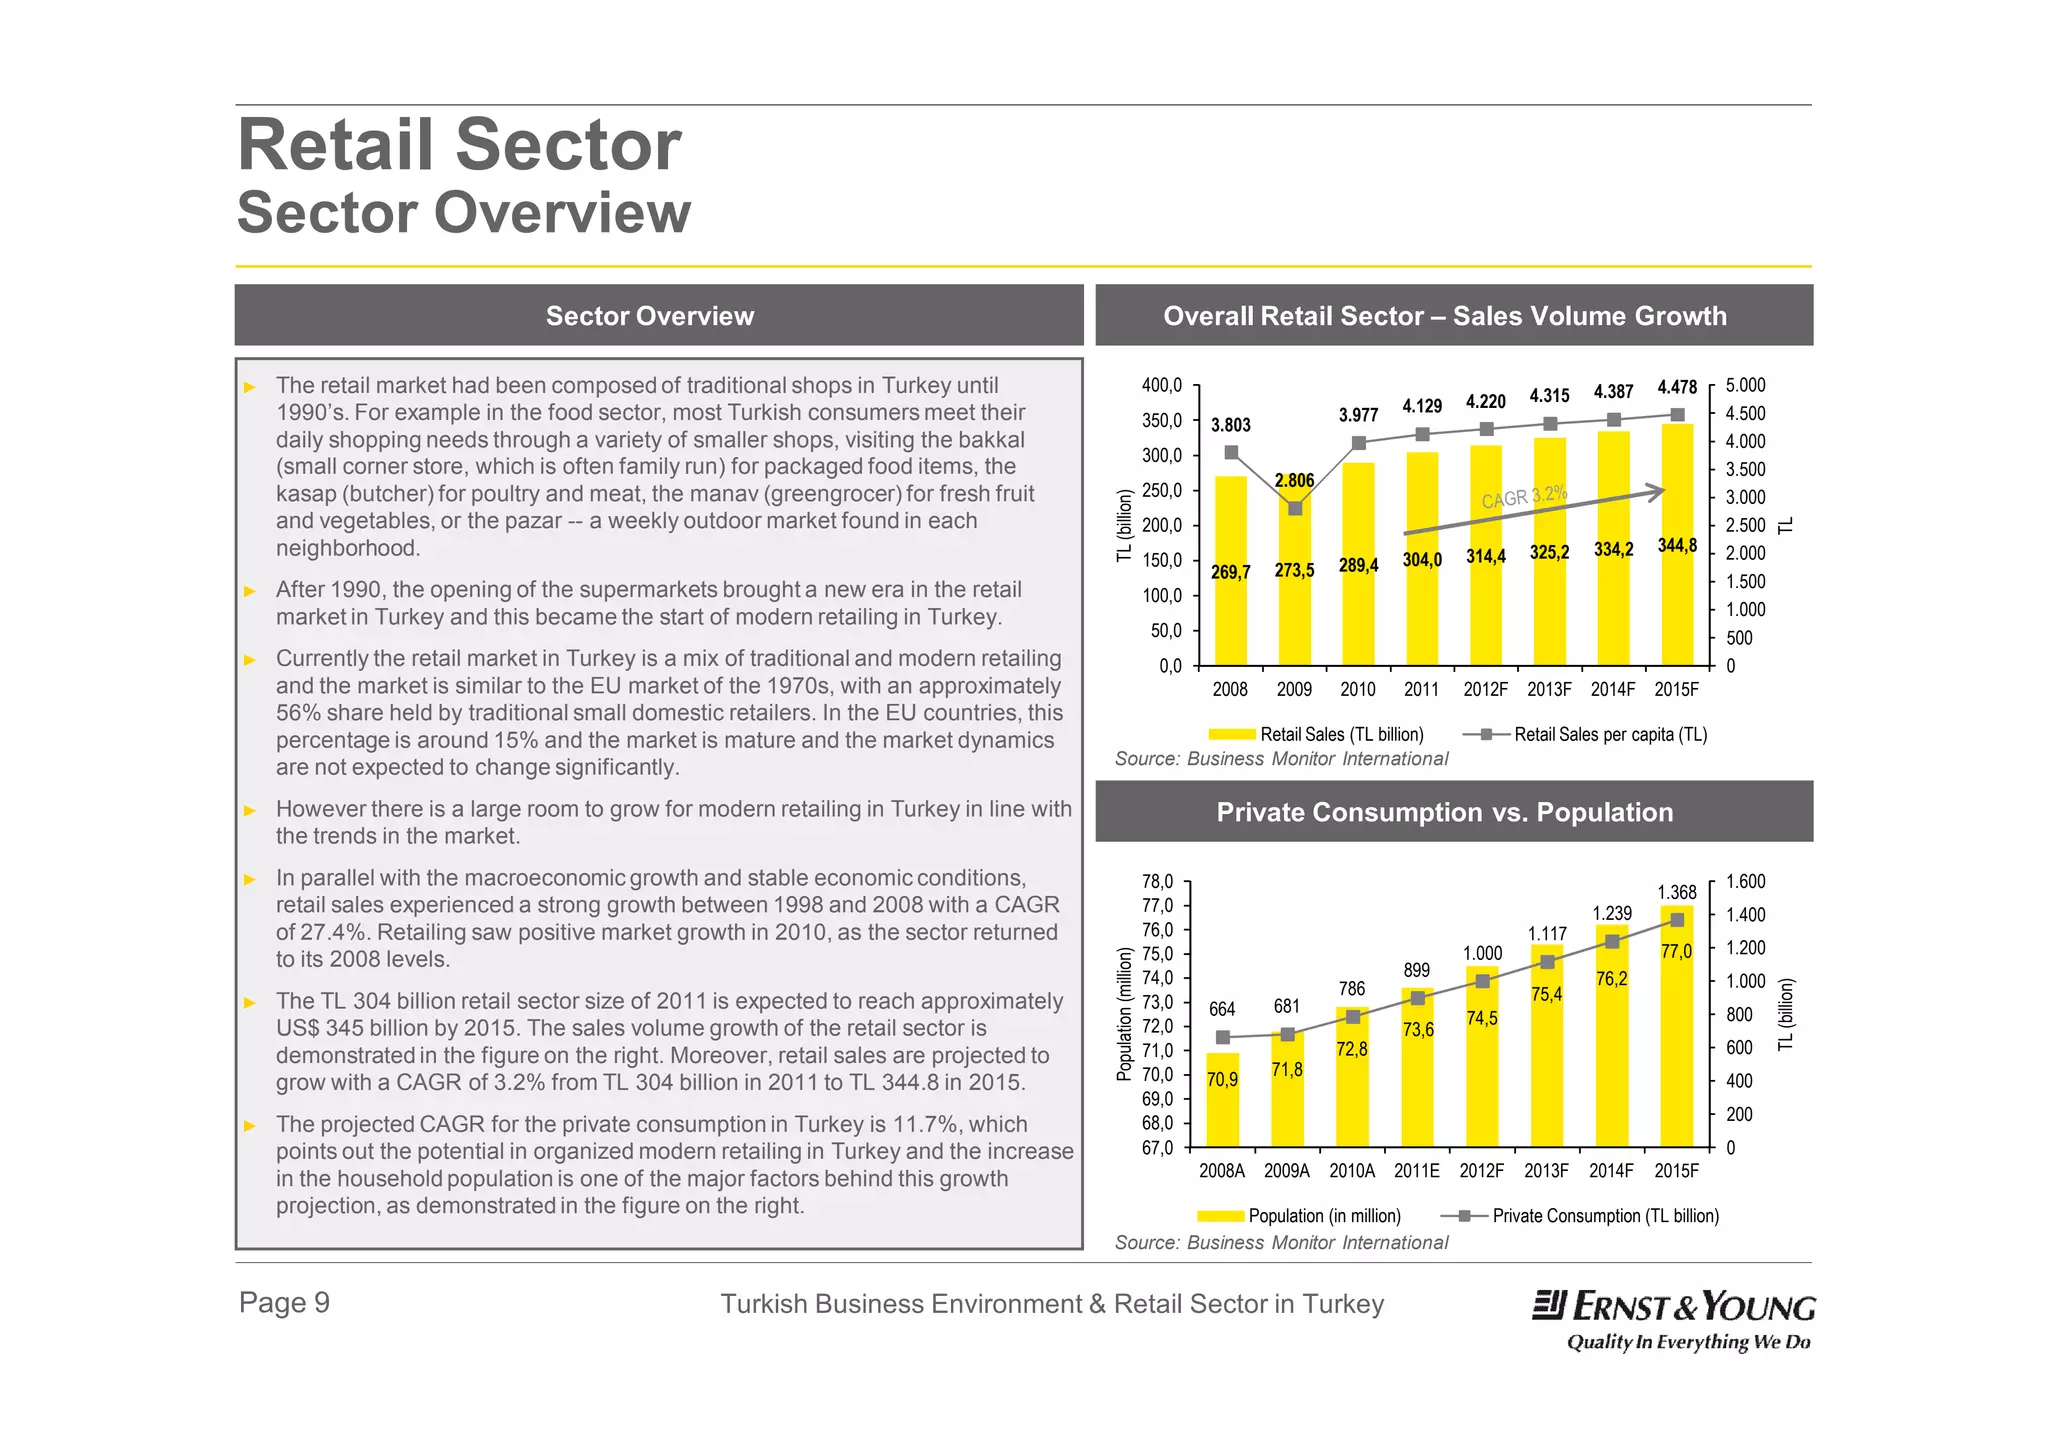
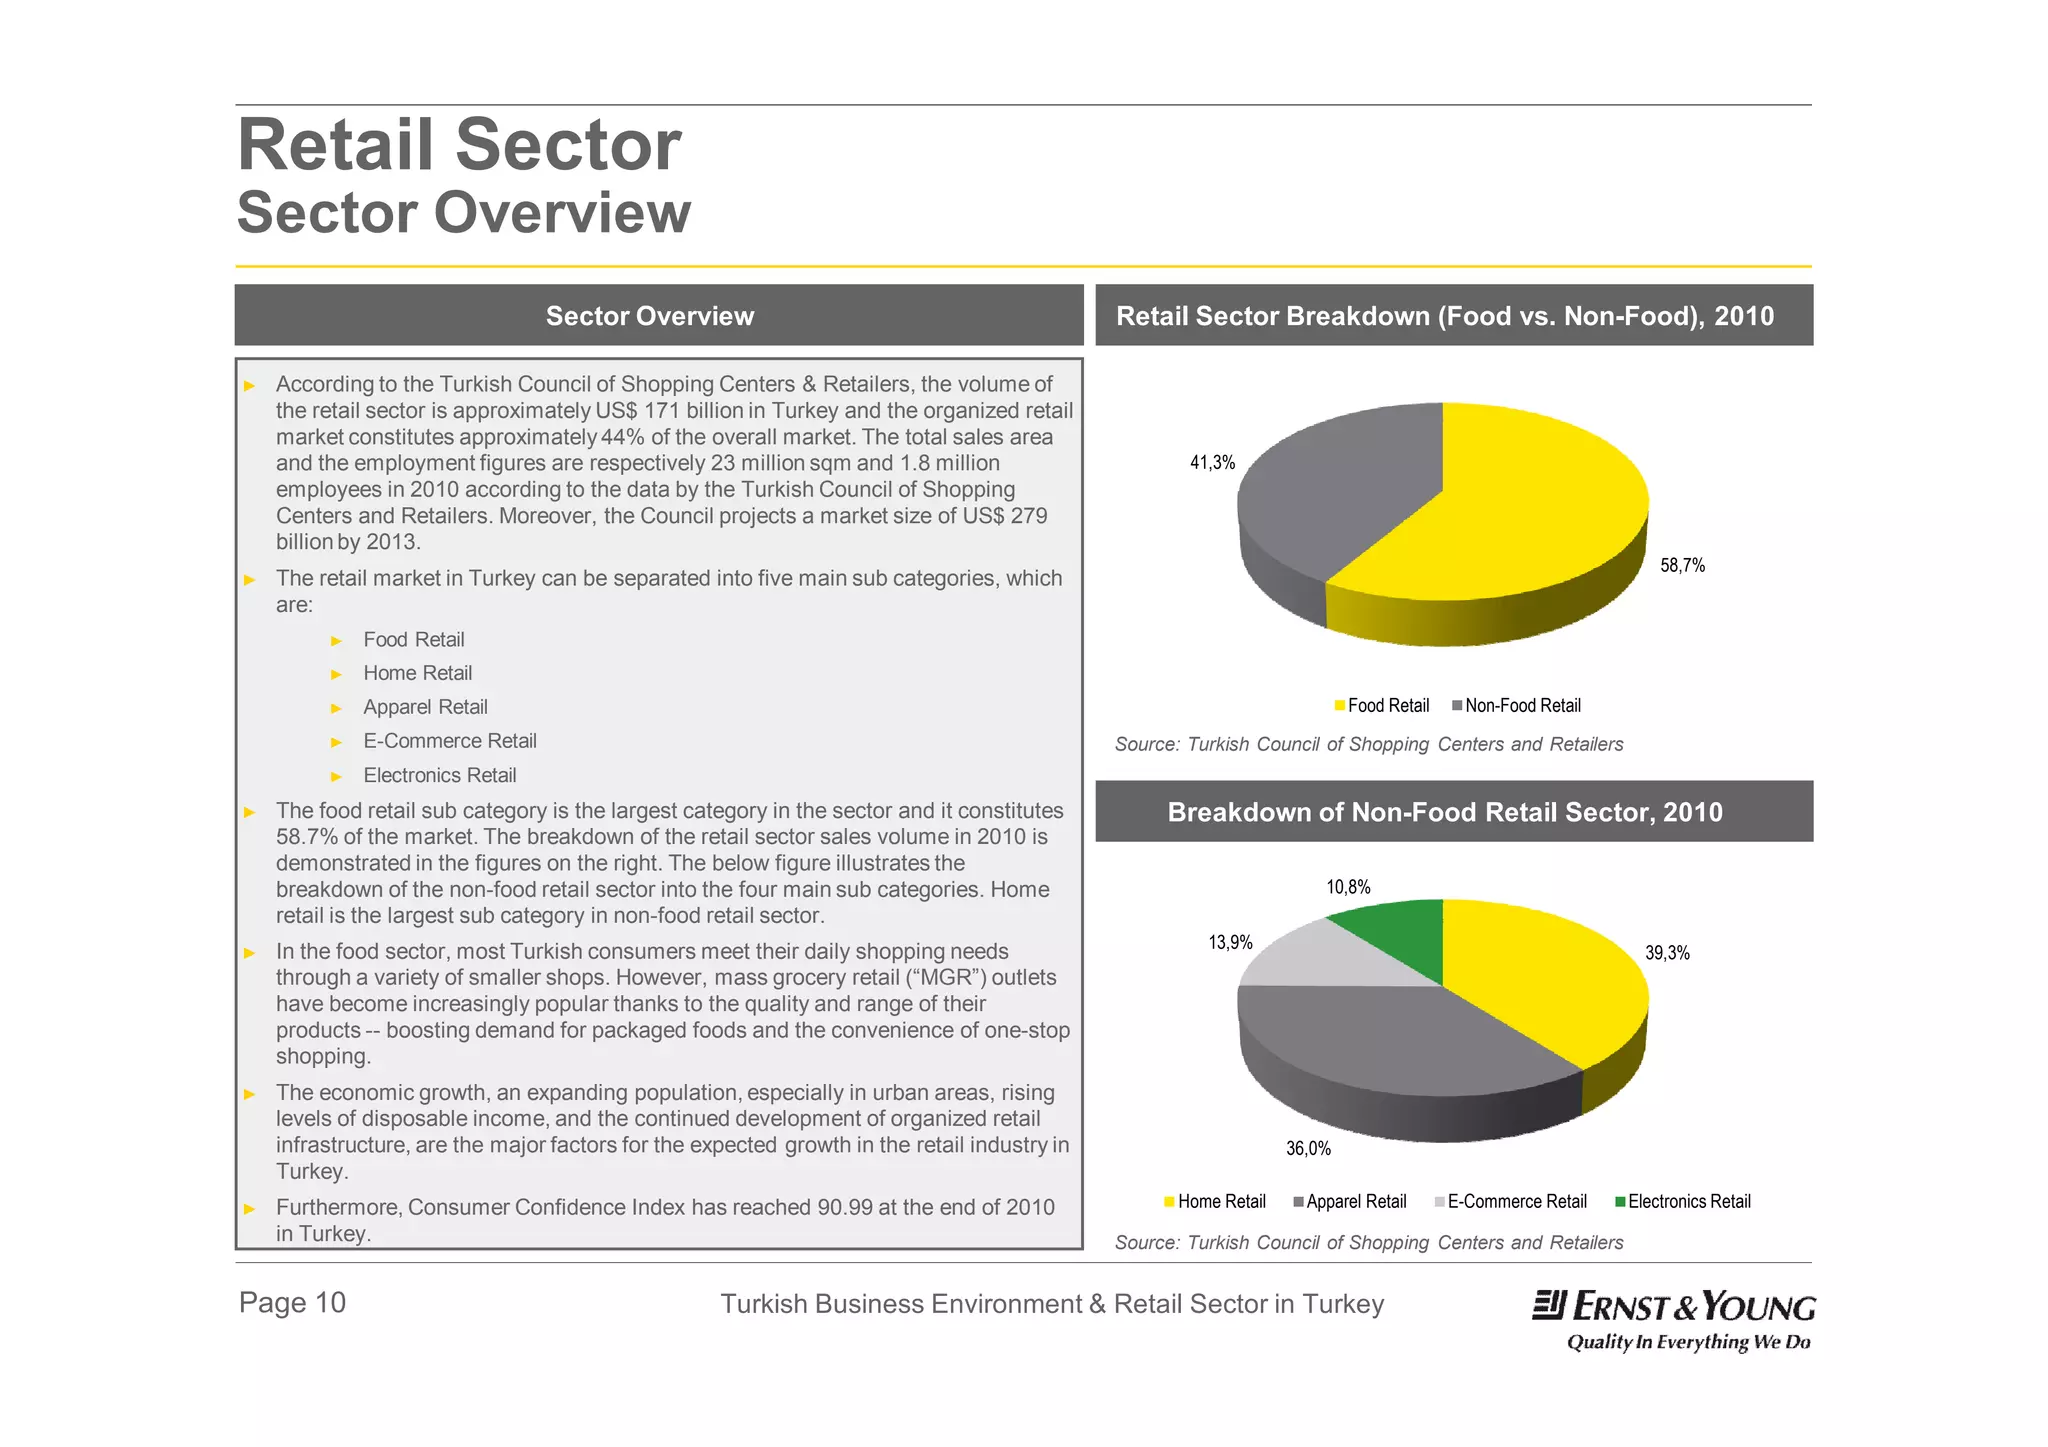
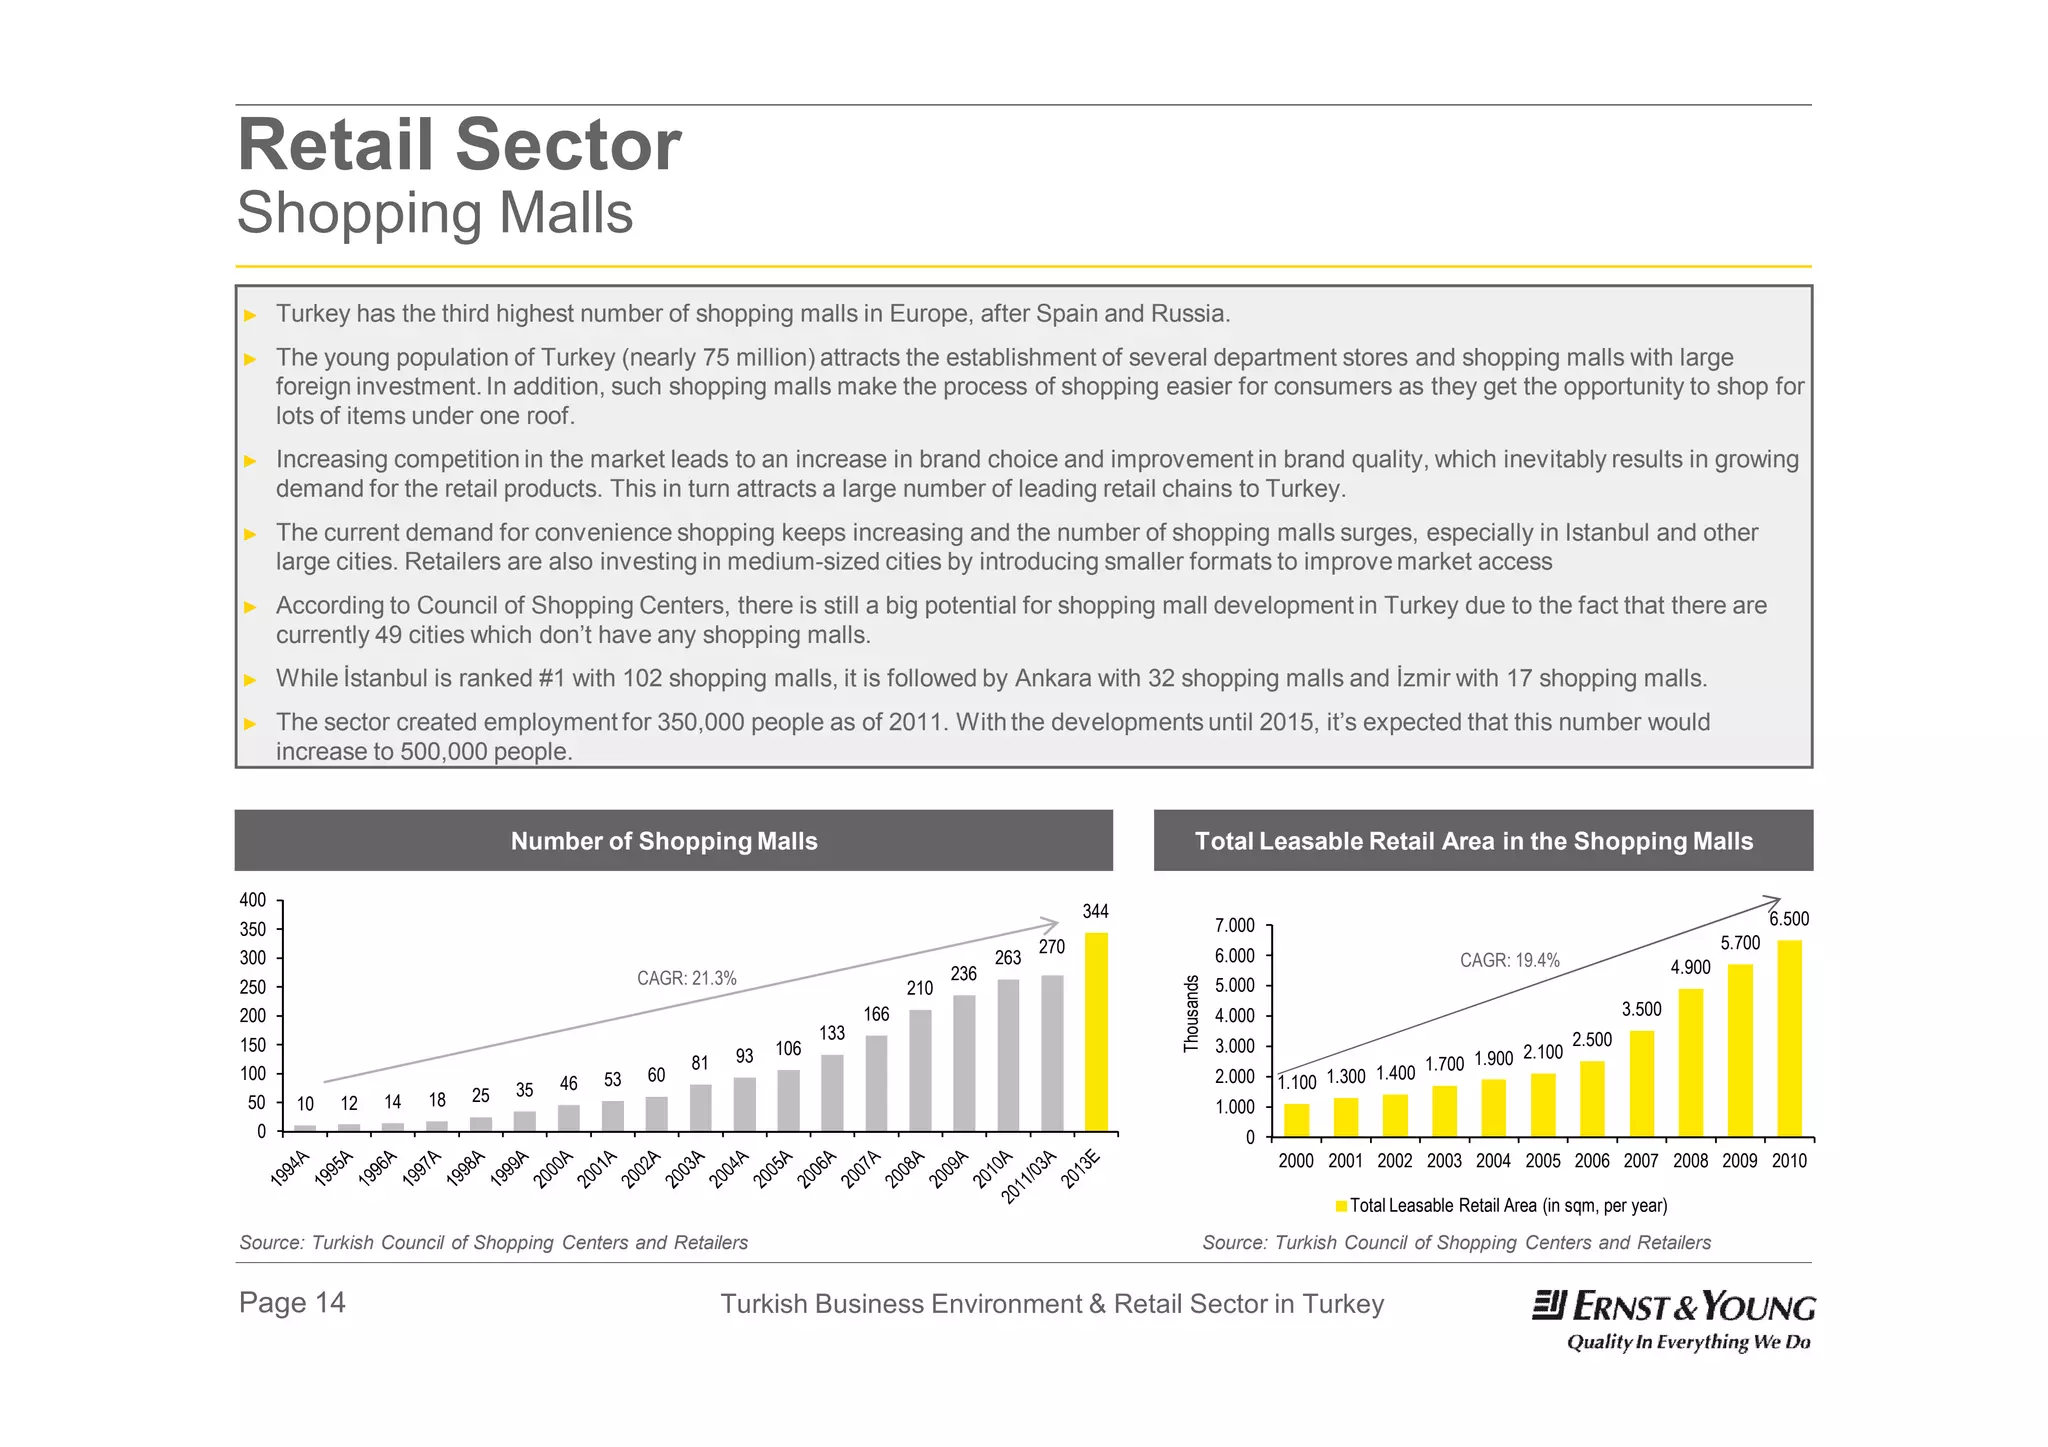
2) The retail sector has traditionally been composed of small shops but is becoming more modern, with supermarket sales growing rapidly in recent decades.
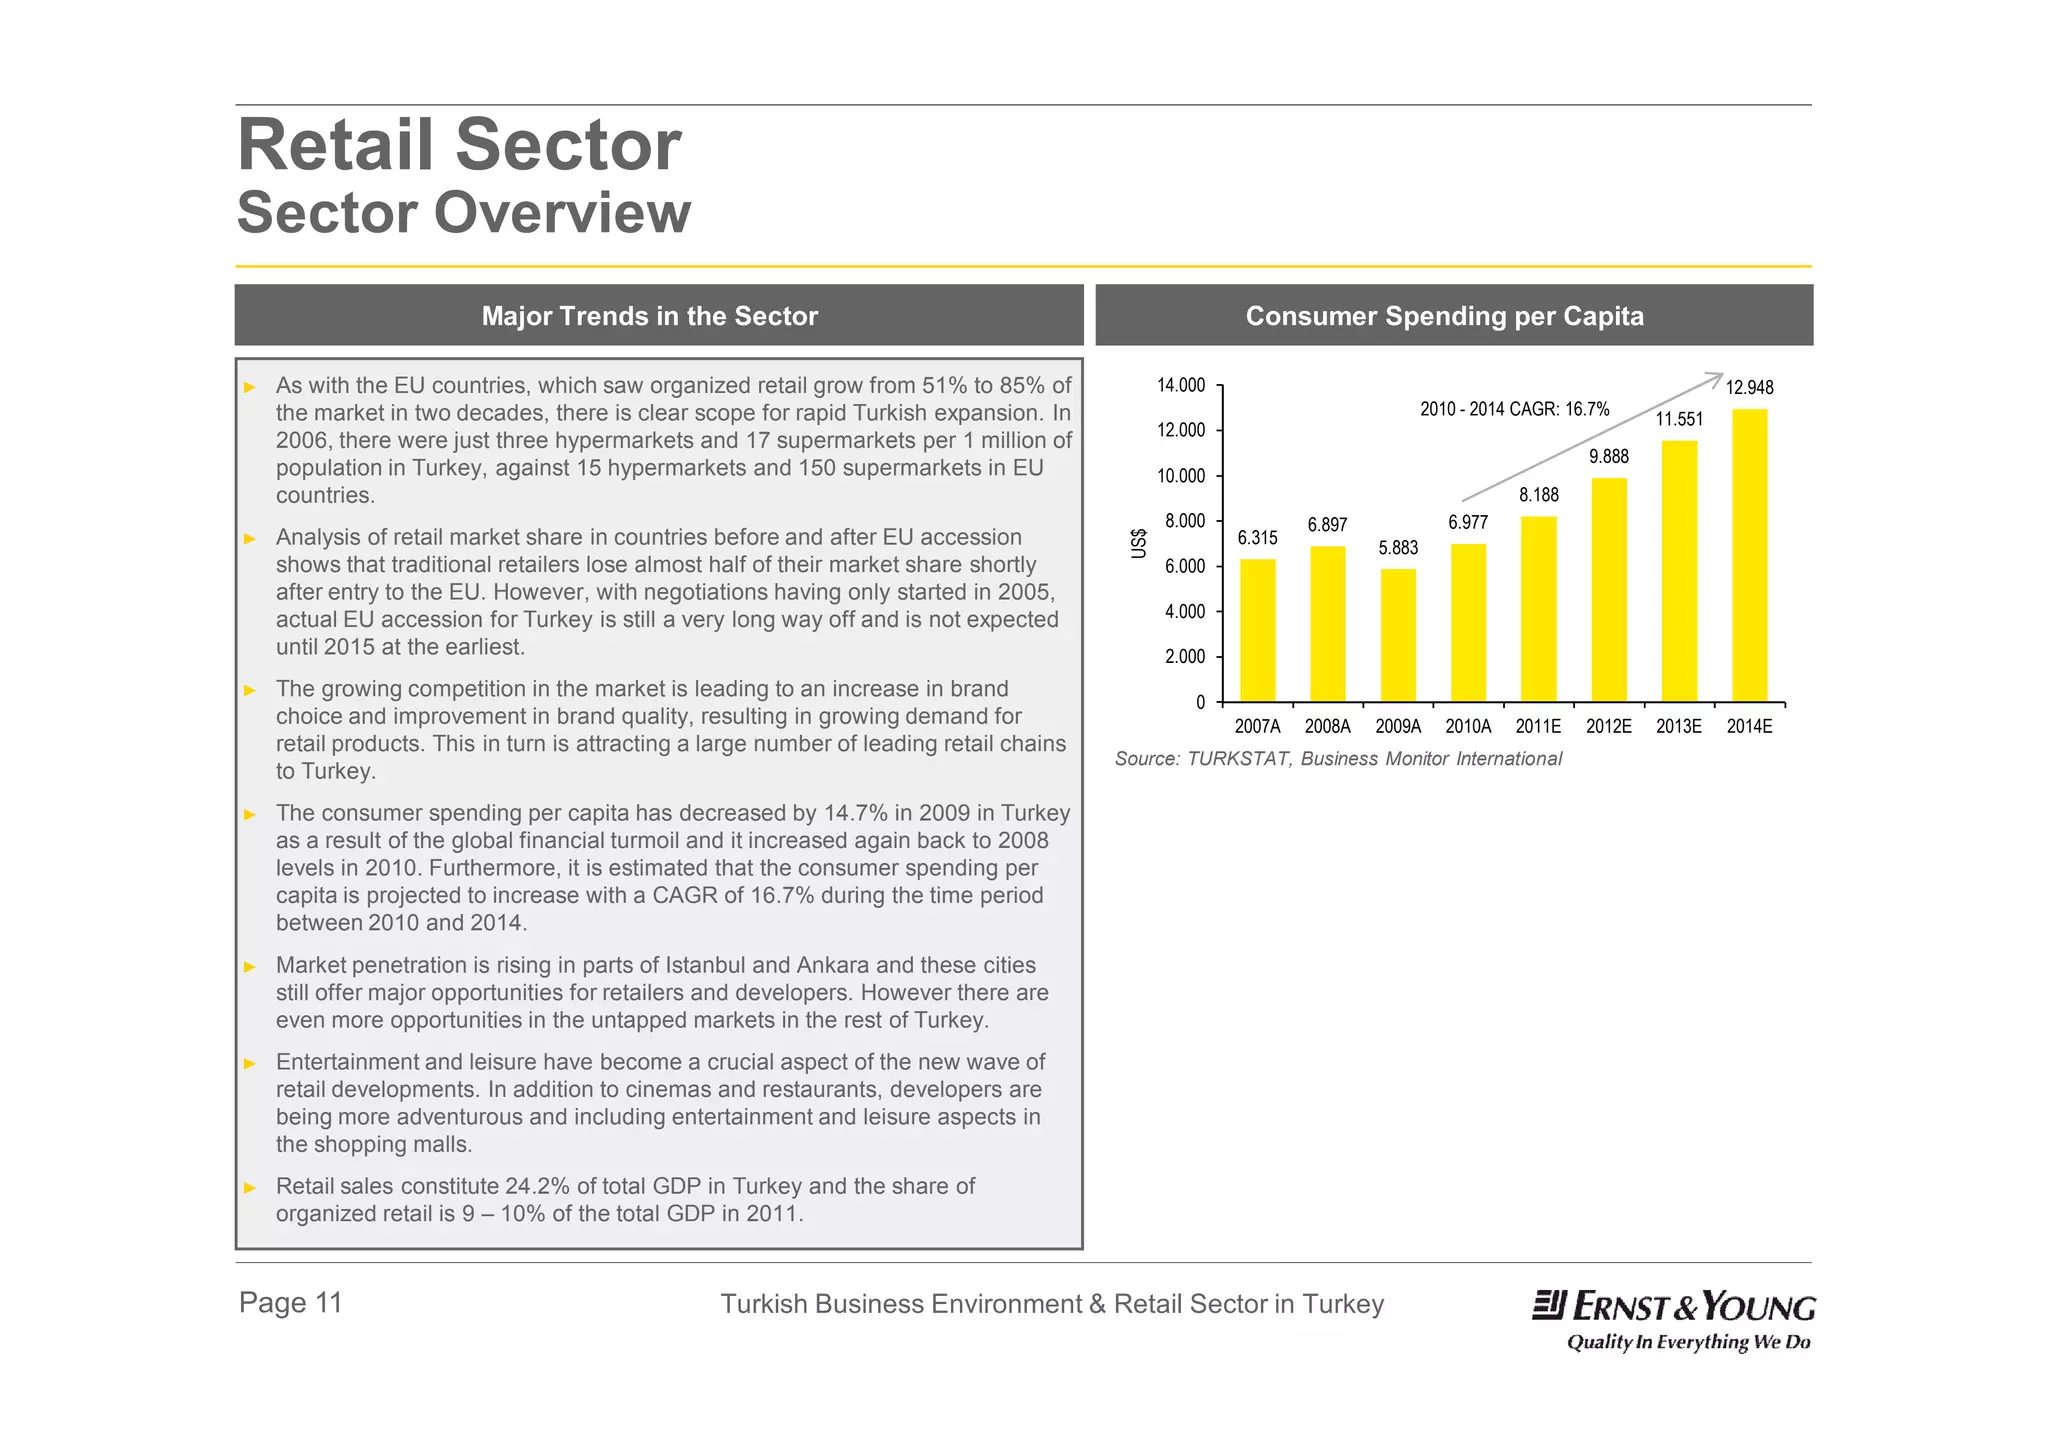
3) The retail sector is expected to continue expanding significantly due to Turkey's growing economy and consumer base.


![Trinidad & Tobago - Trade Profile [UWI's Shridath Ramphal Centre]](https://cdn.slidesharecdn.com/ss_thumbnails/trinidadtobago-110615102333-phpapp01-thumbnail.jpg?width=640&height=640&fit=bounds)


