Download to read offline
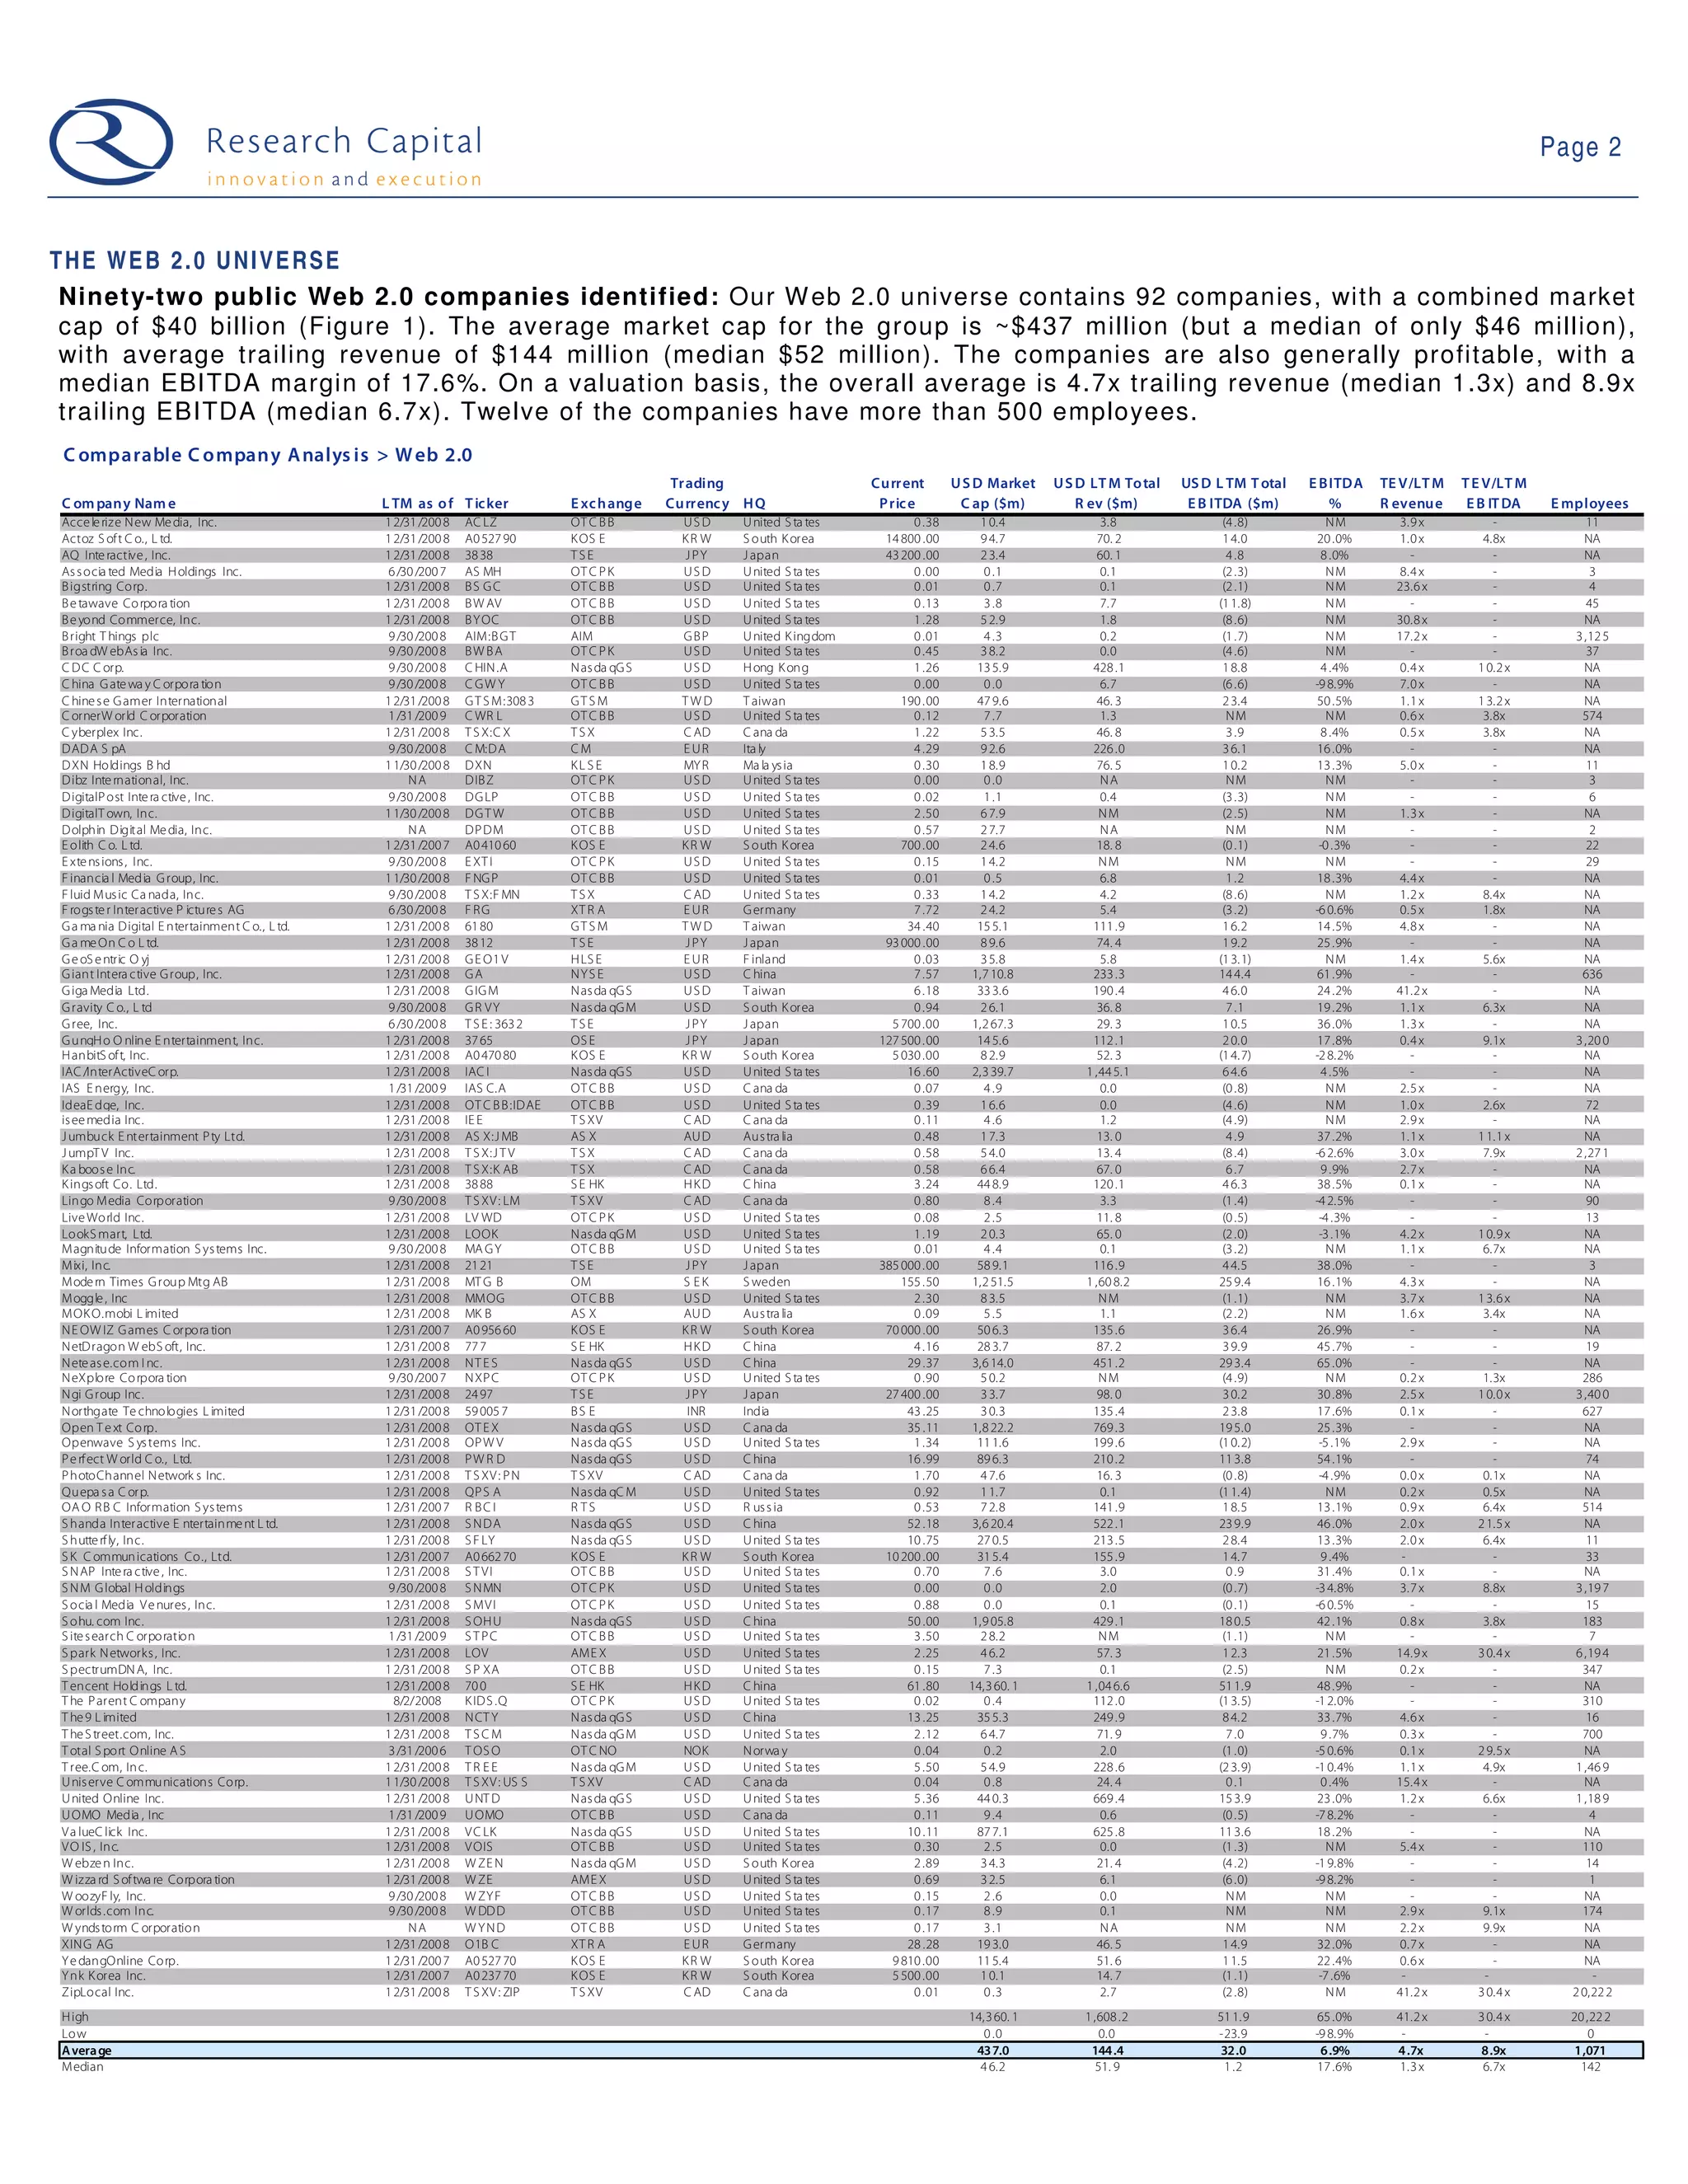
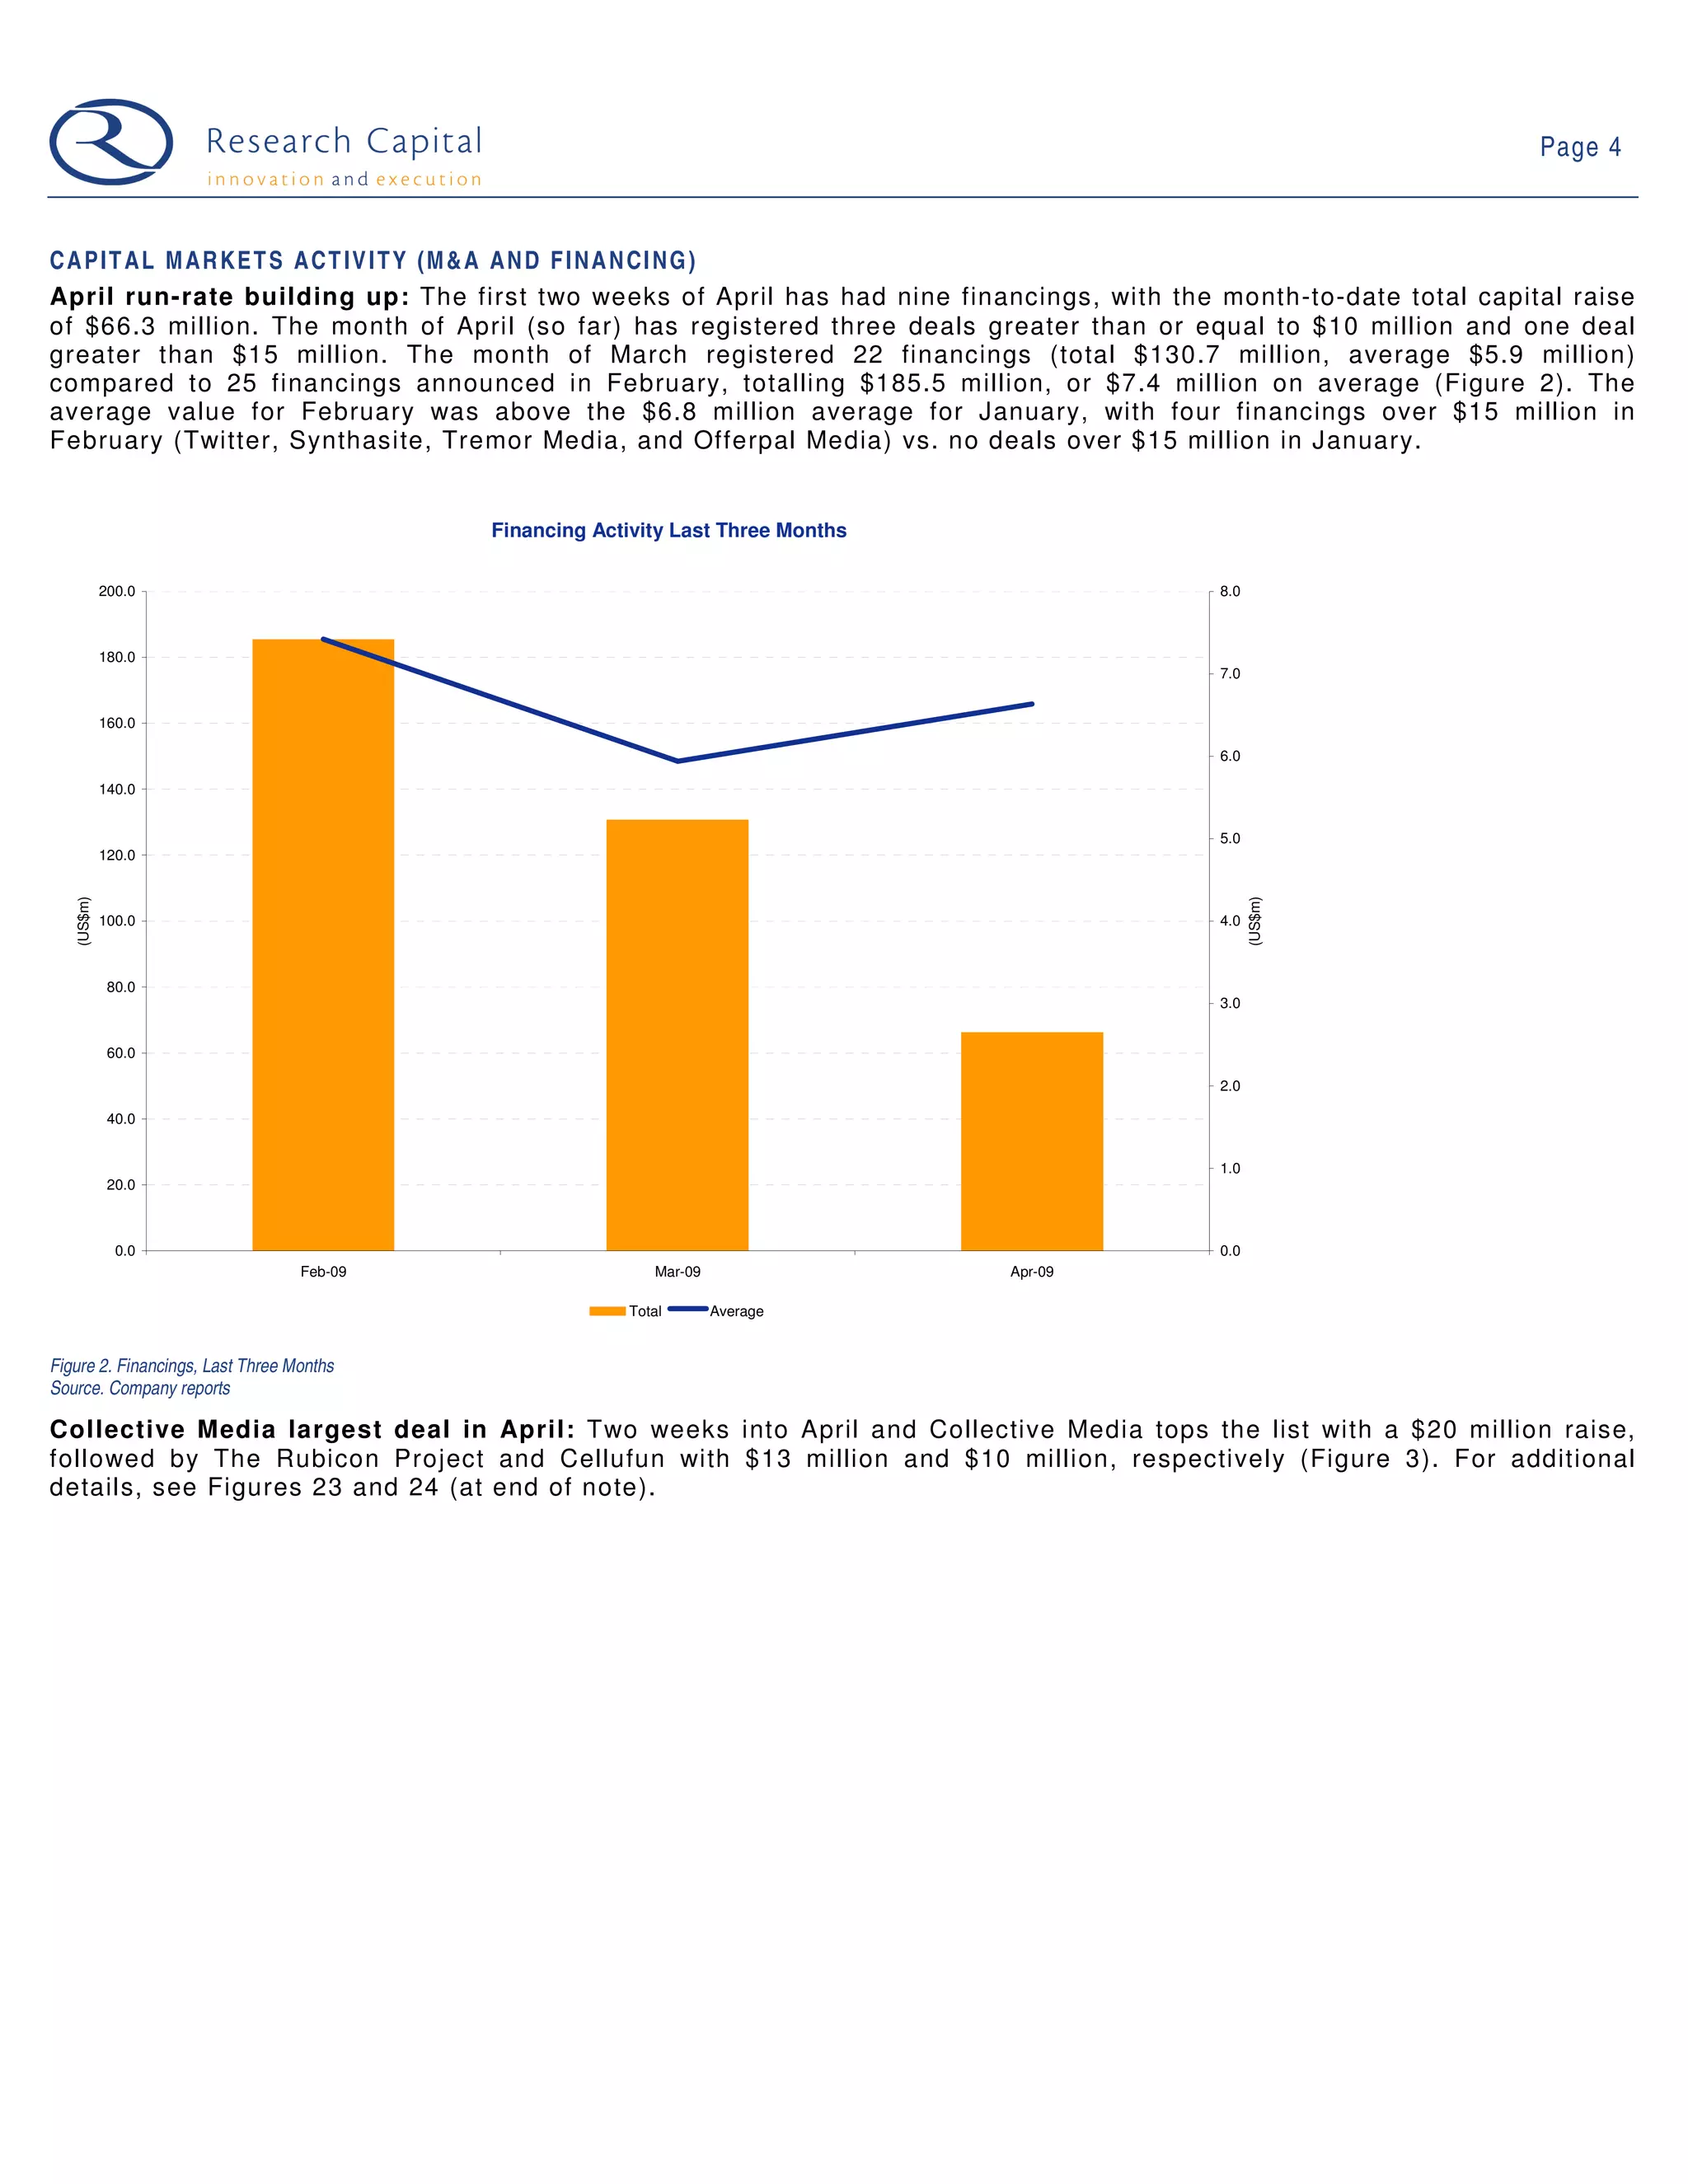
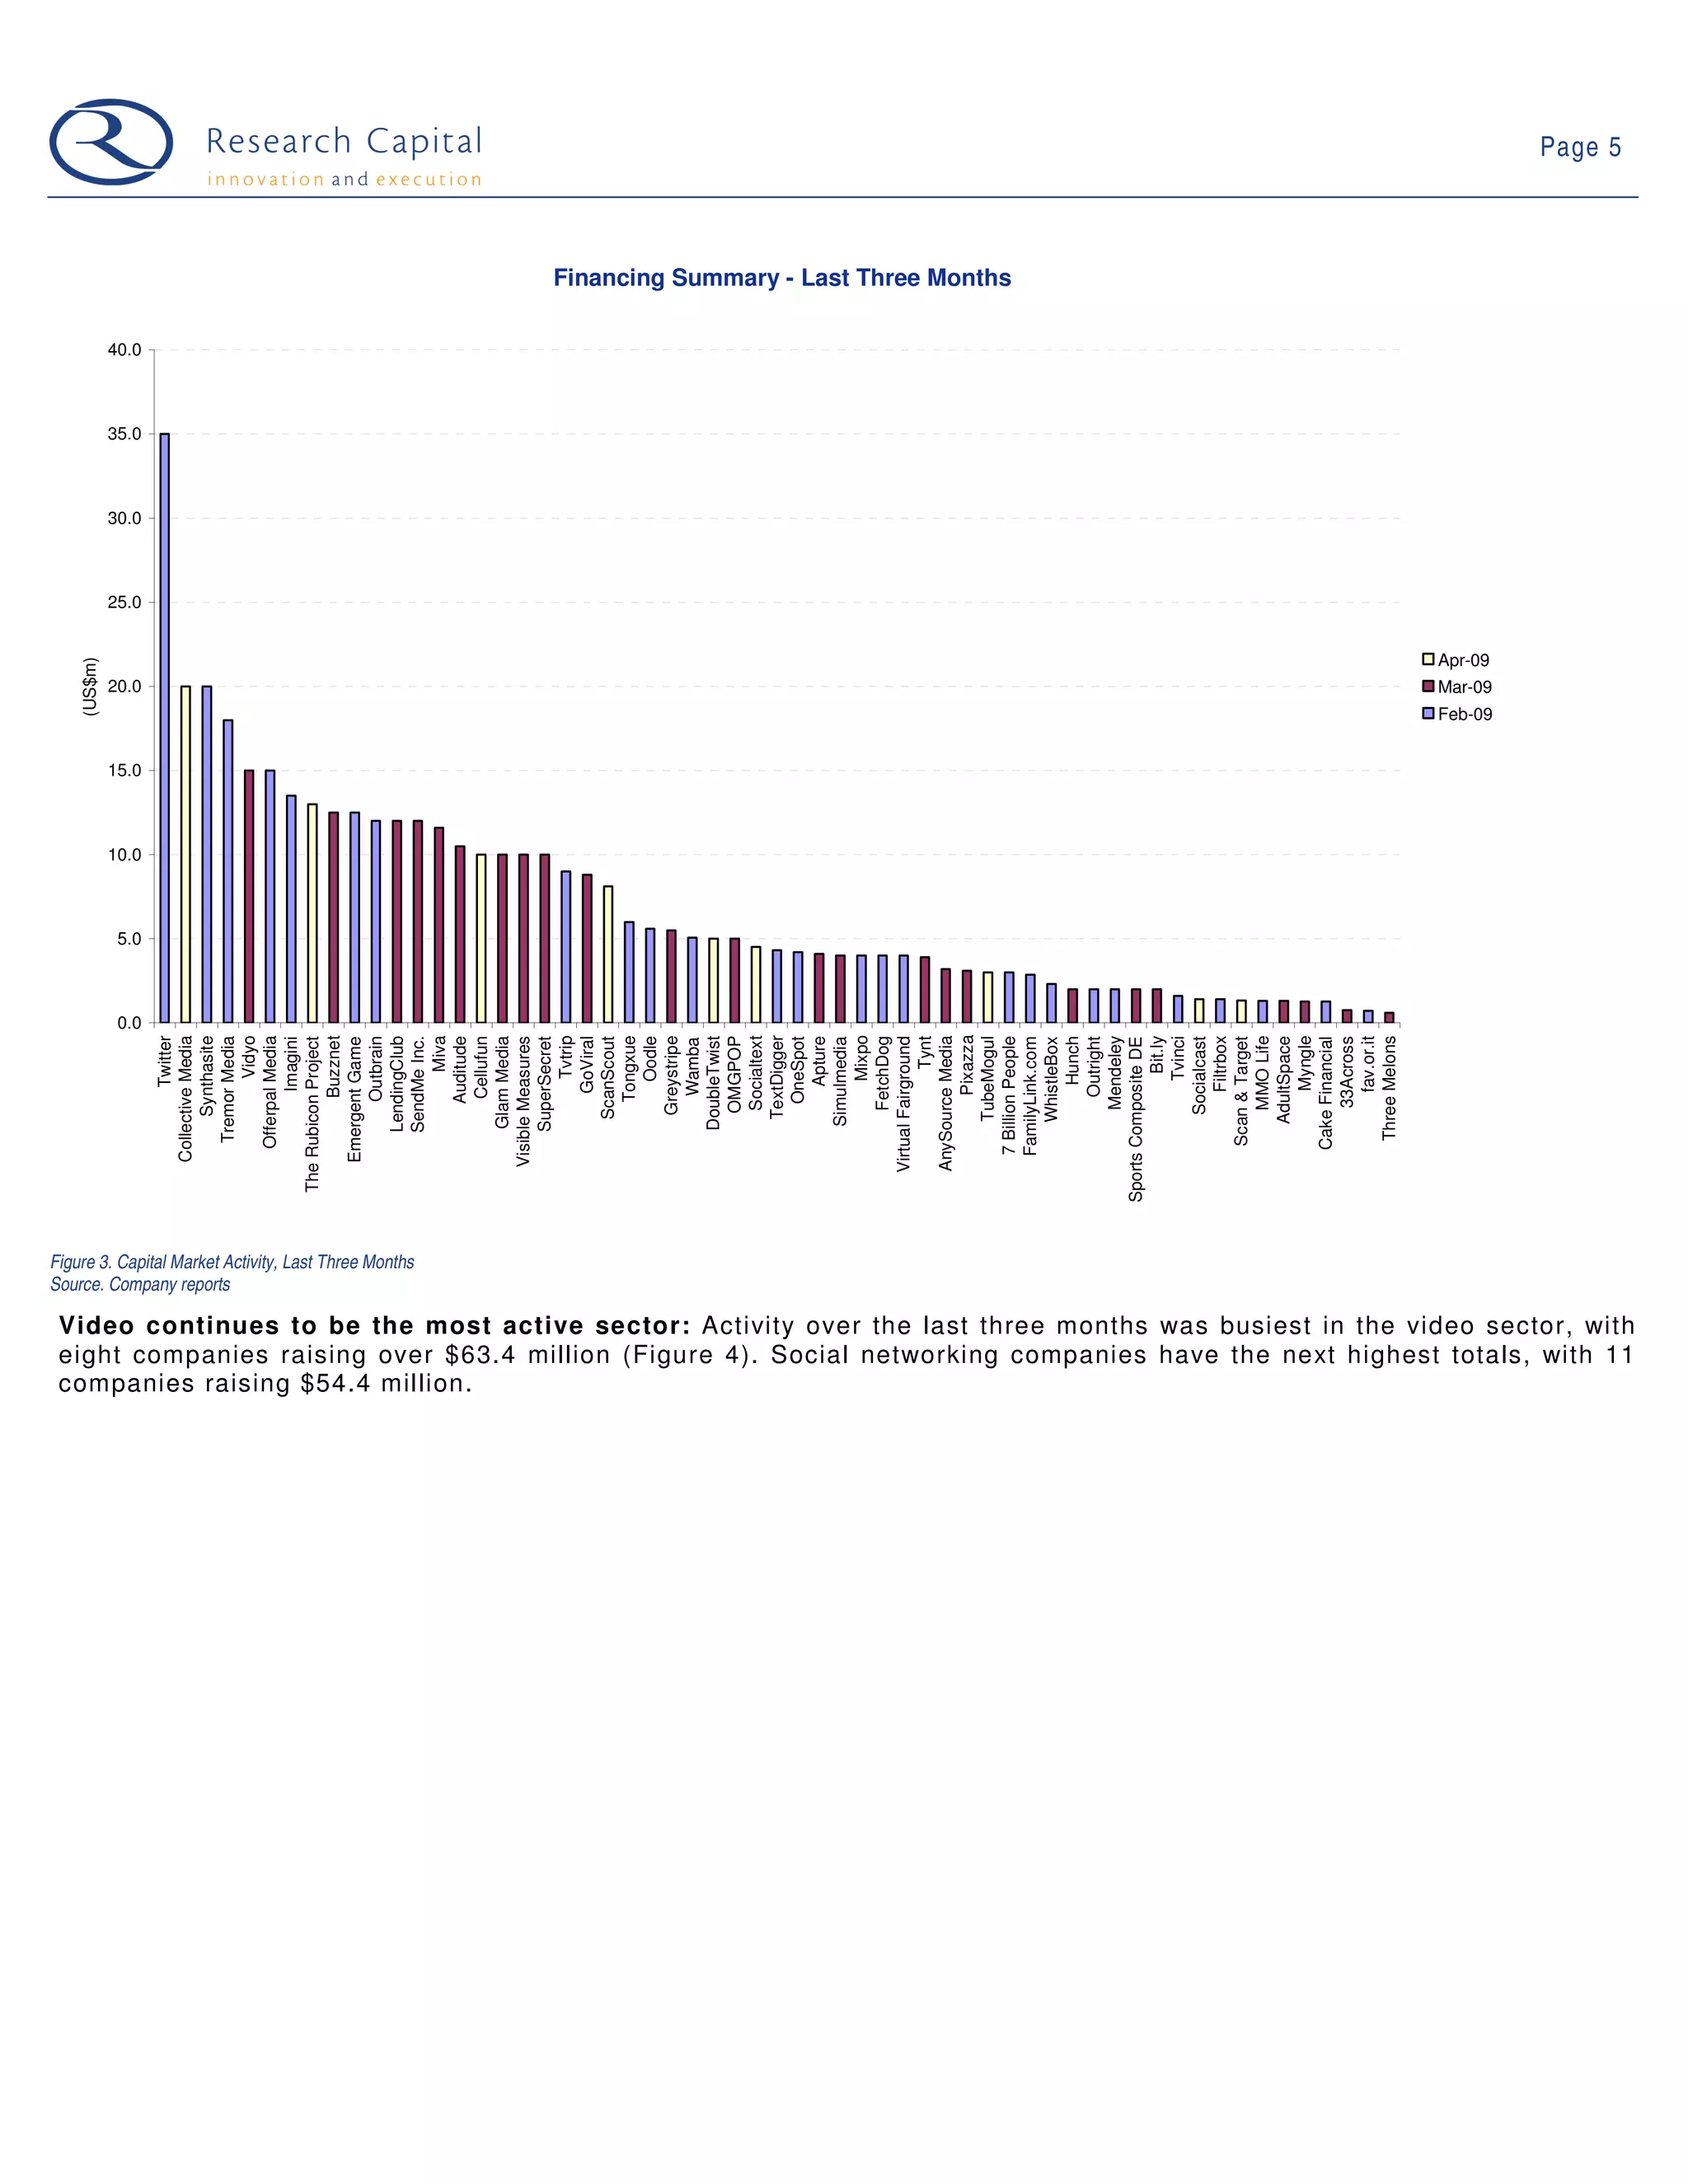
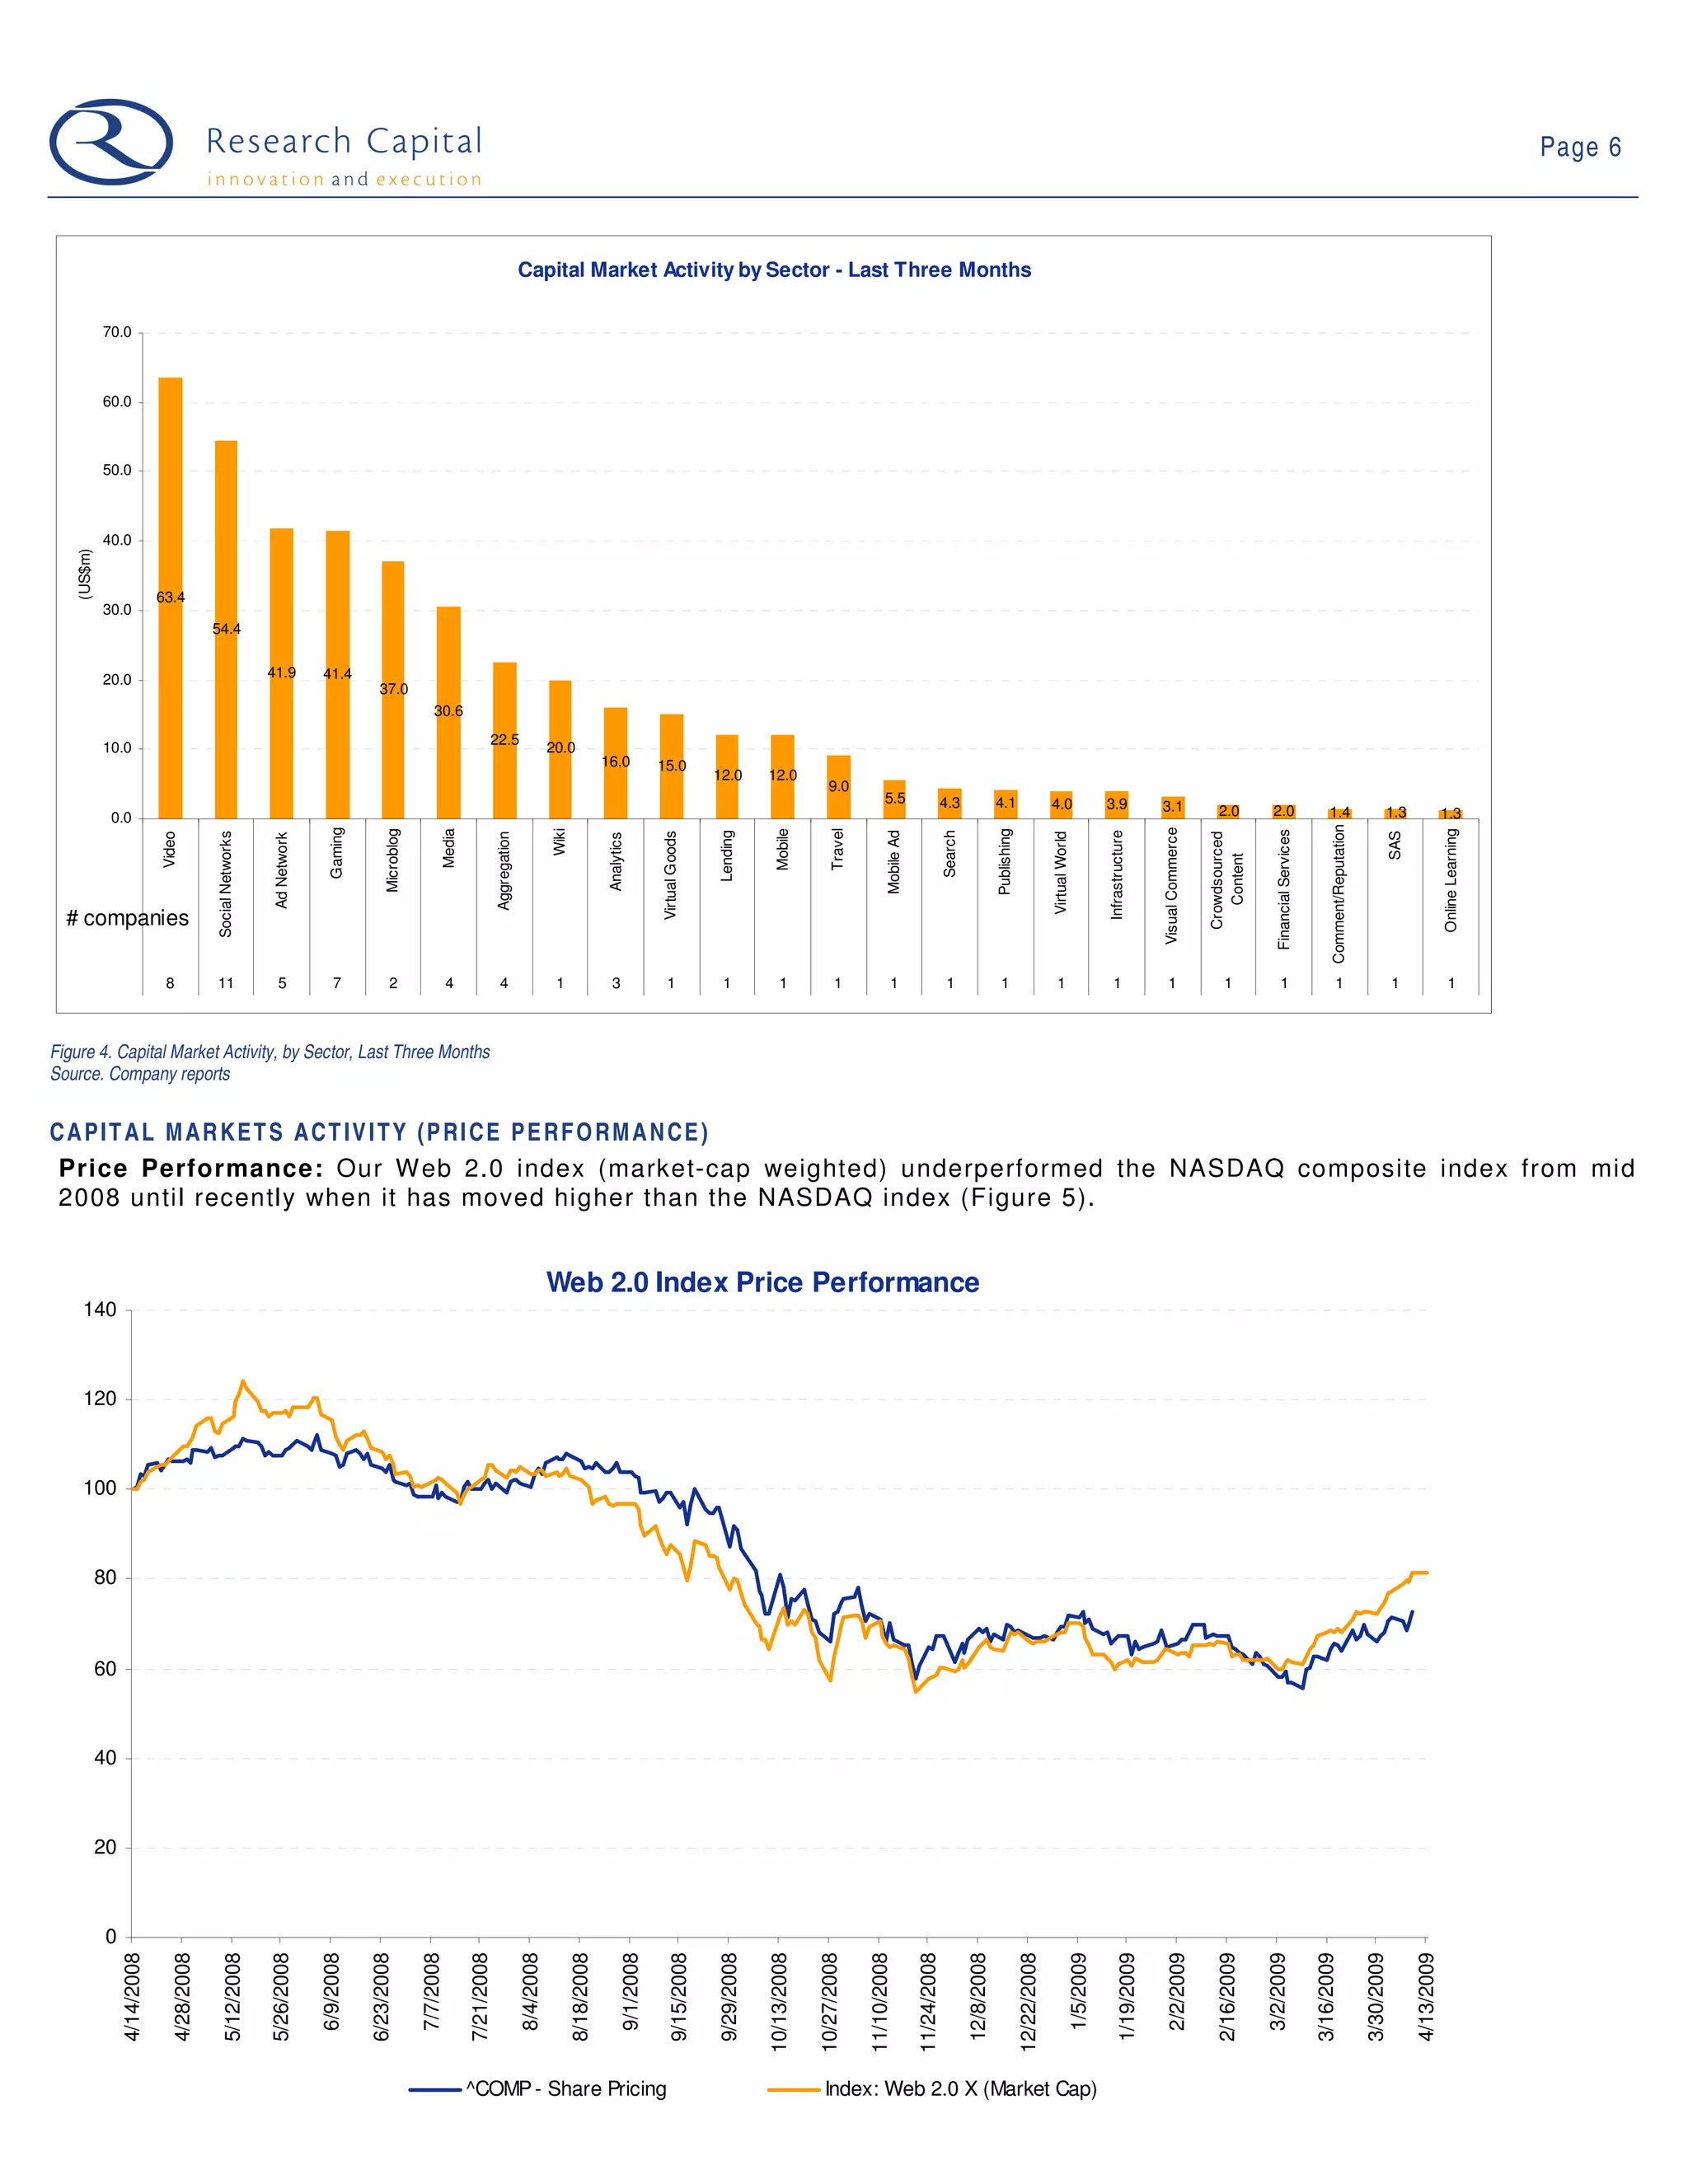
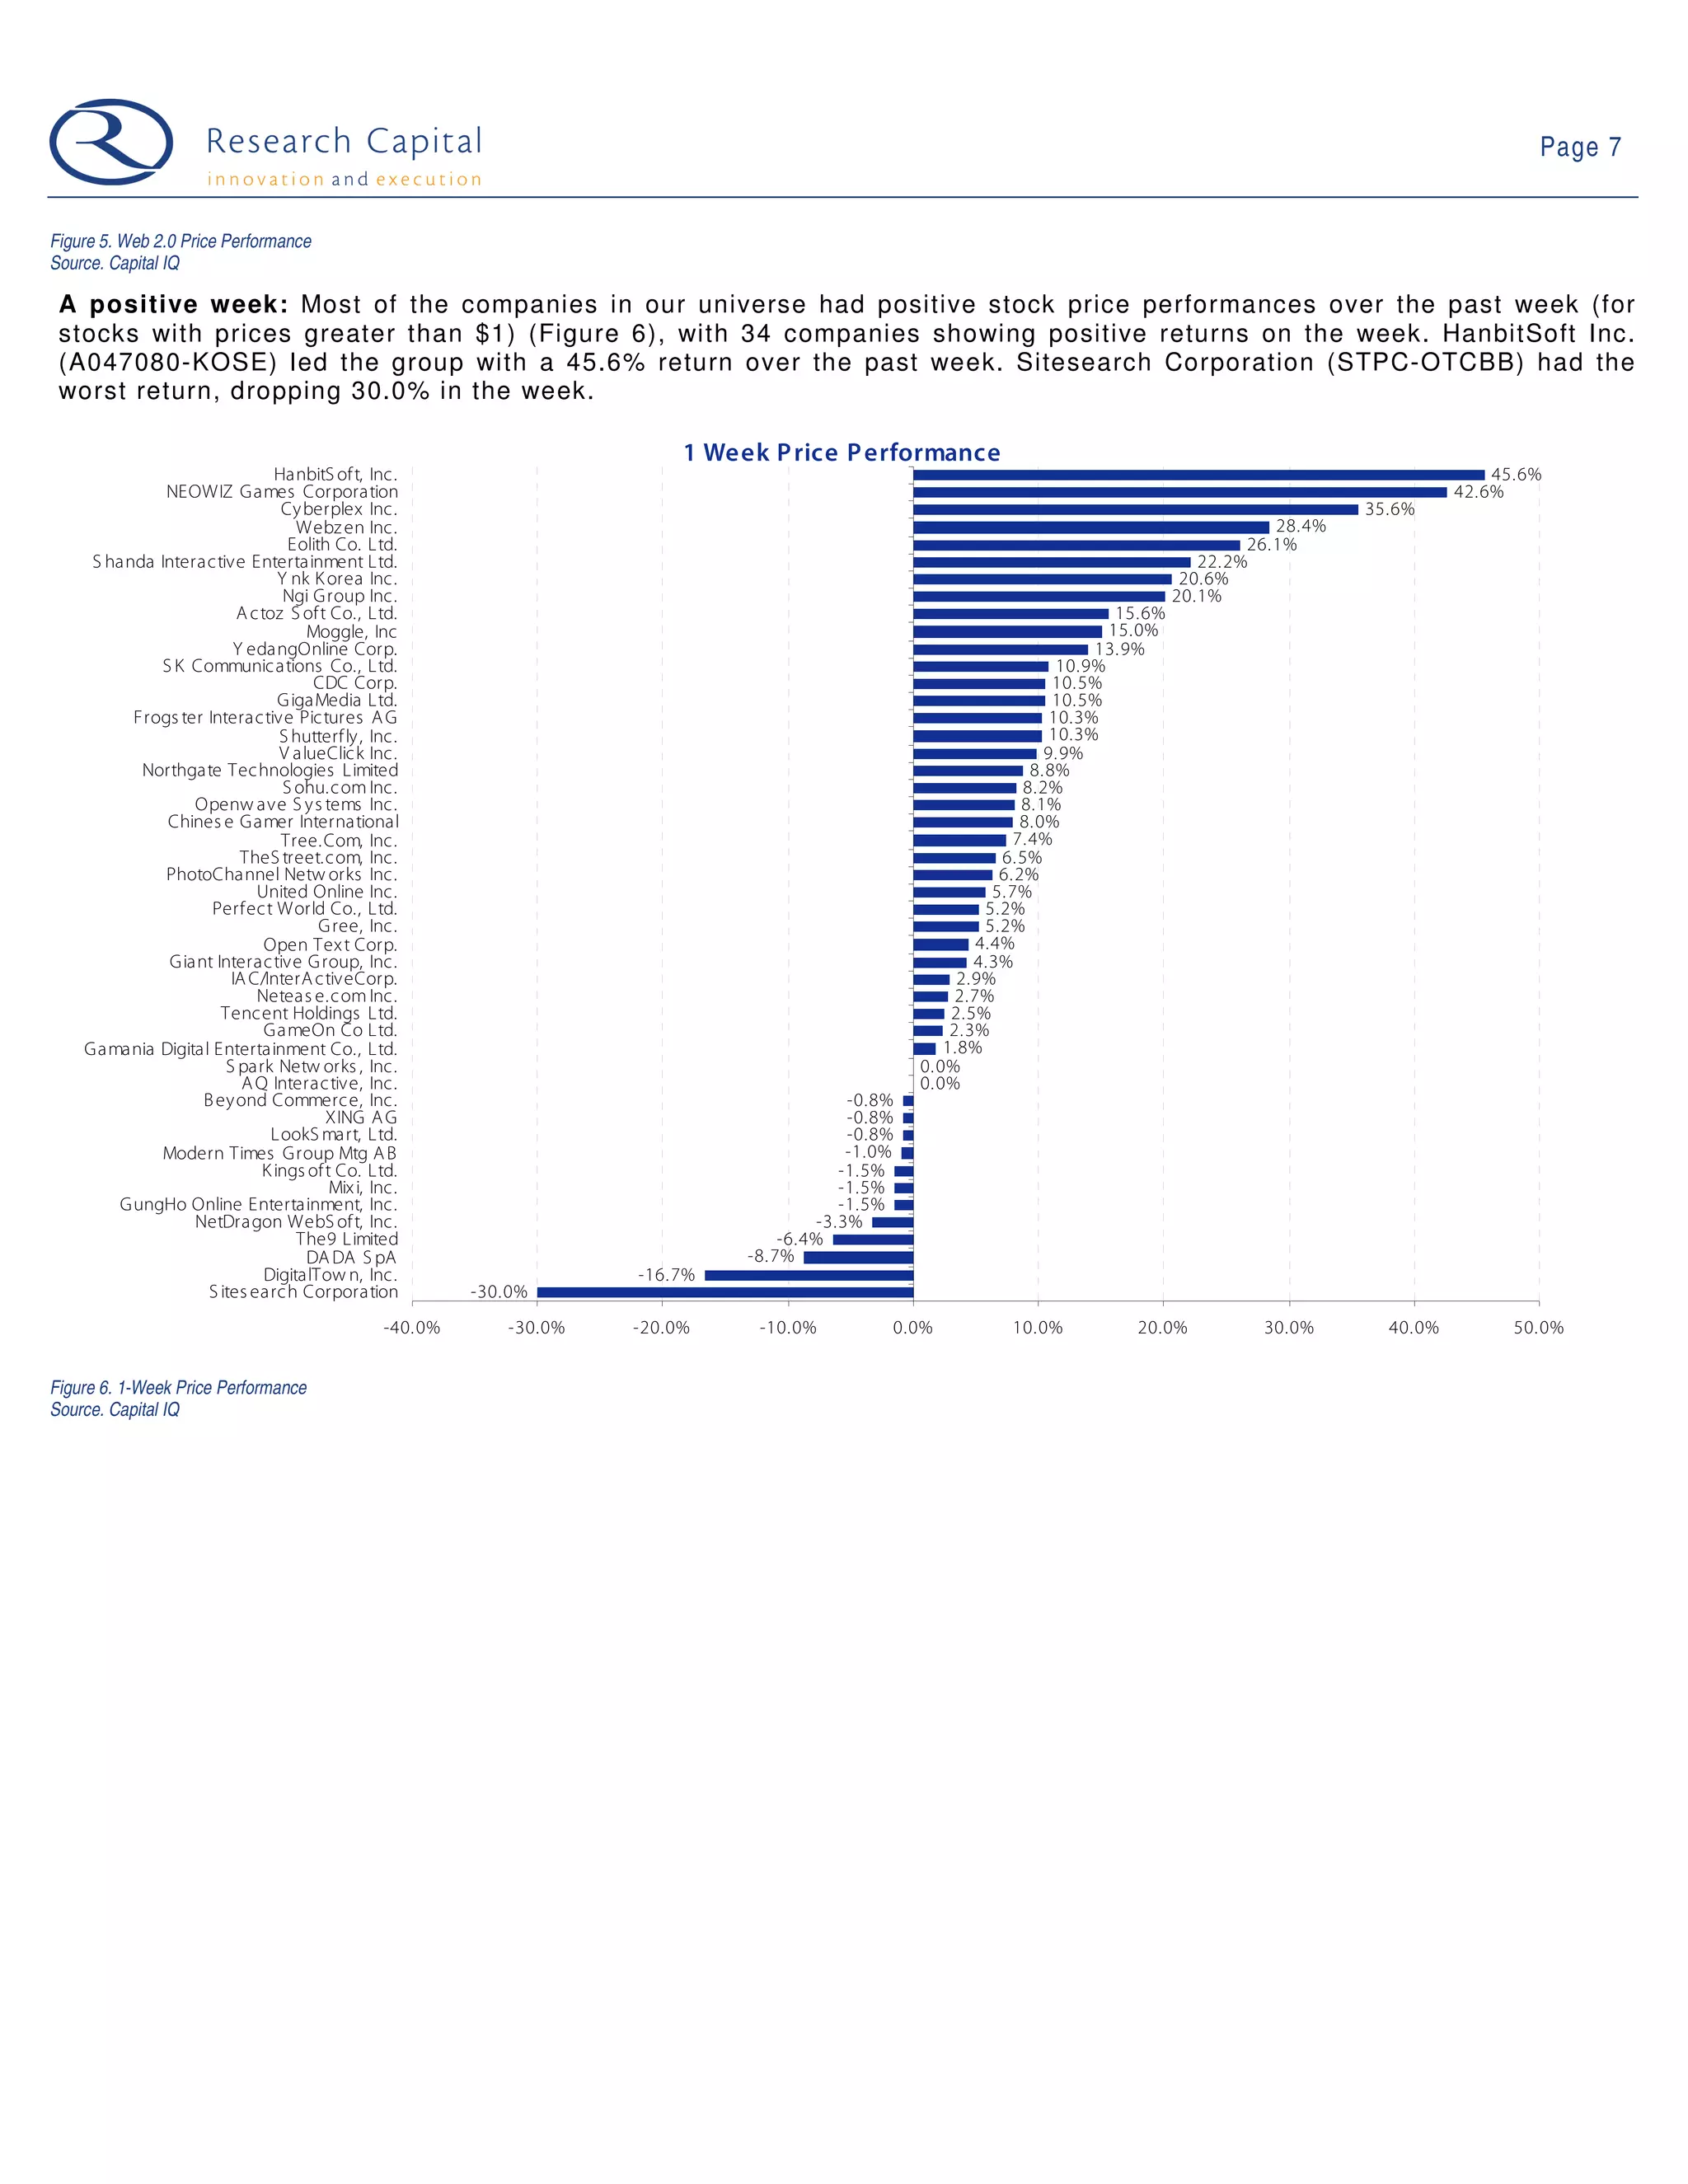
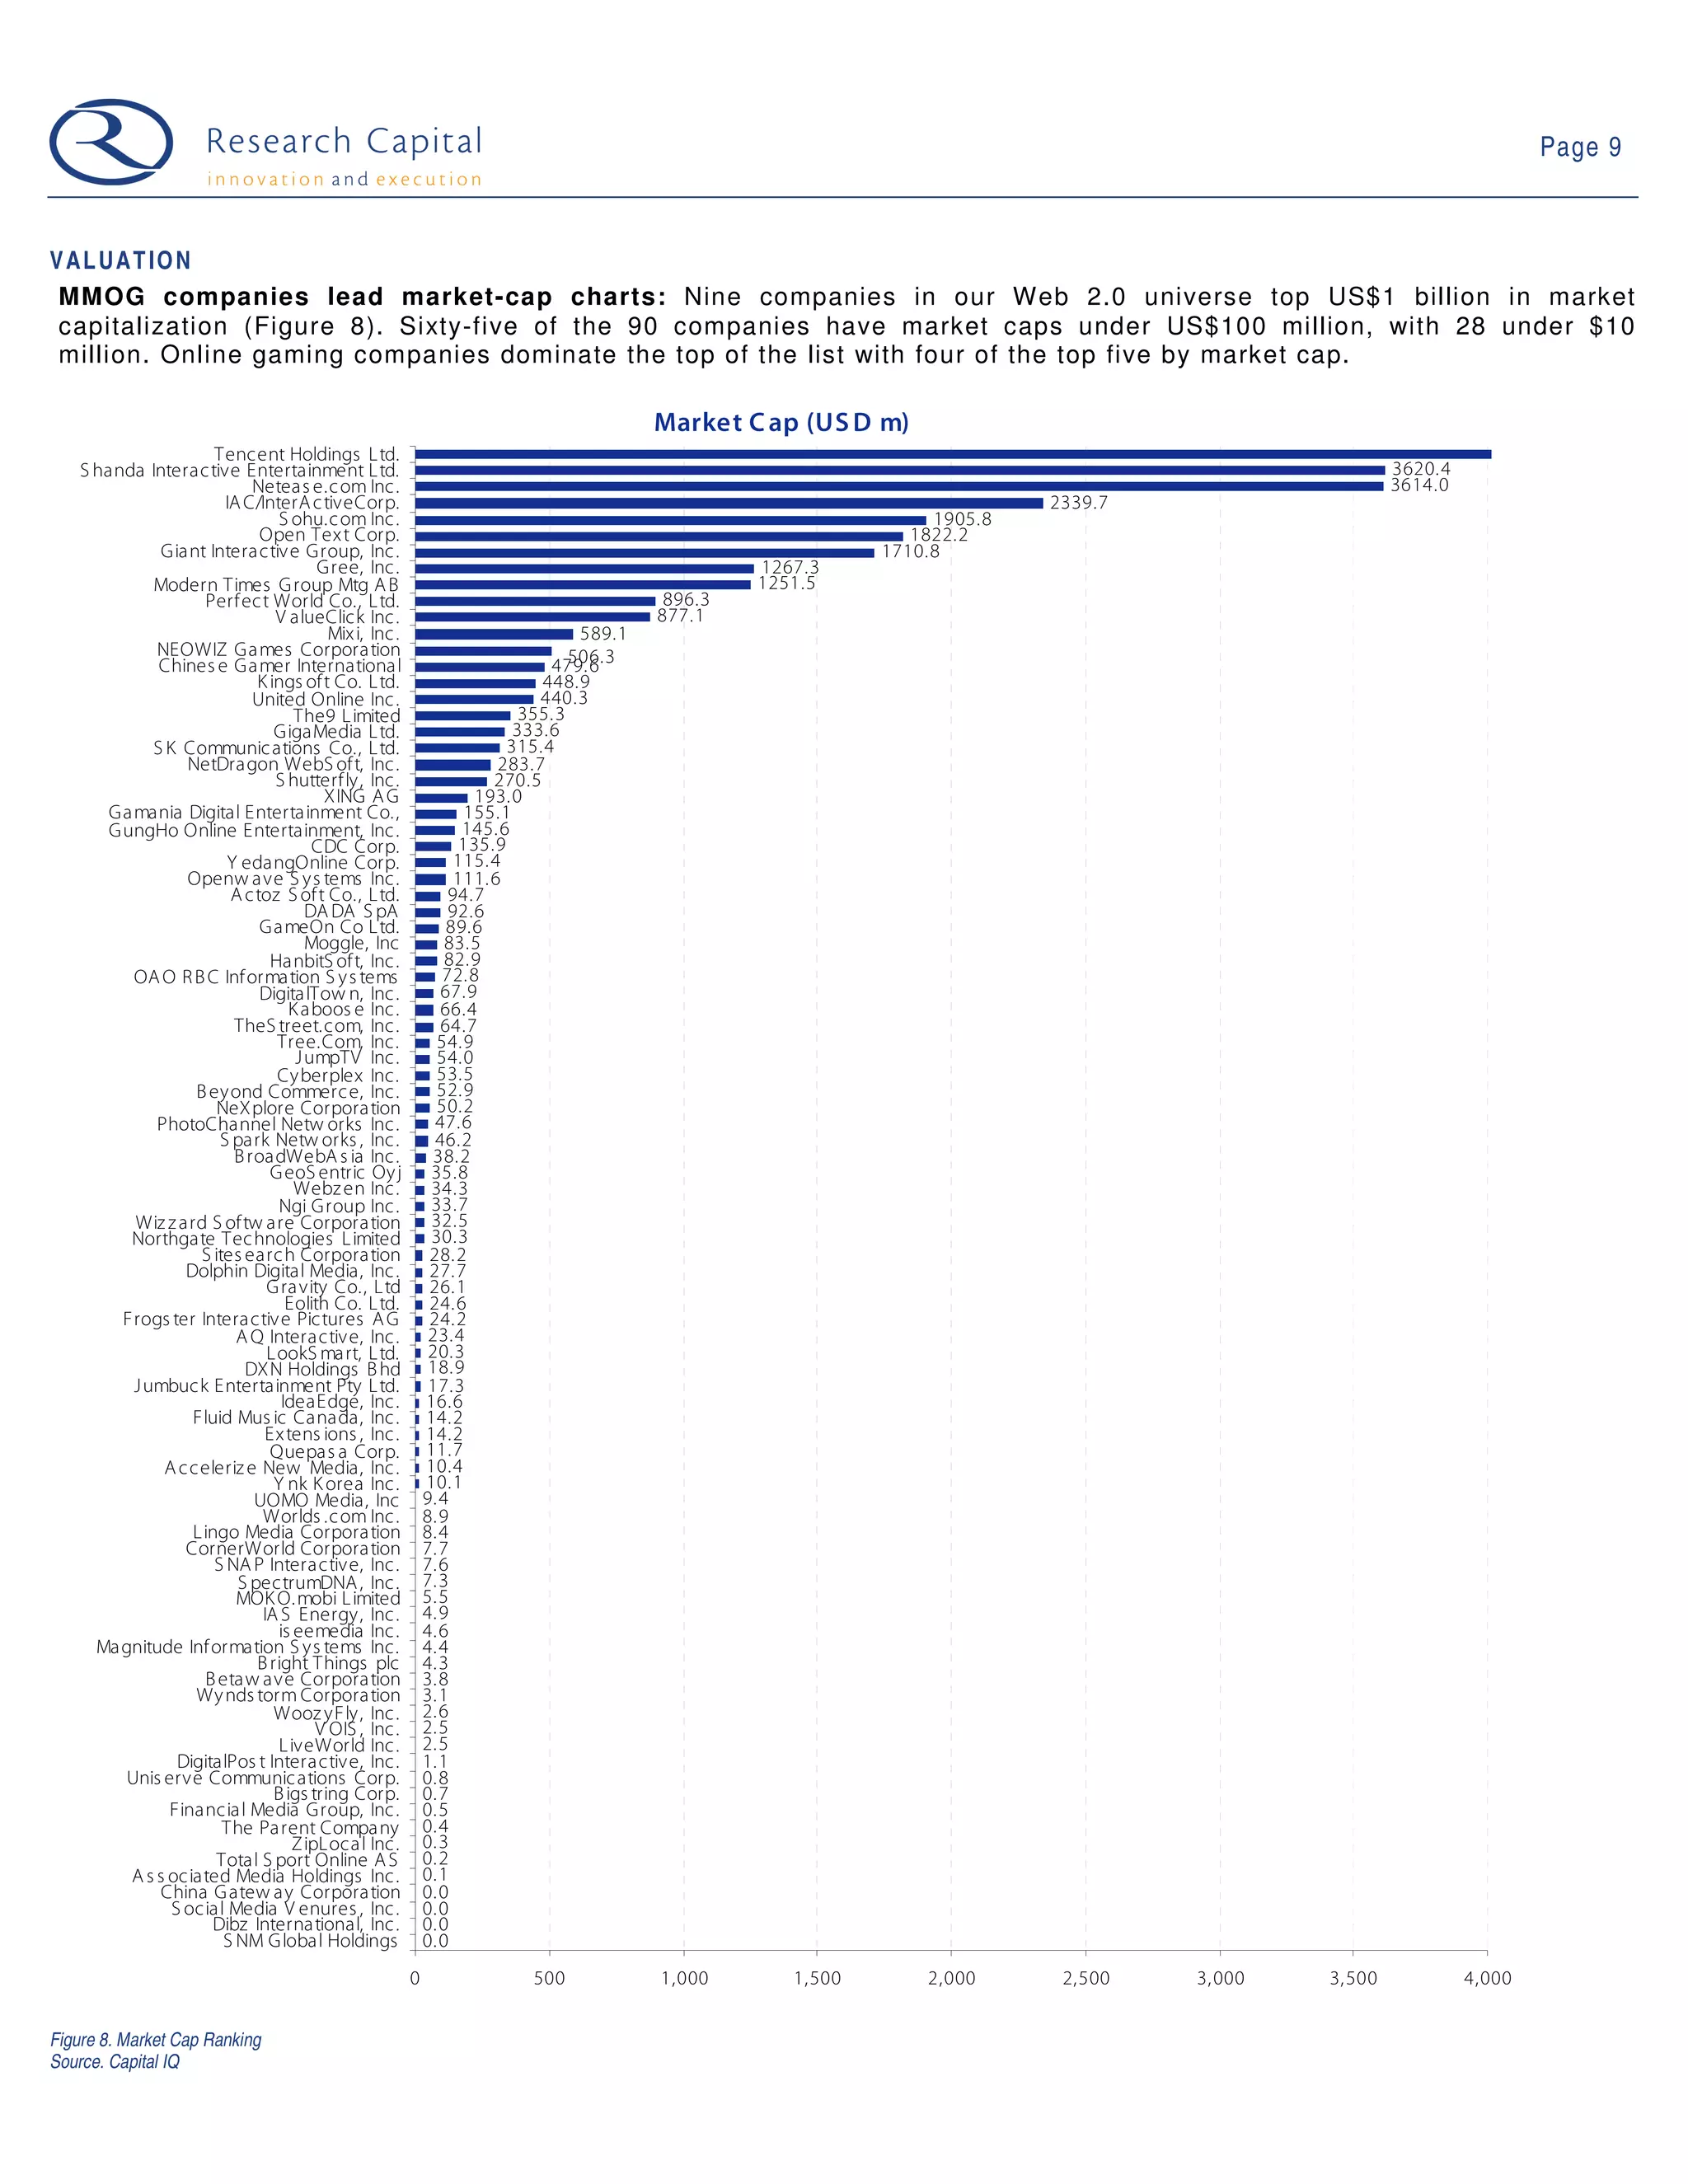
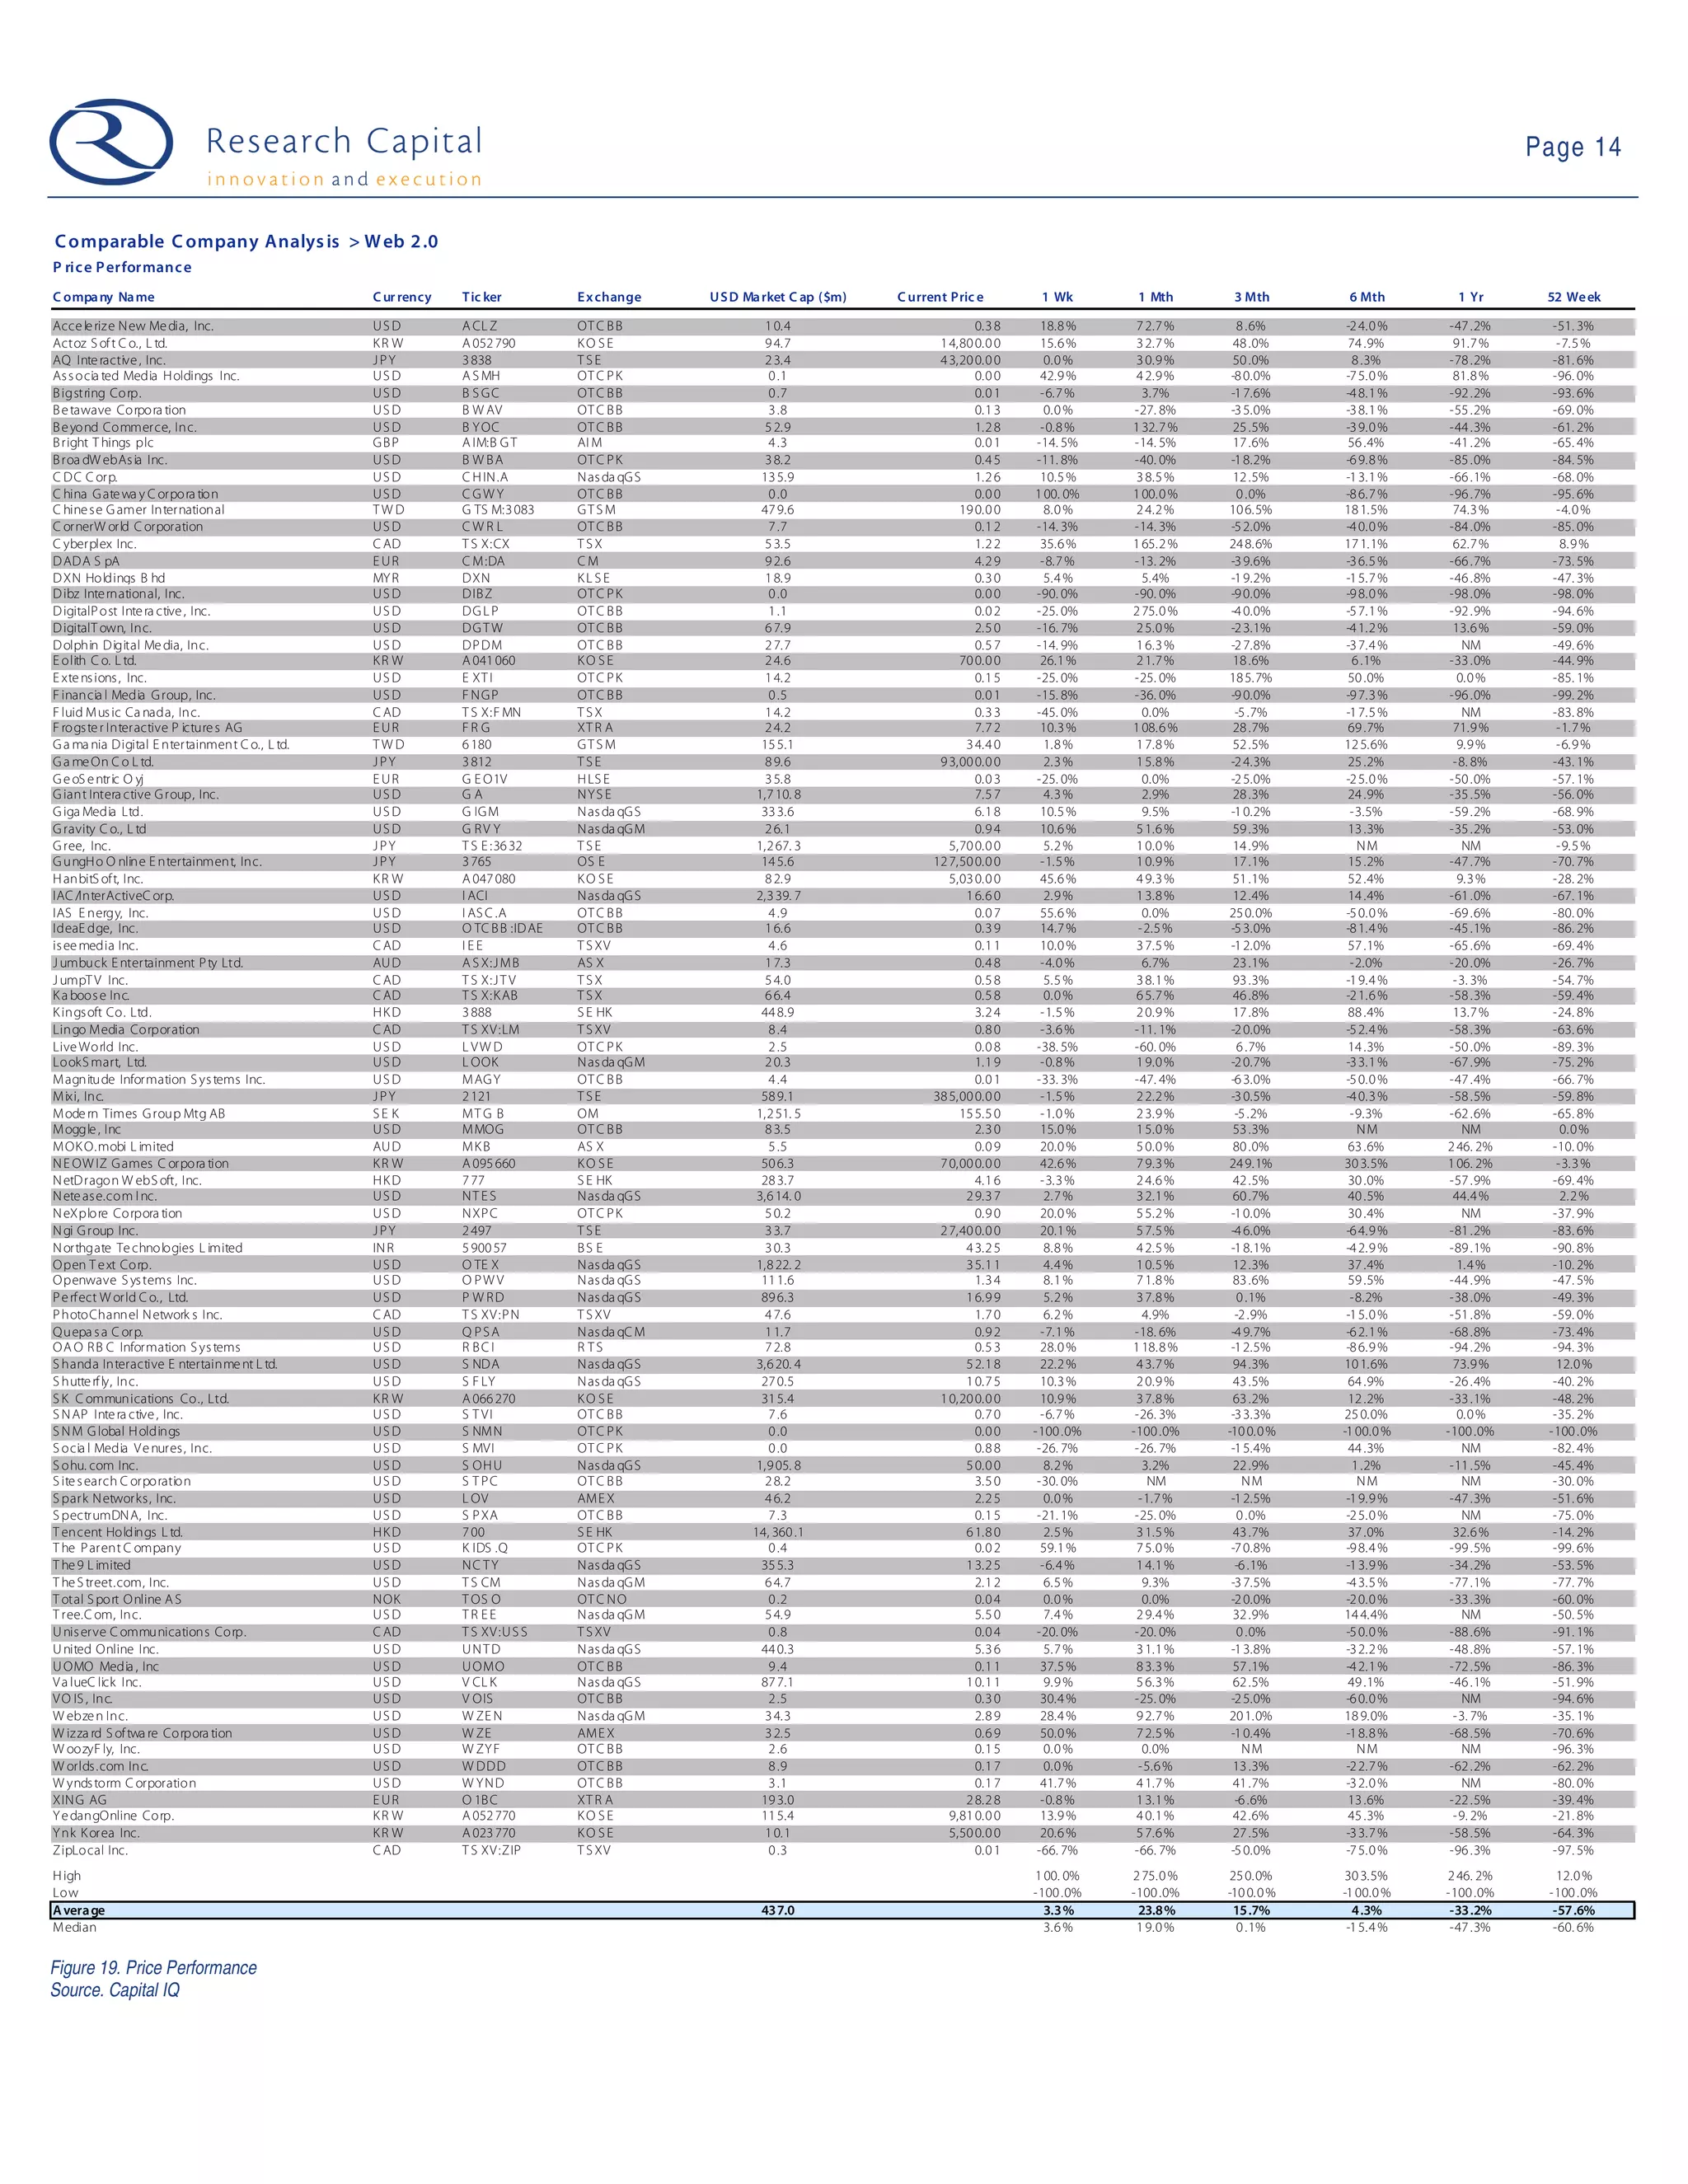
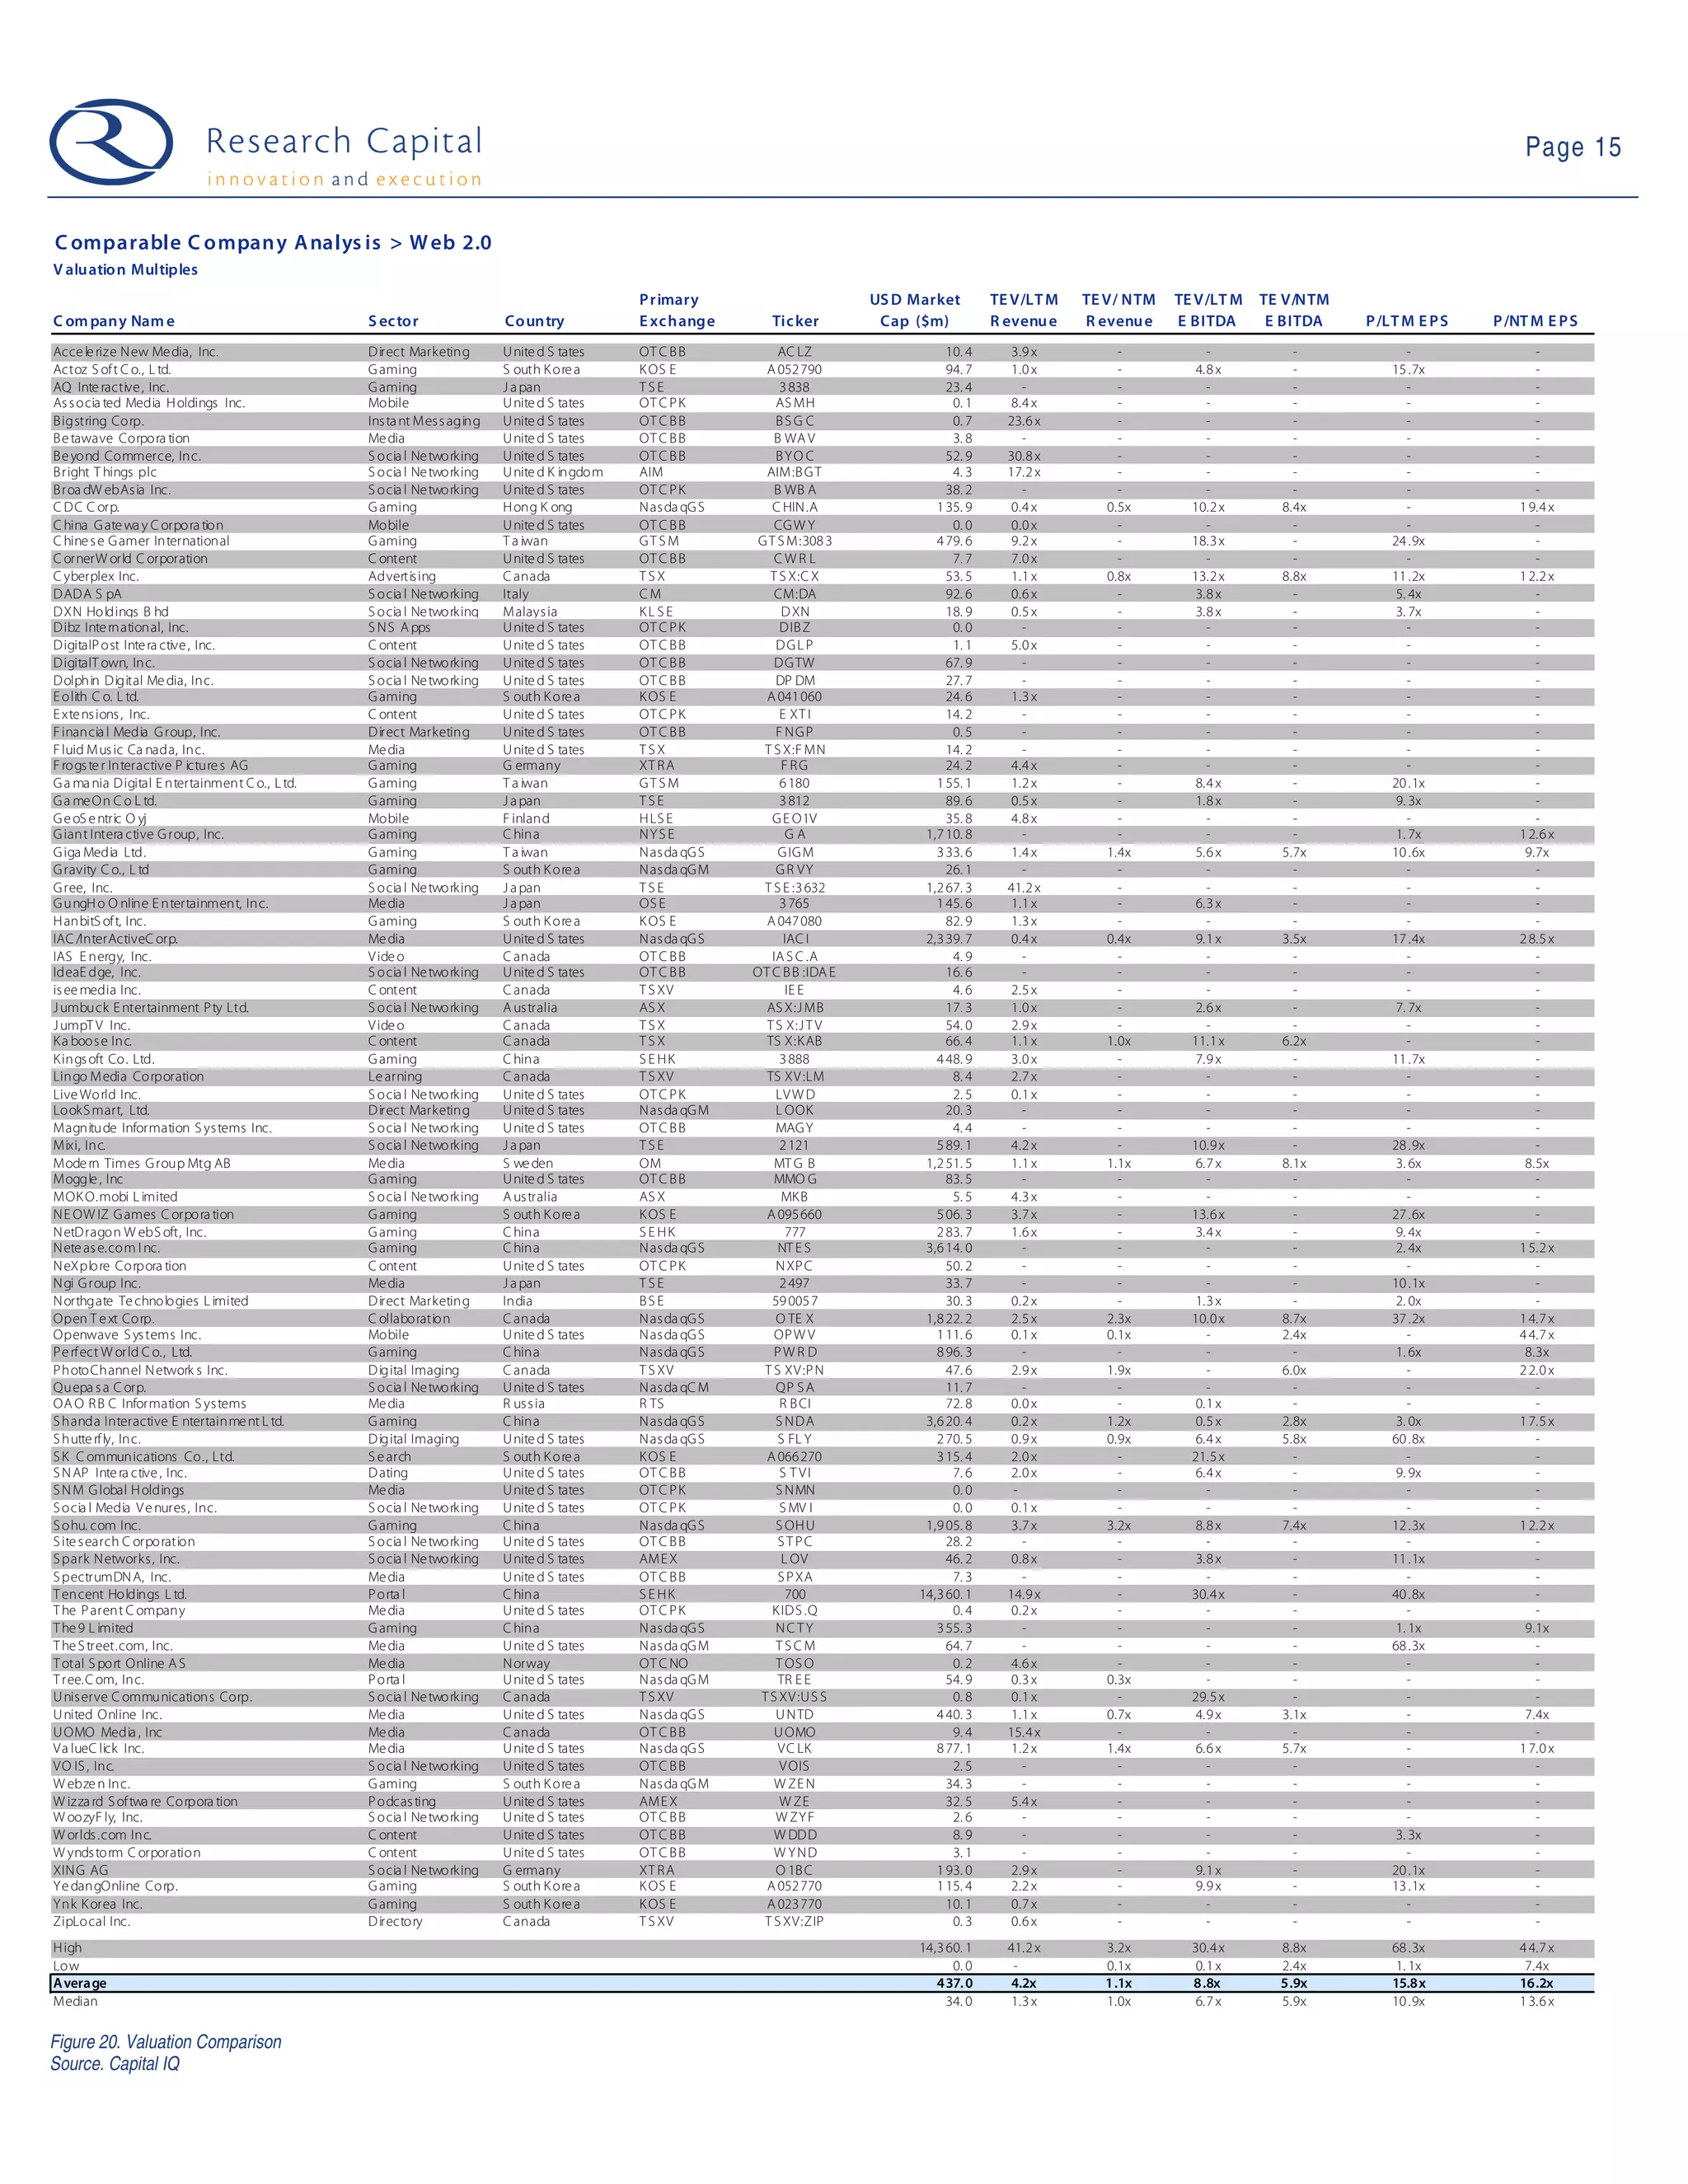
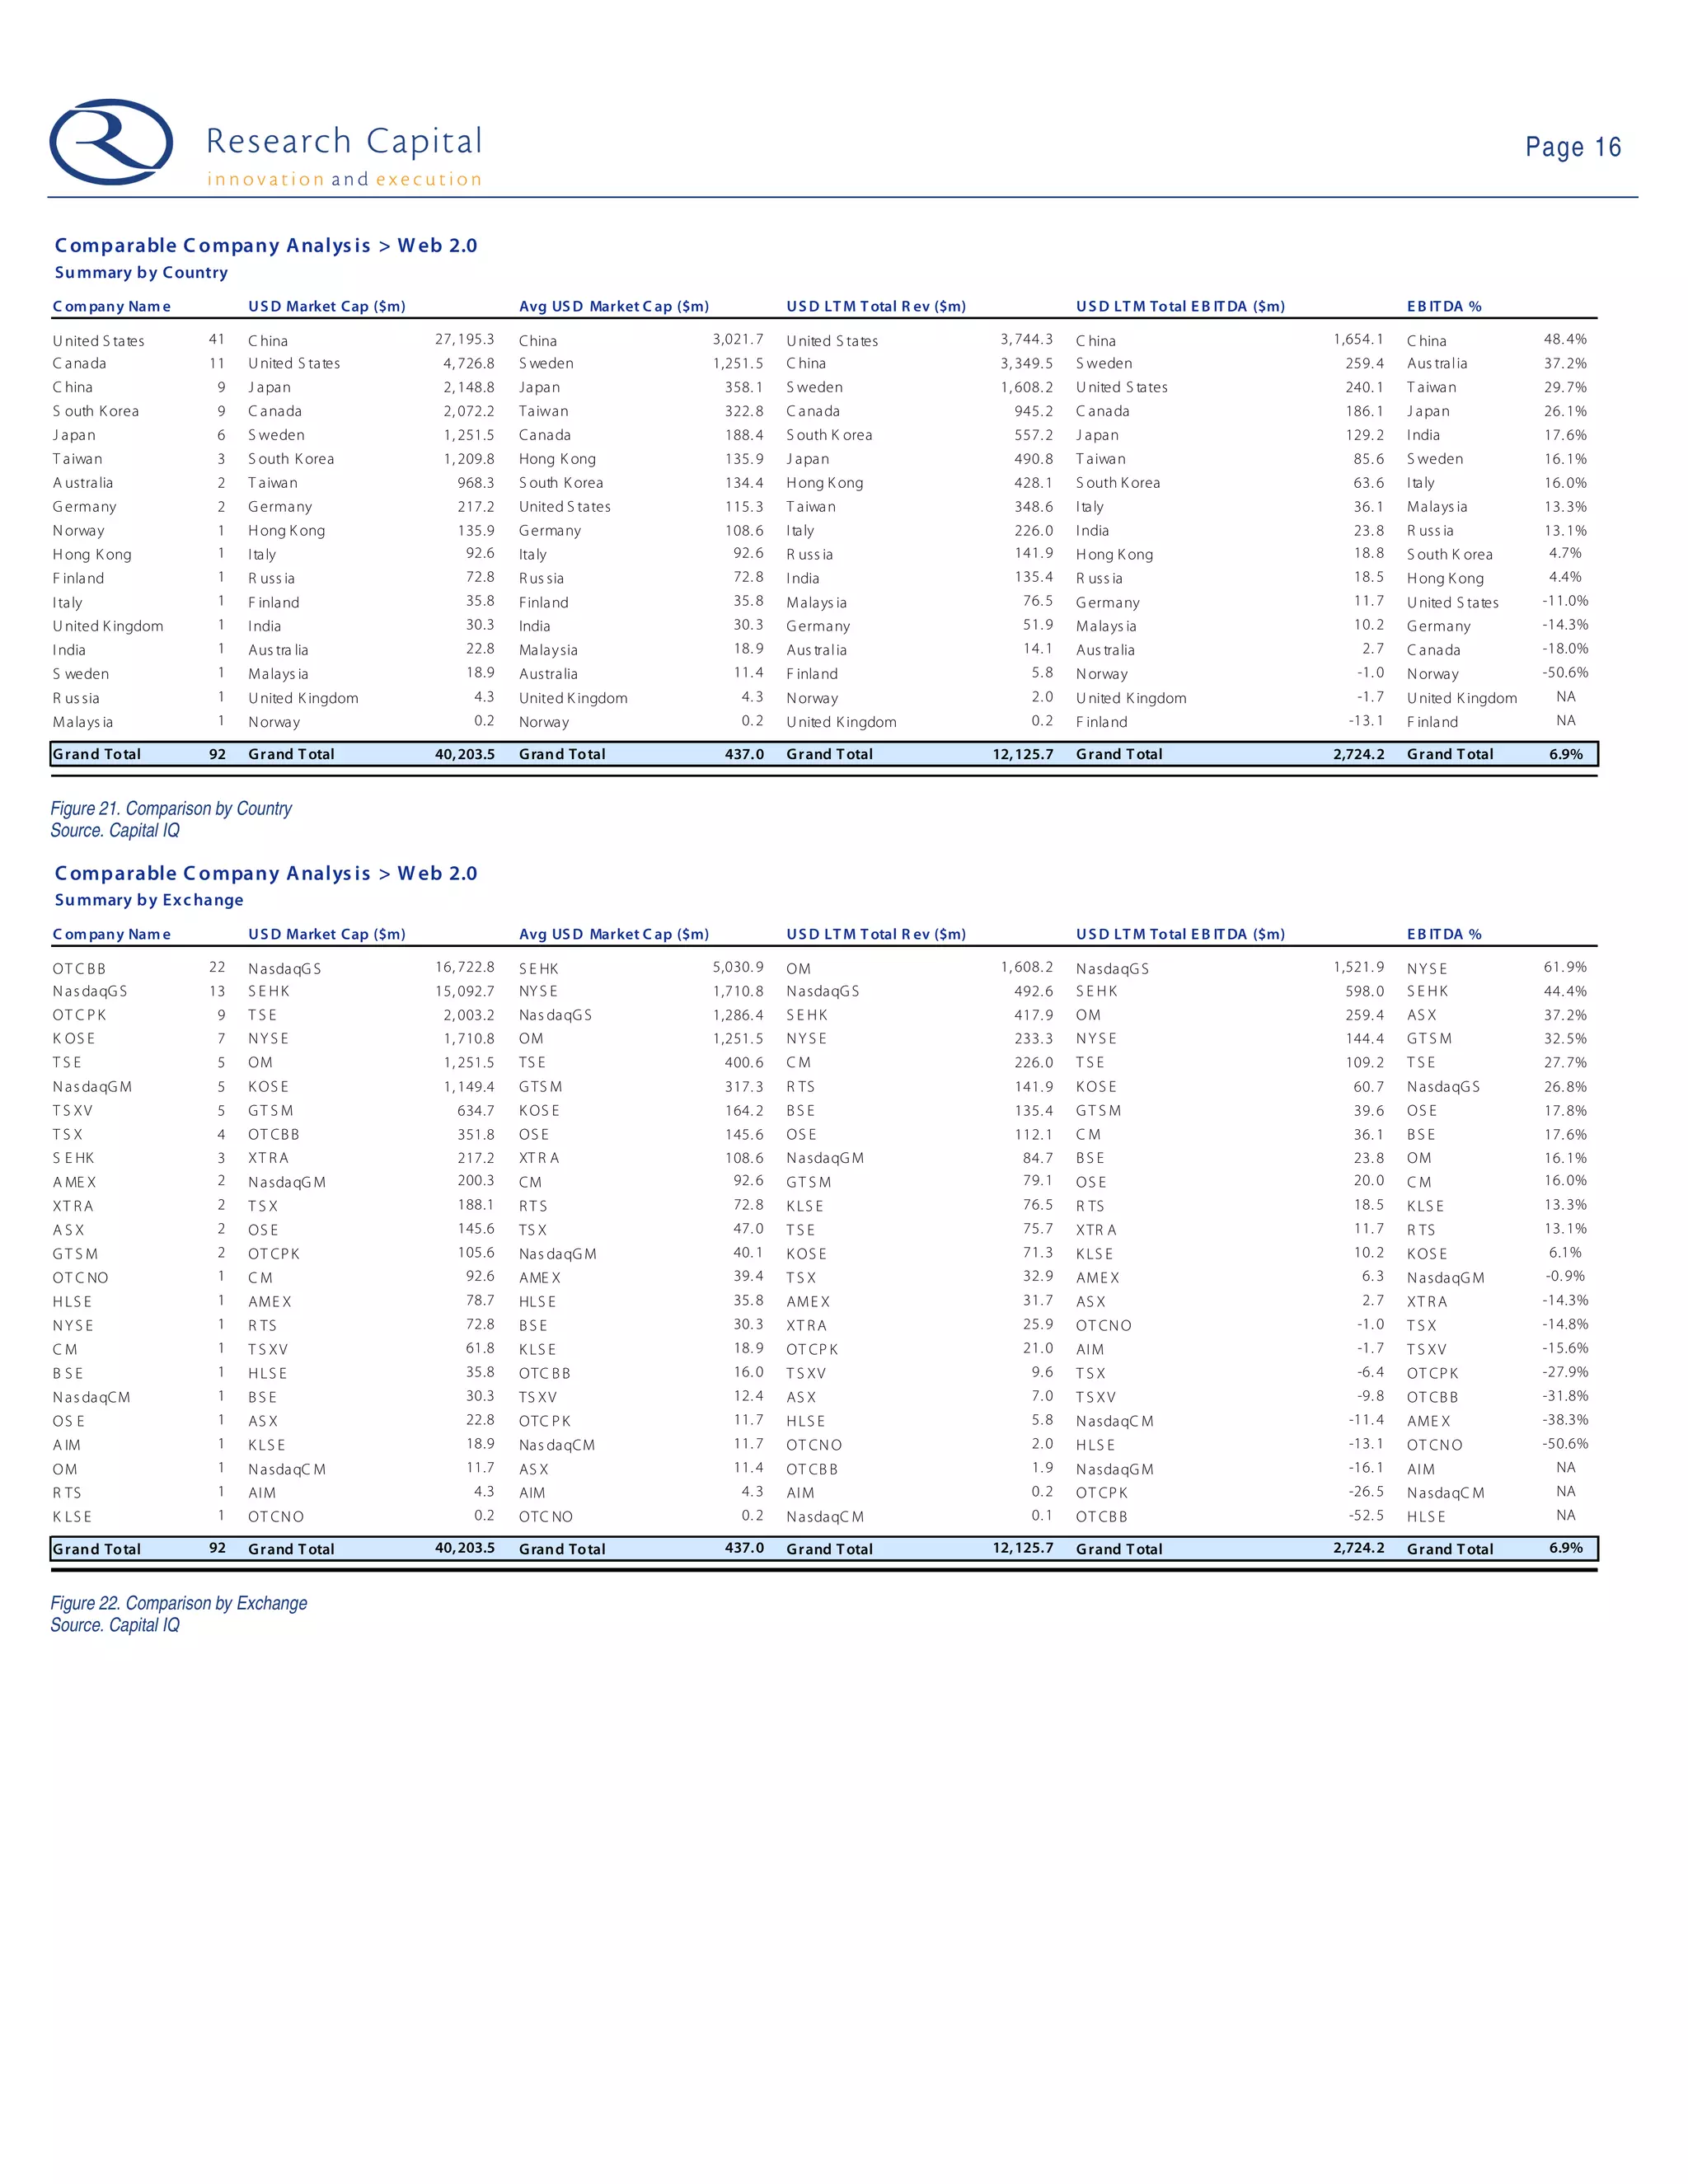
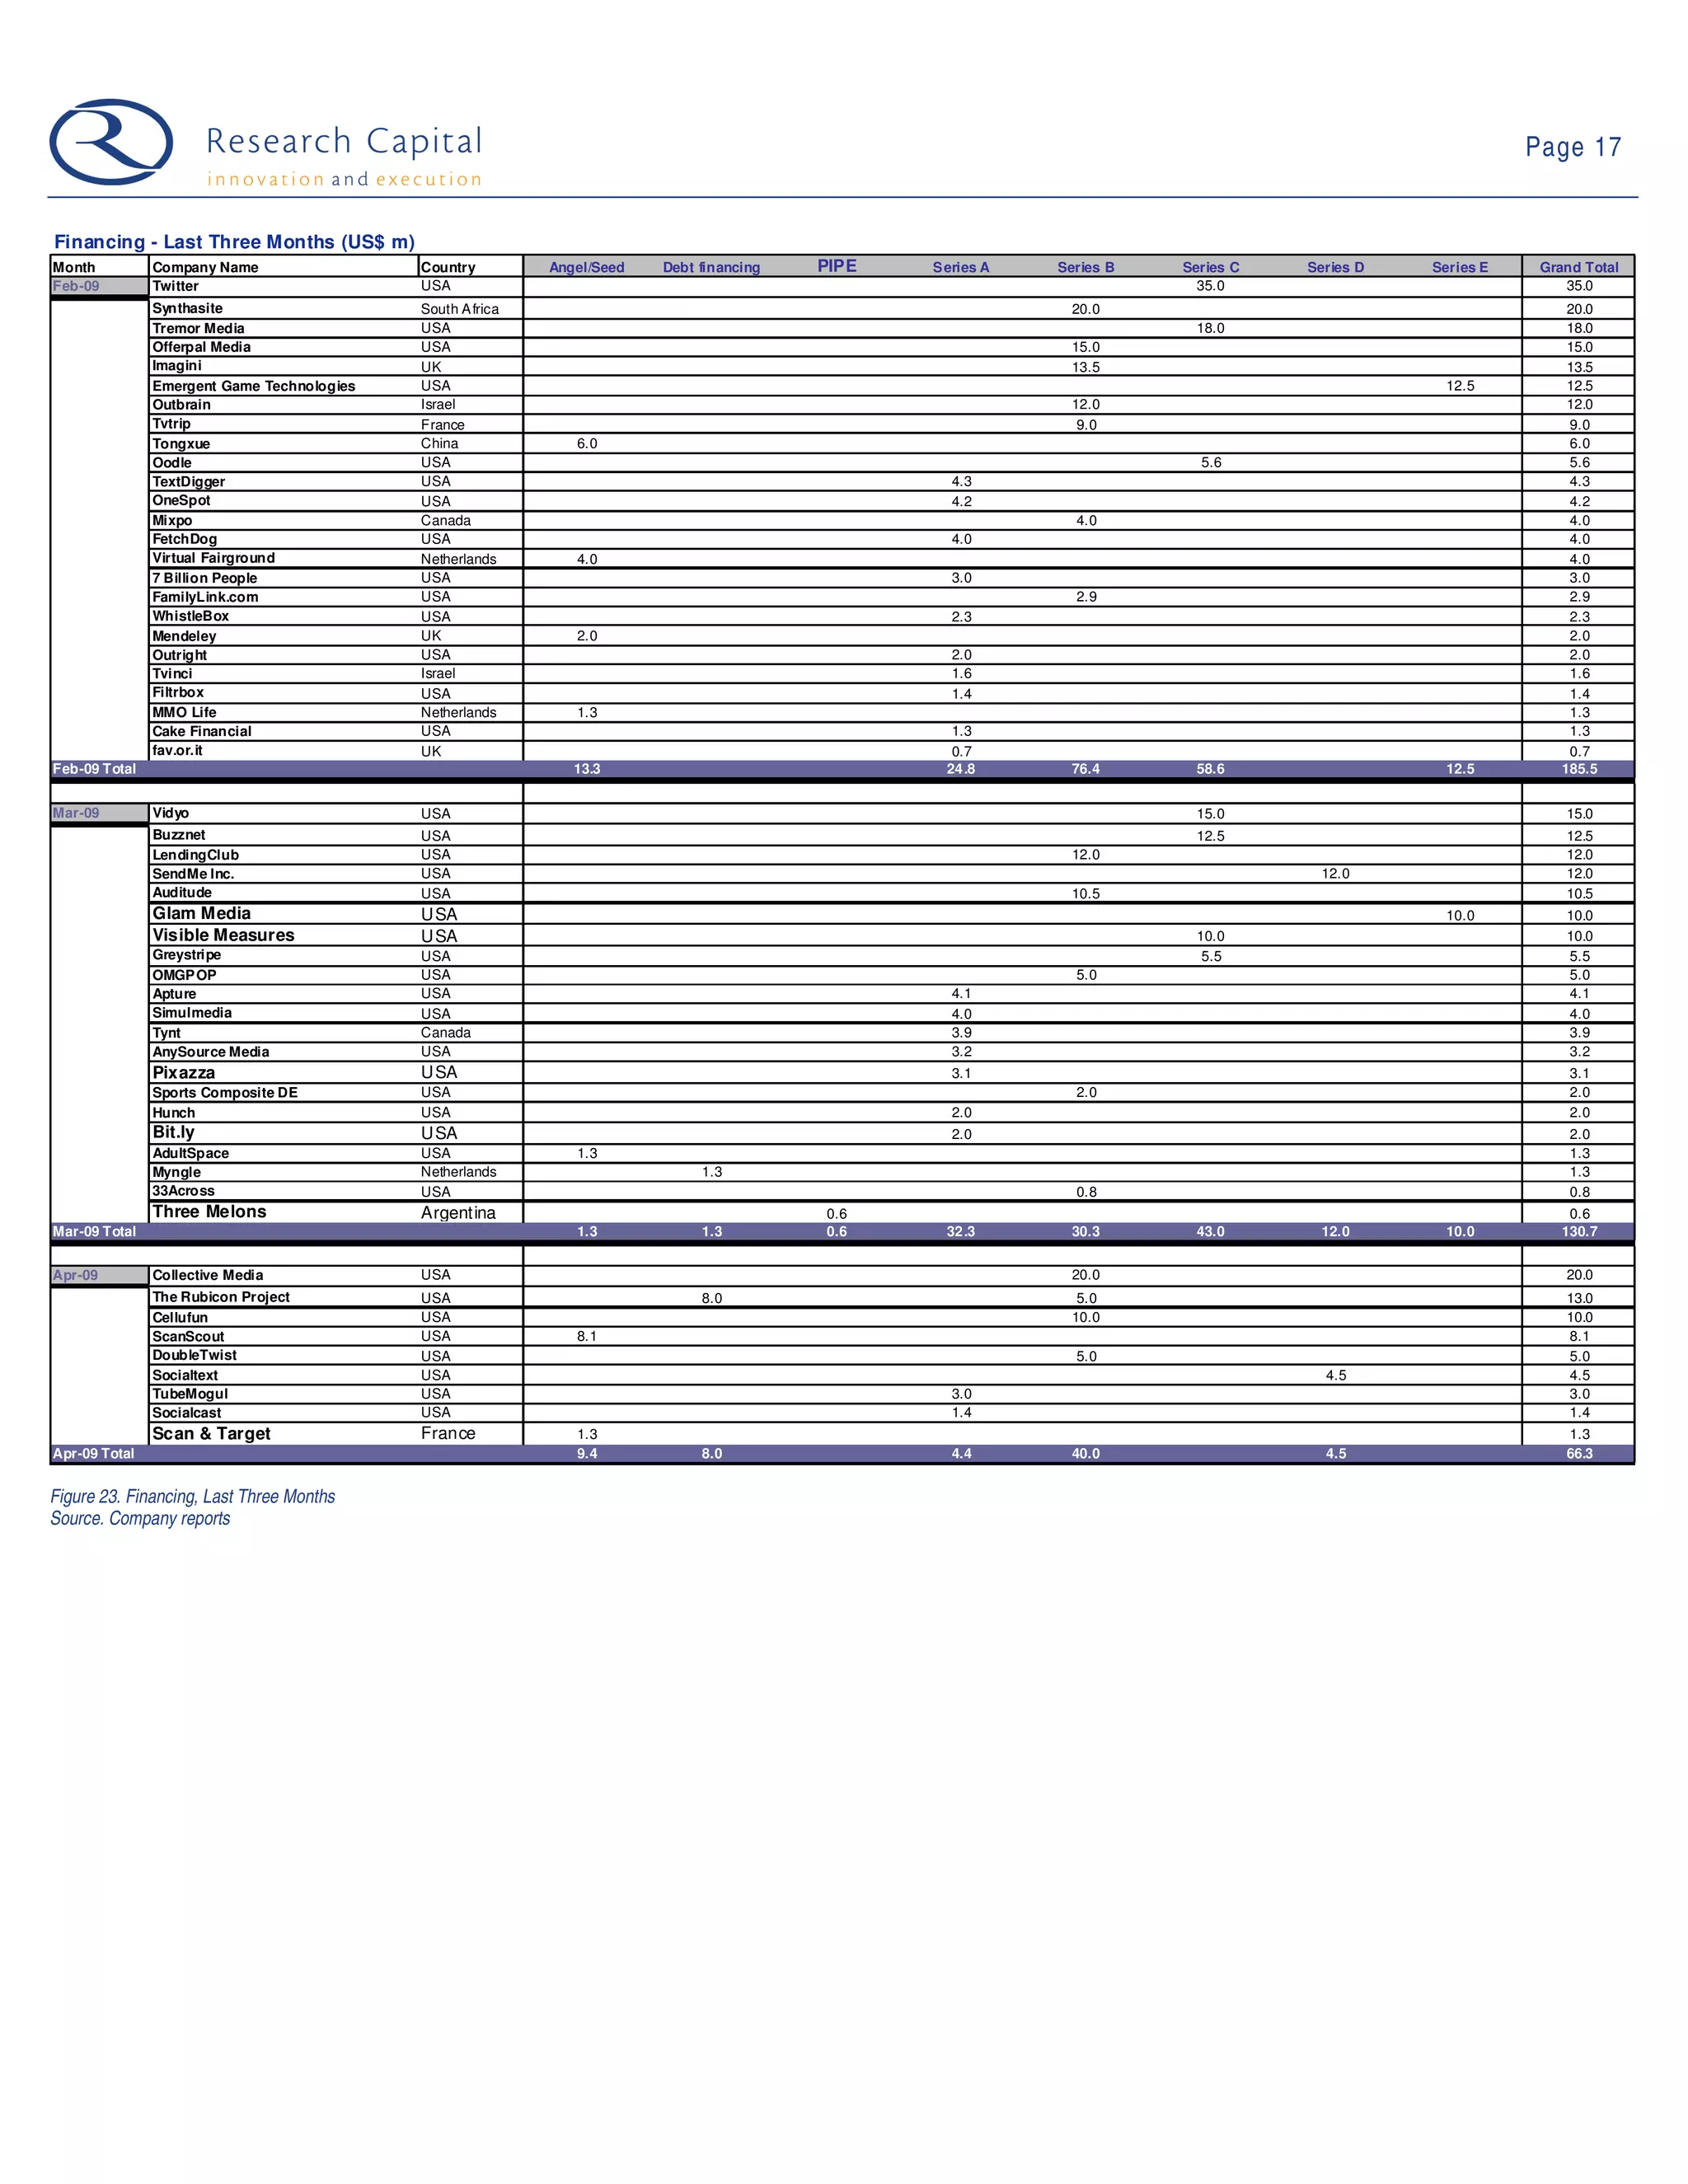

In April 2009, capital market activity witnessed nine financings totaling $66.3 million, with a significant contribution from three large deals, though the number of transactions remains lower than previous months. The Web 2.0 universe consists of 92 companies with a combined market cap of $40 billion, showing generally profitable performance metrics. Notable price performances included gaming company Hanbitsoft, which climbed 45.6% during the week.


![Trinidad & Tobago - Trade Profile [UWI's Shridath Ramphal Centre]](https://cdn.slidesharecdn.com/ss_thumbnails/trinidadtobago-110615102333-phpapp01-thumbnail.jpg?width=640&height=640&fit=bounds)


