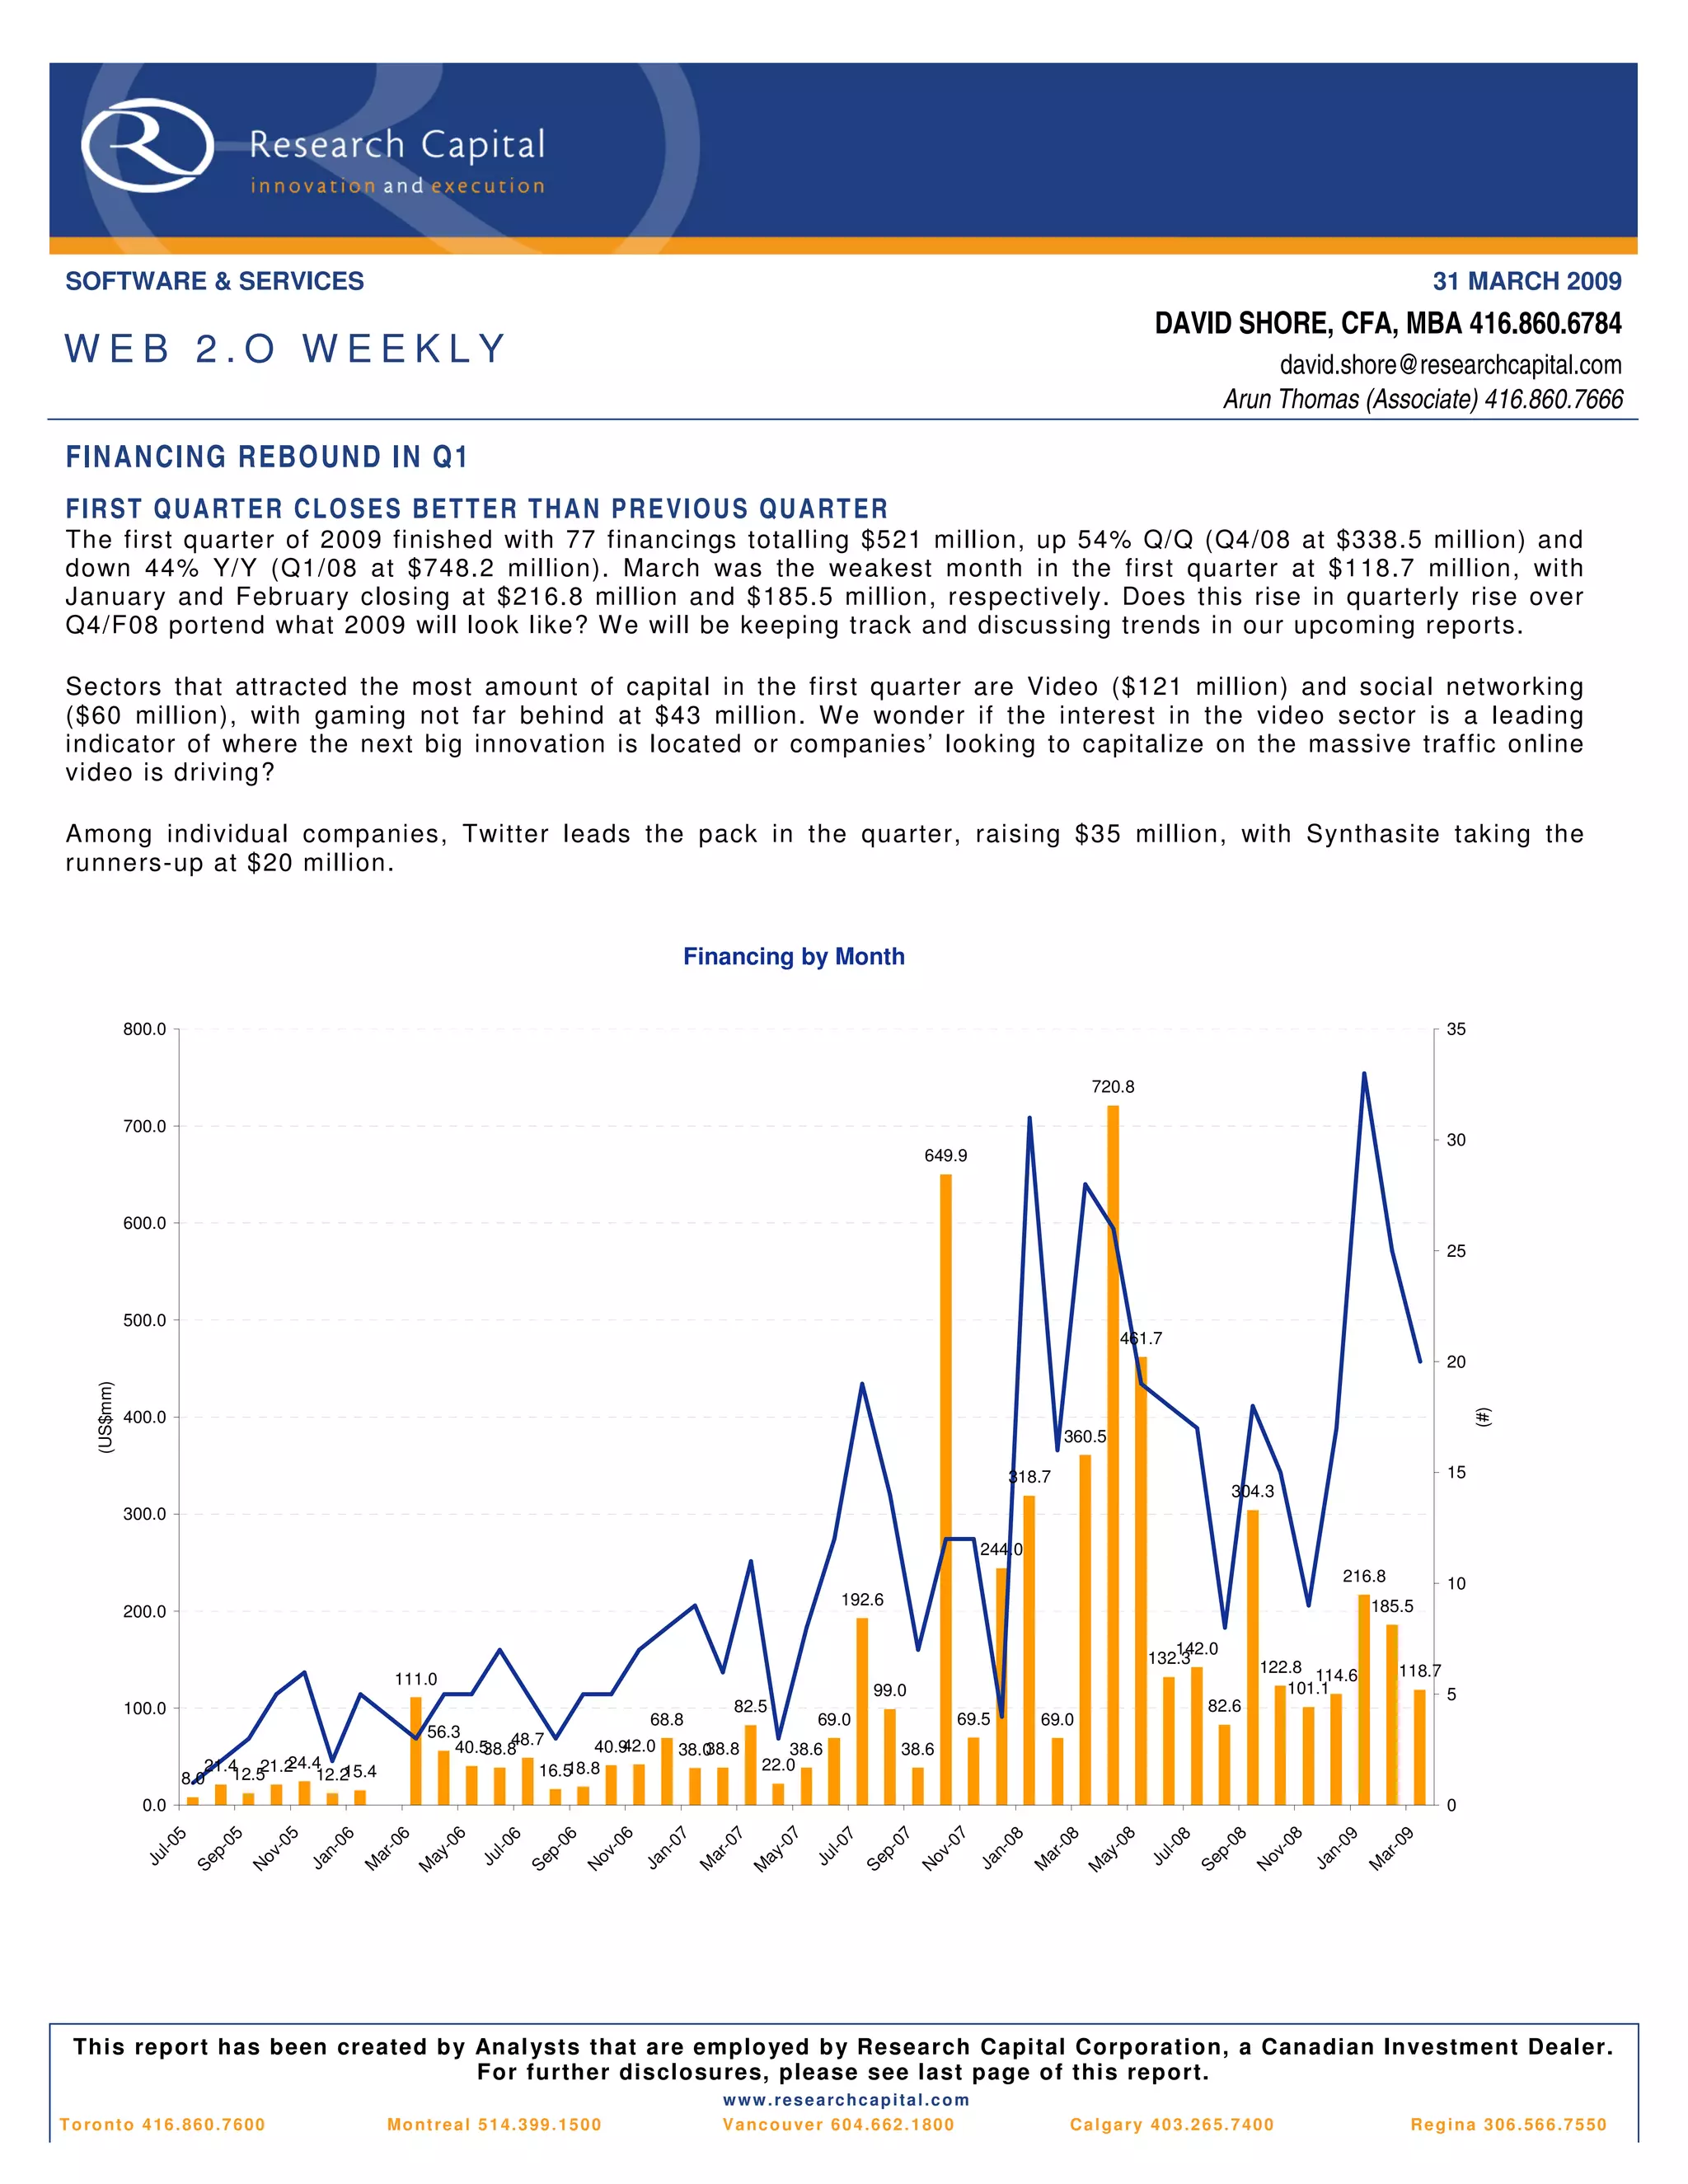
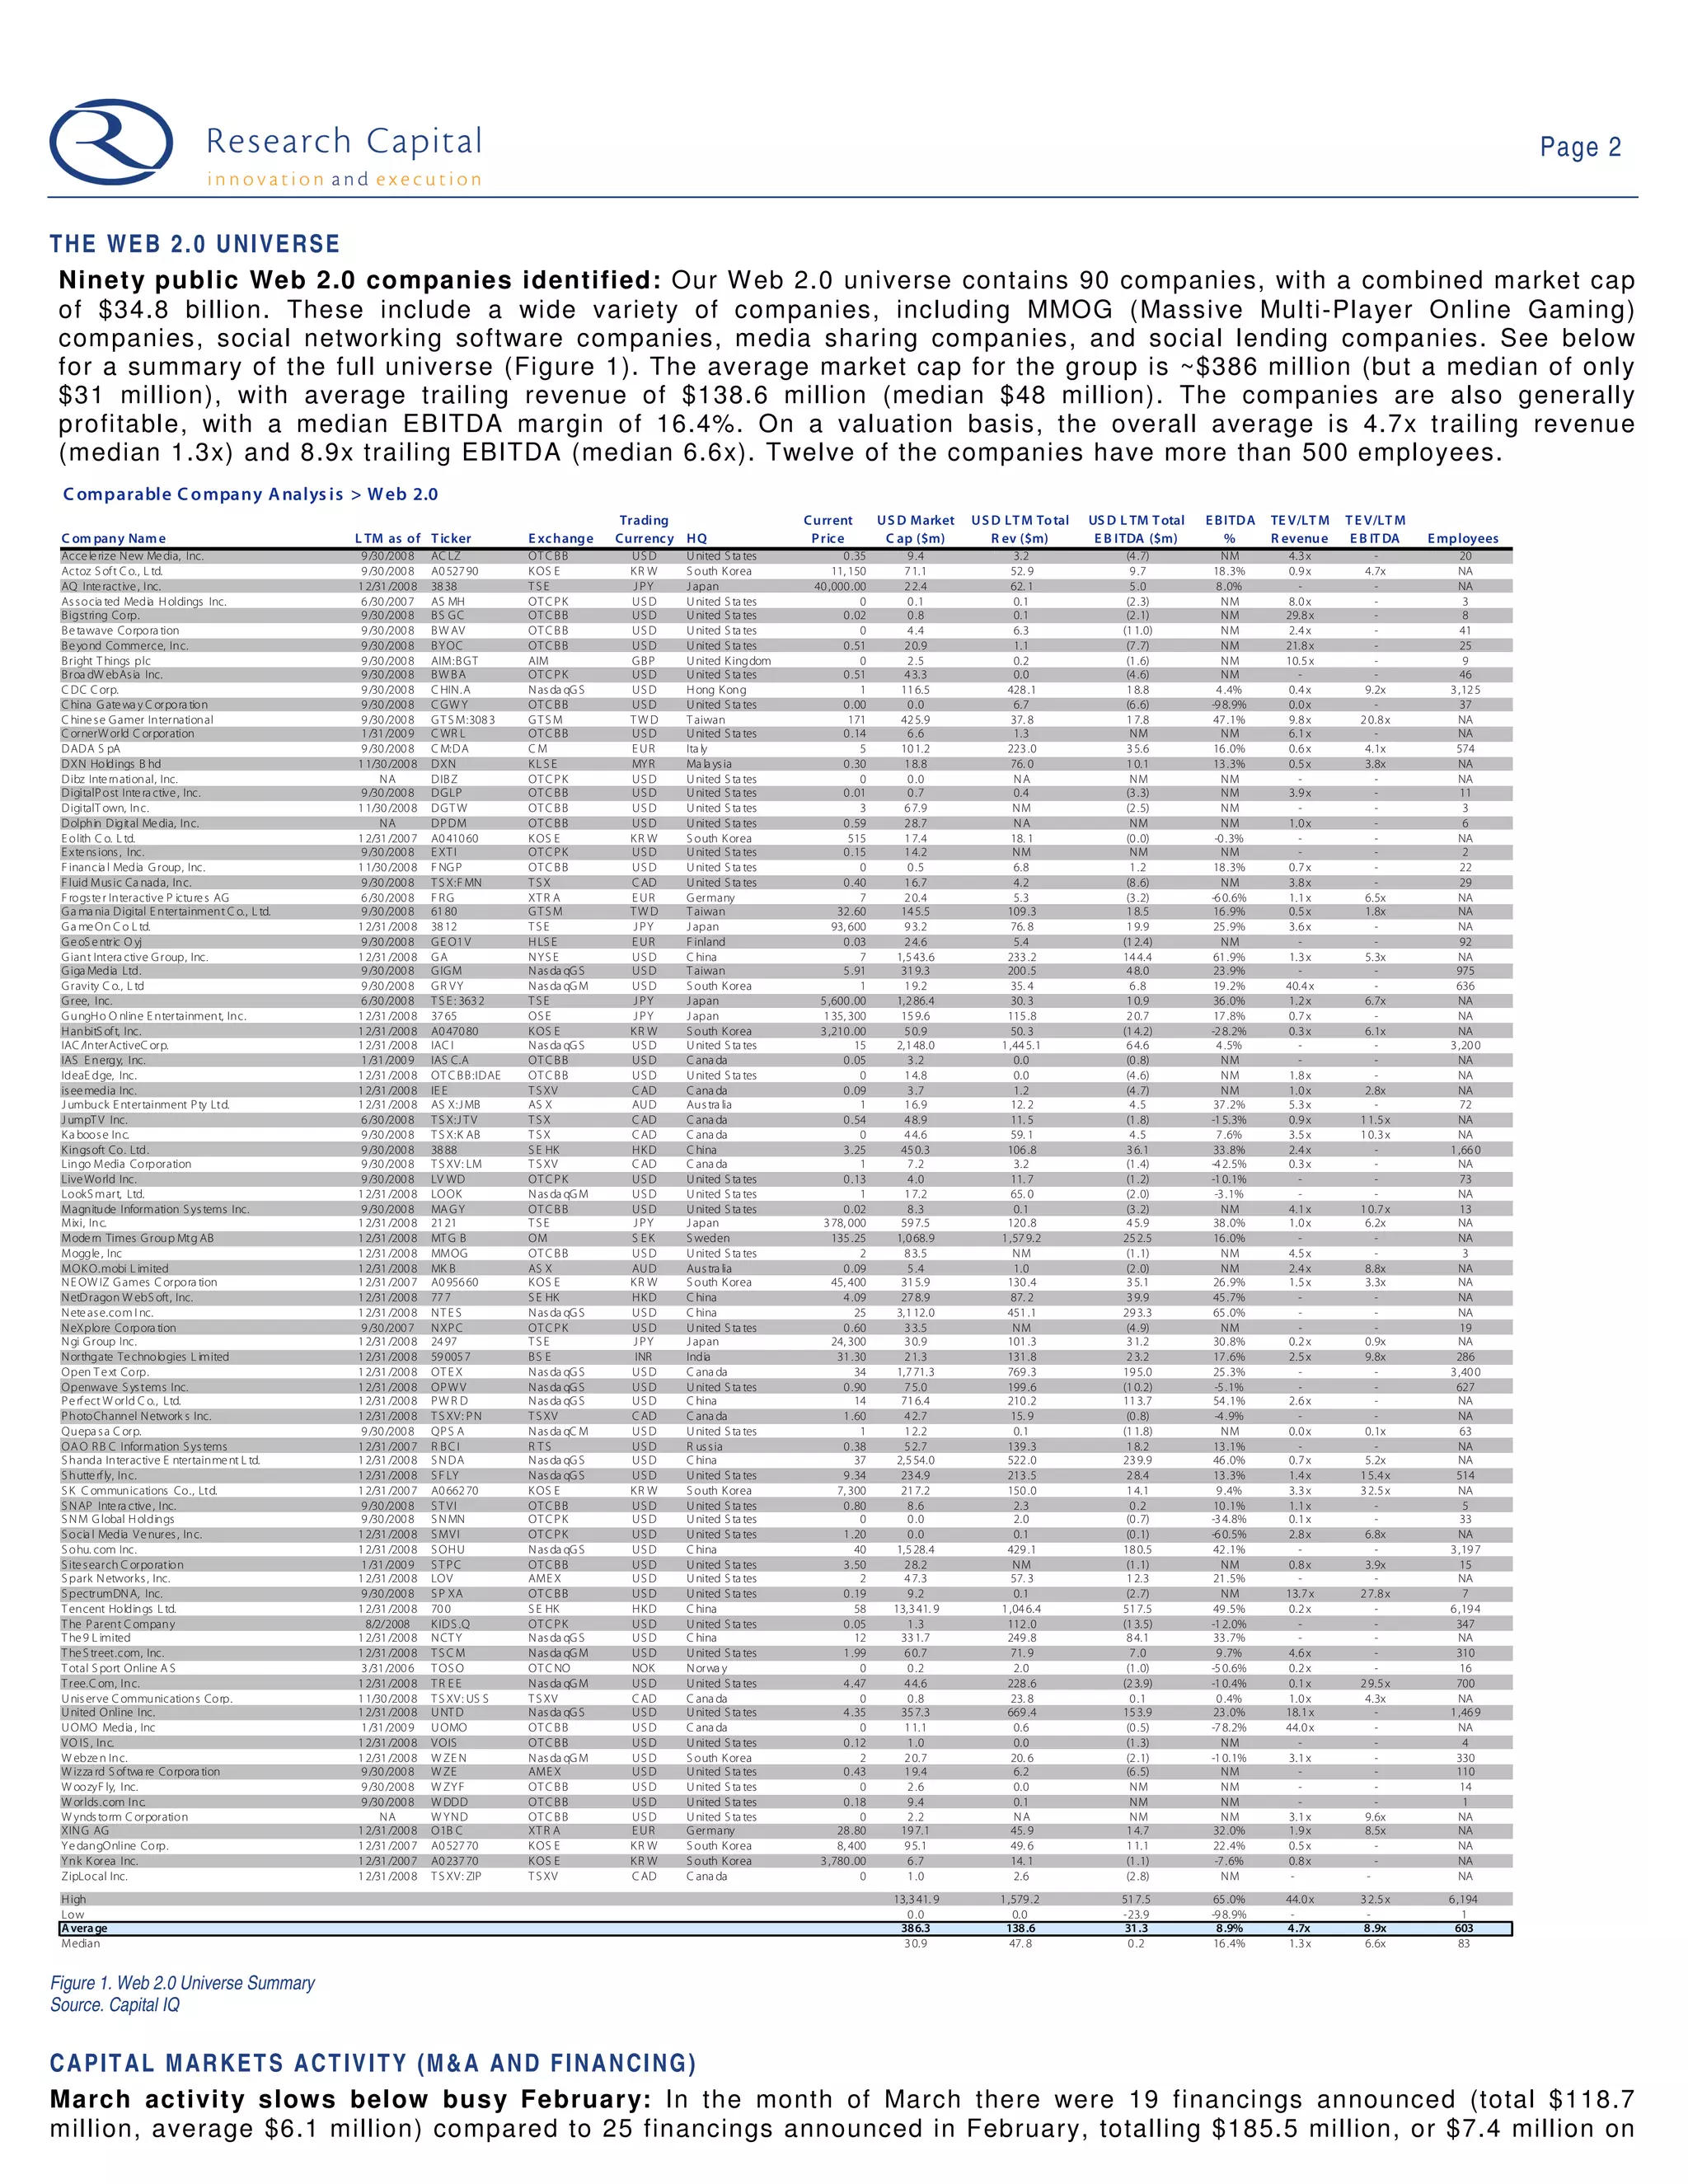
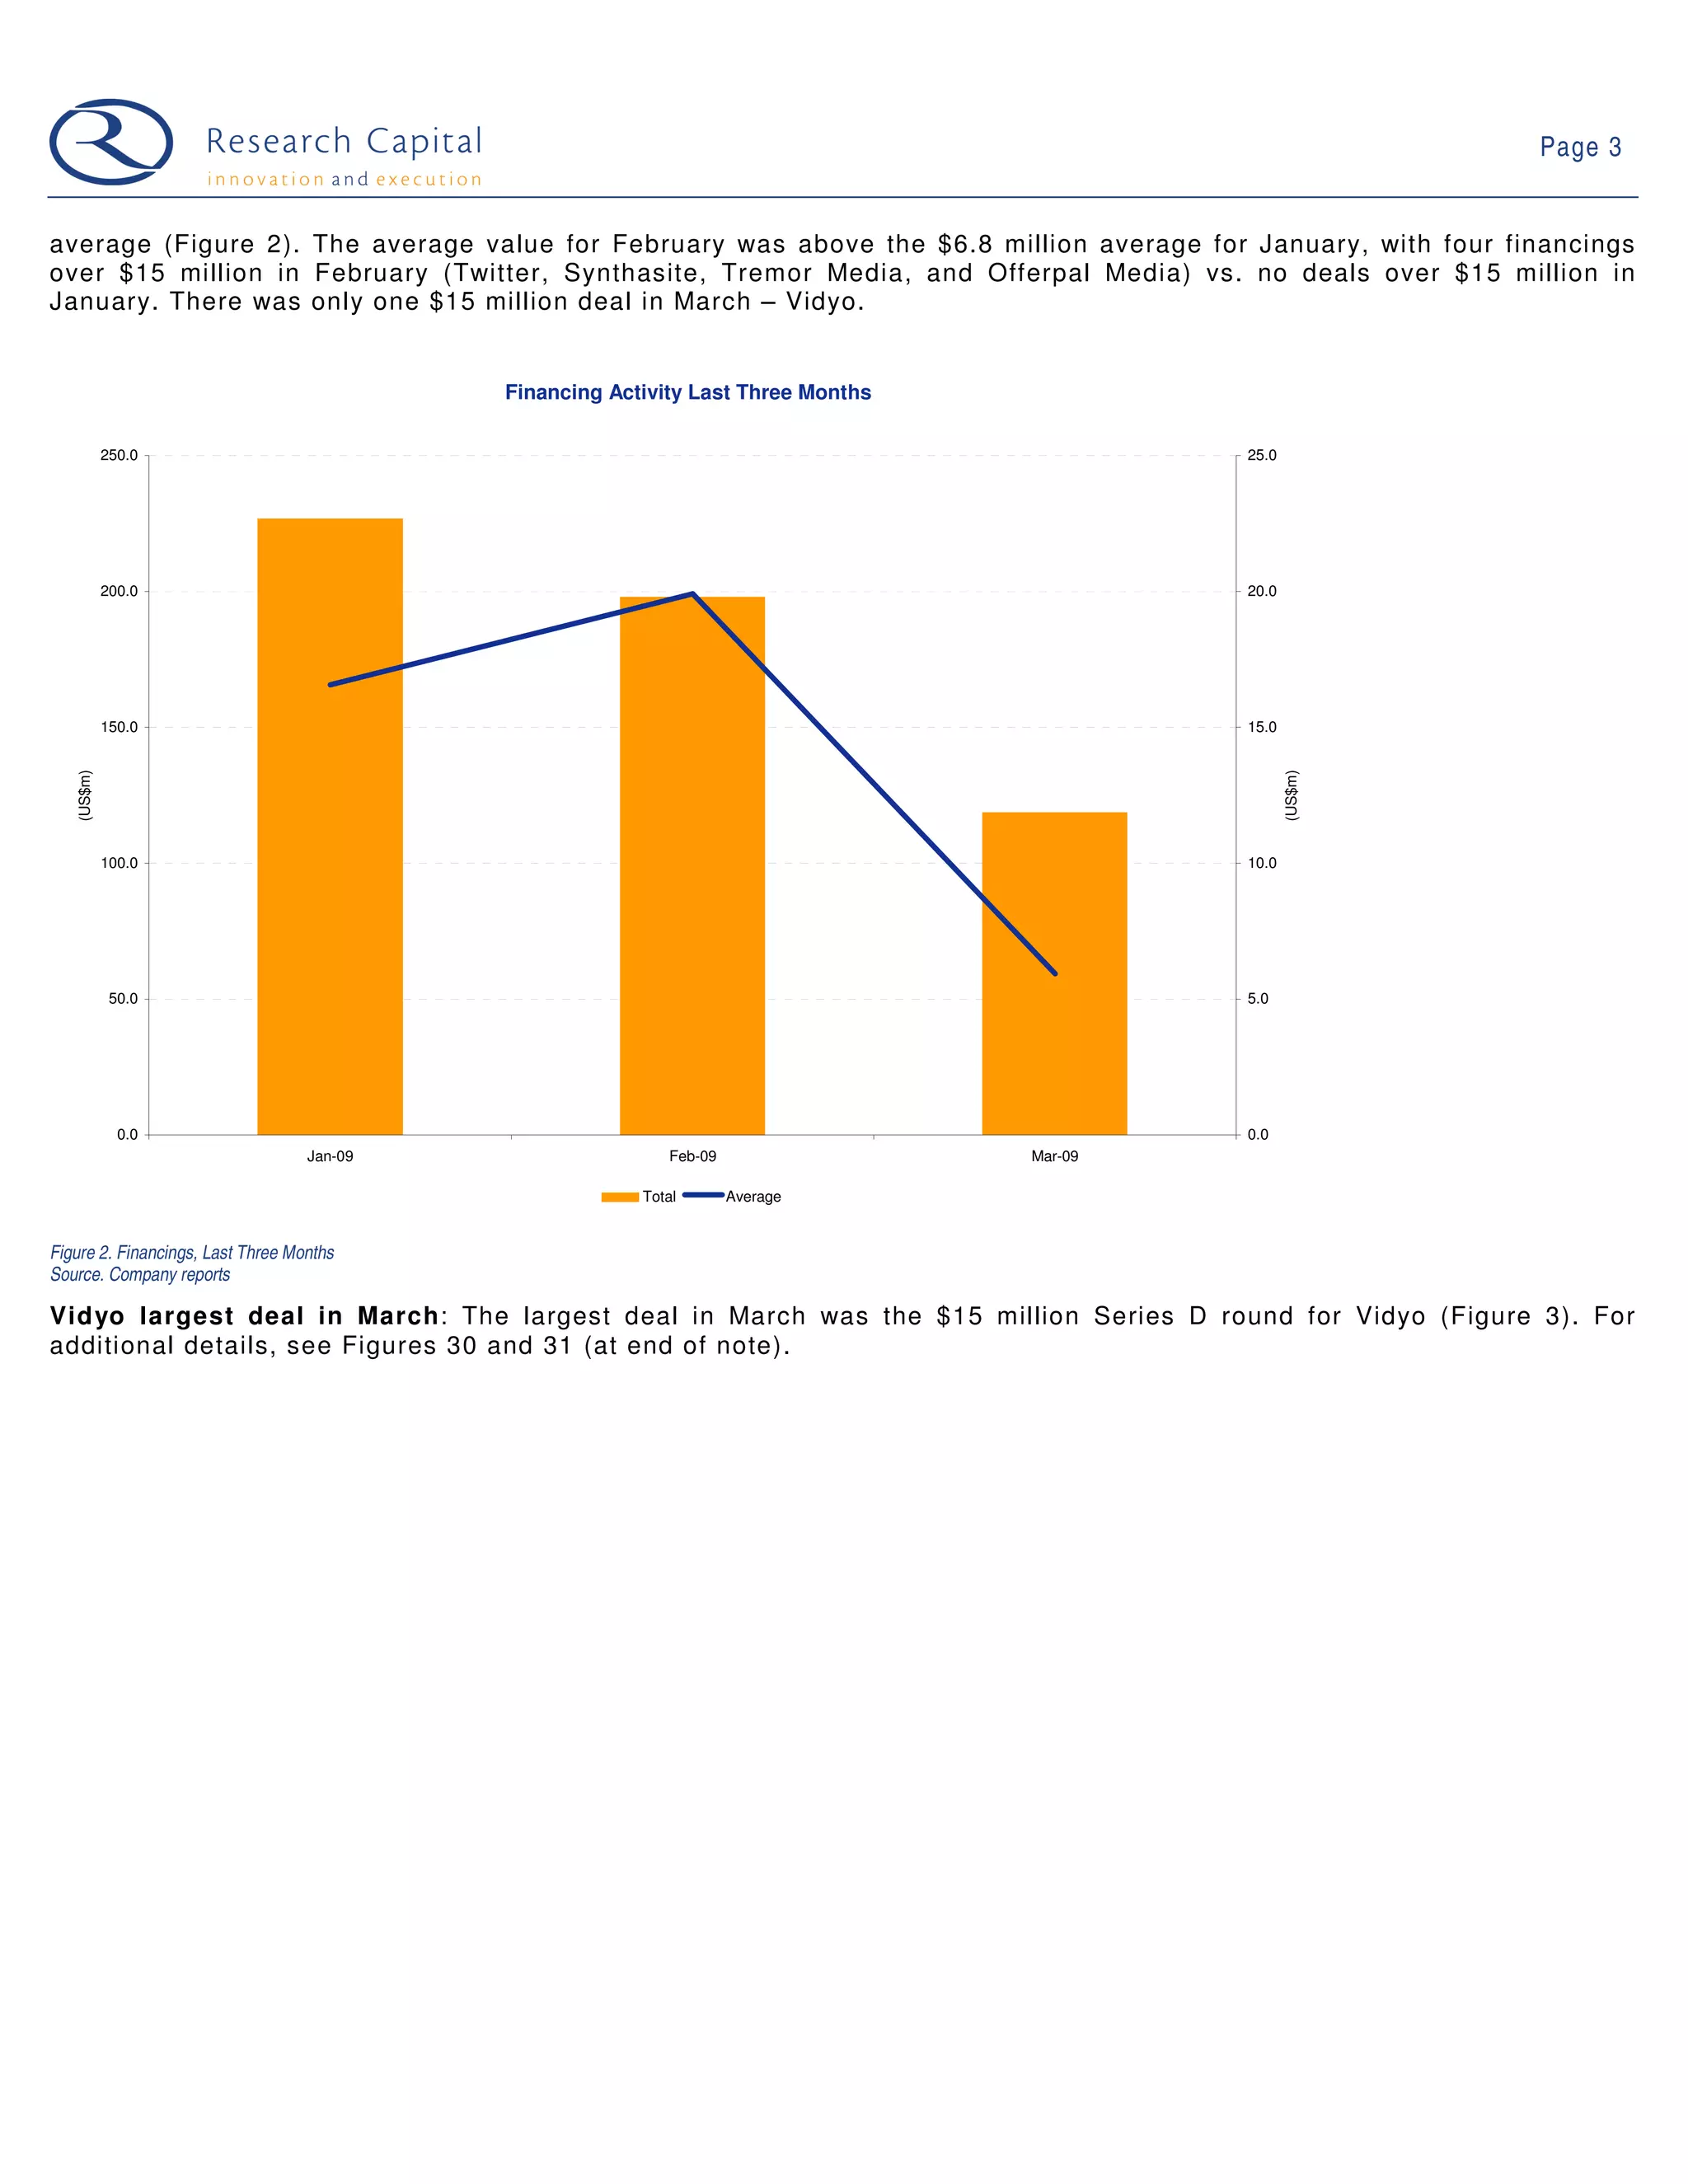
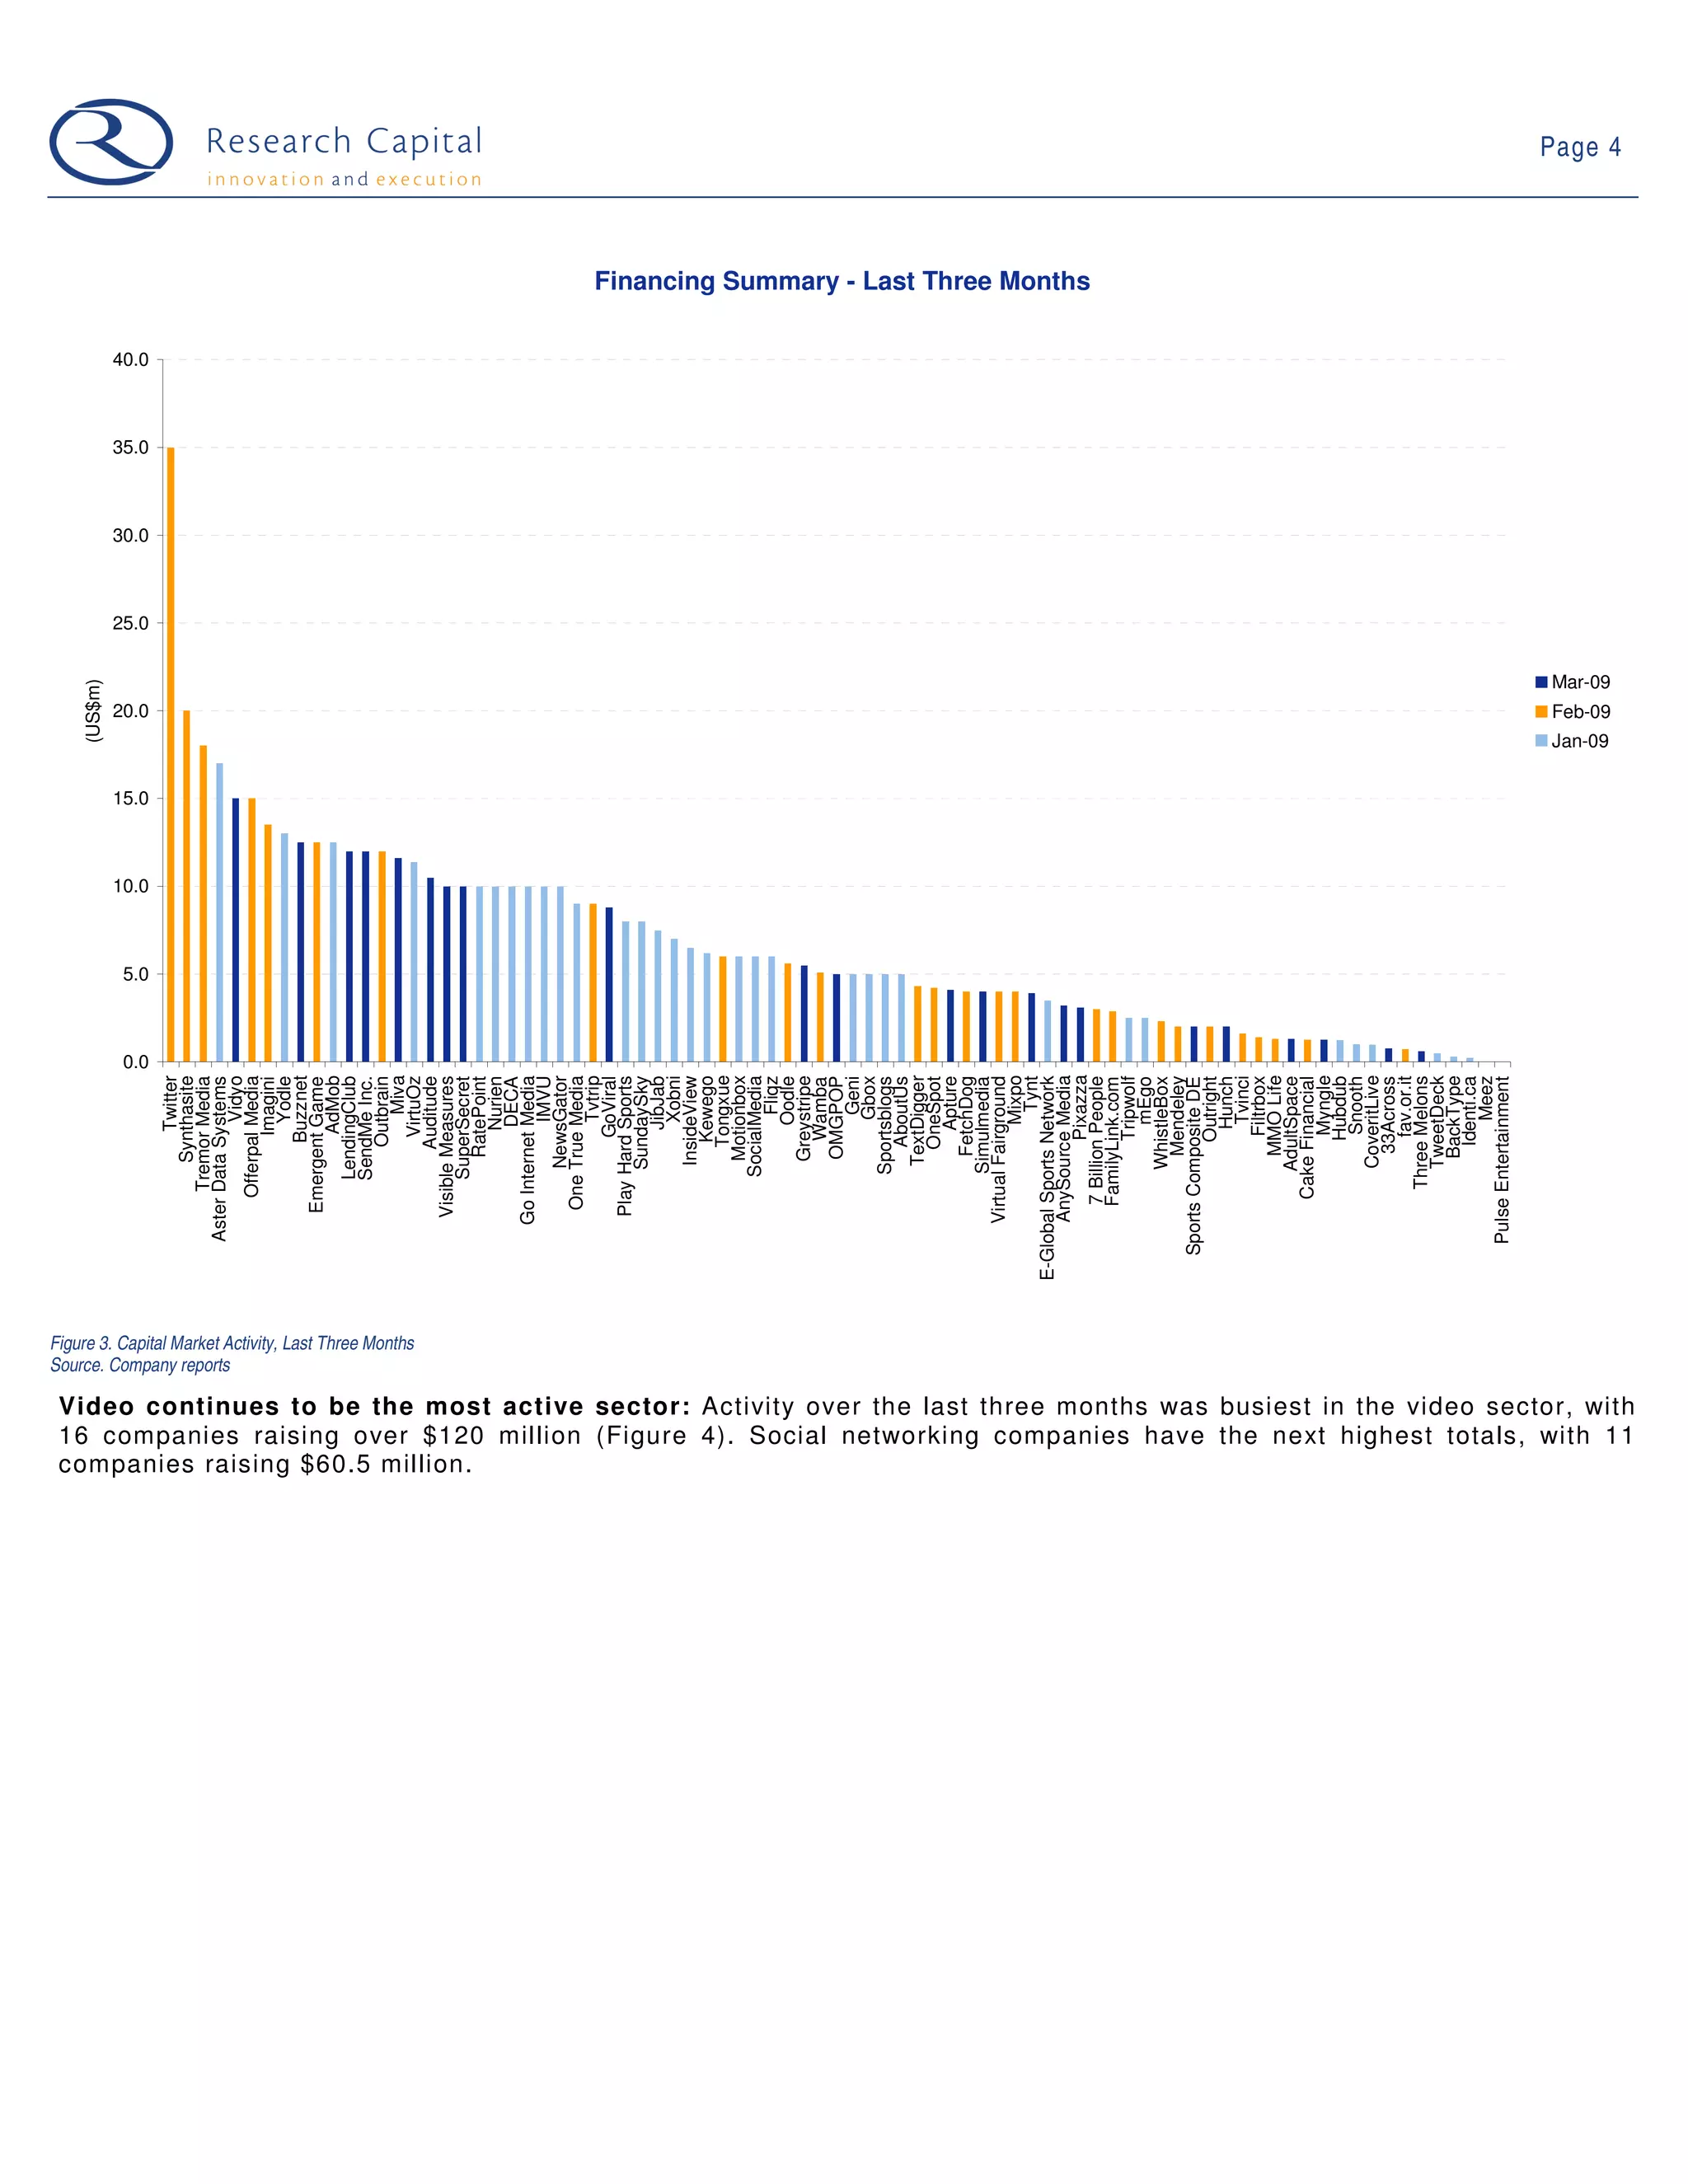
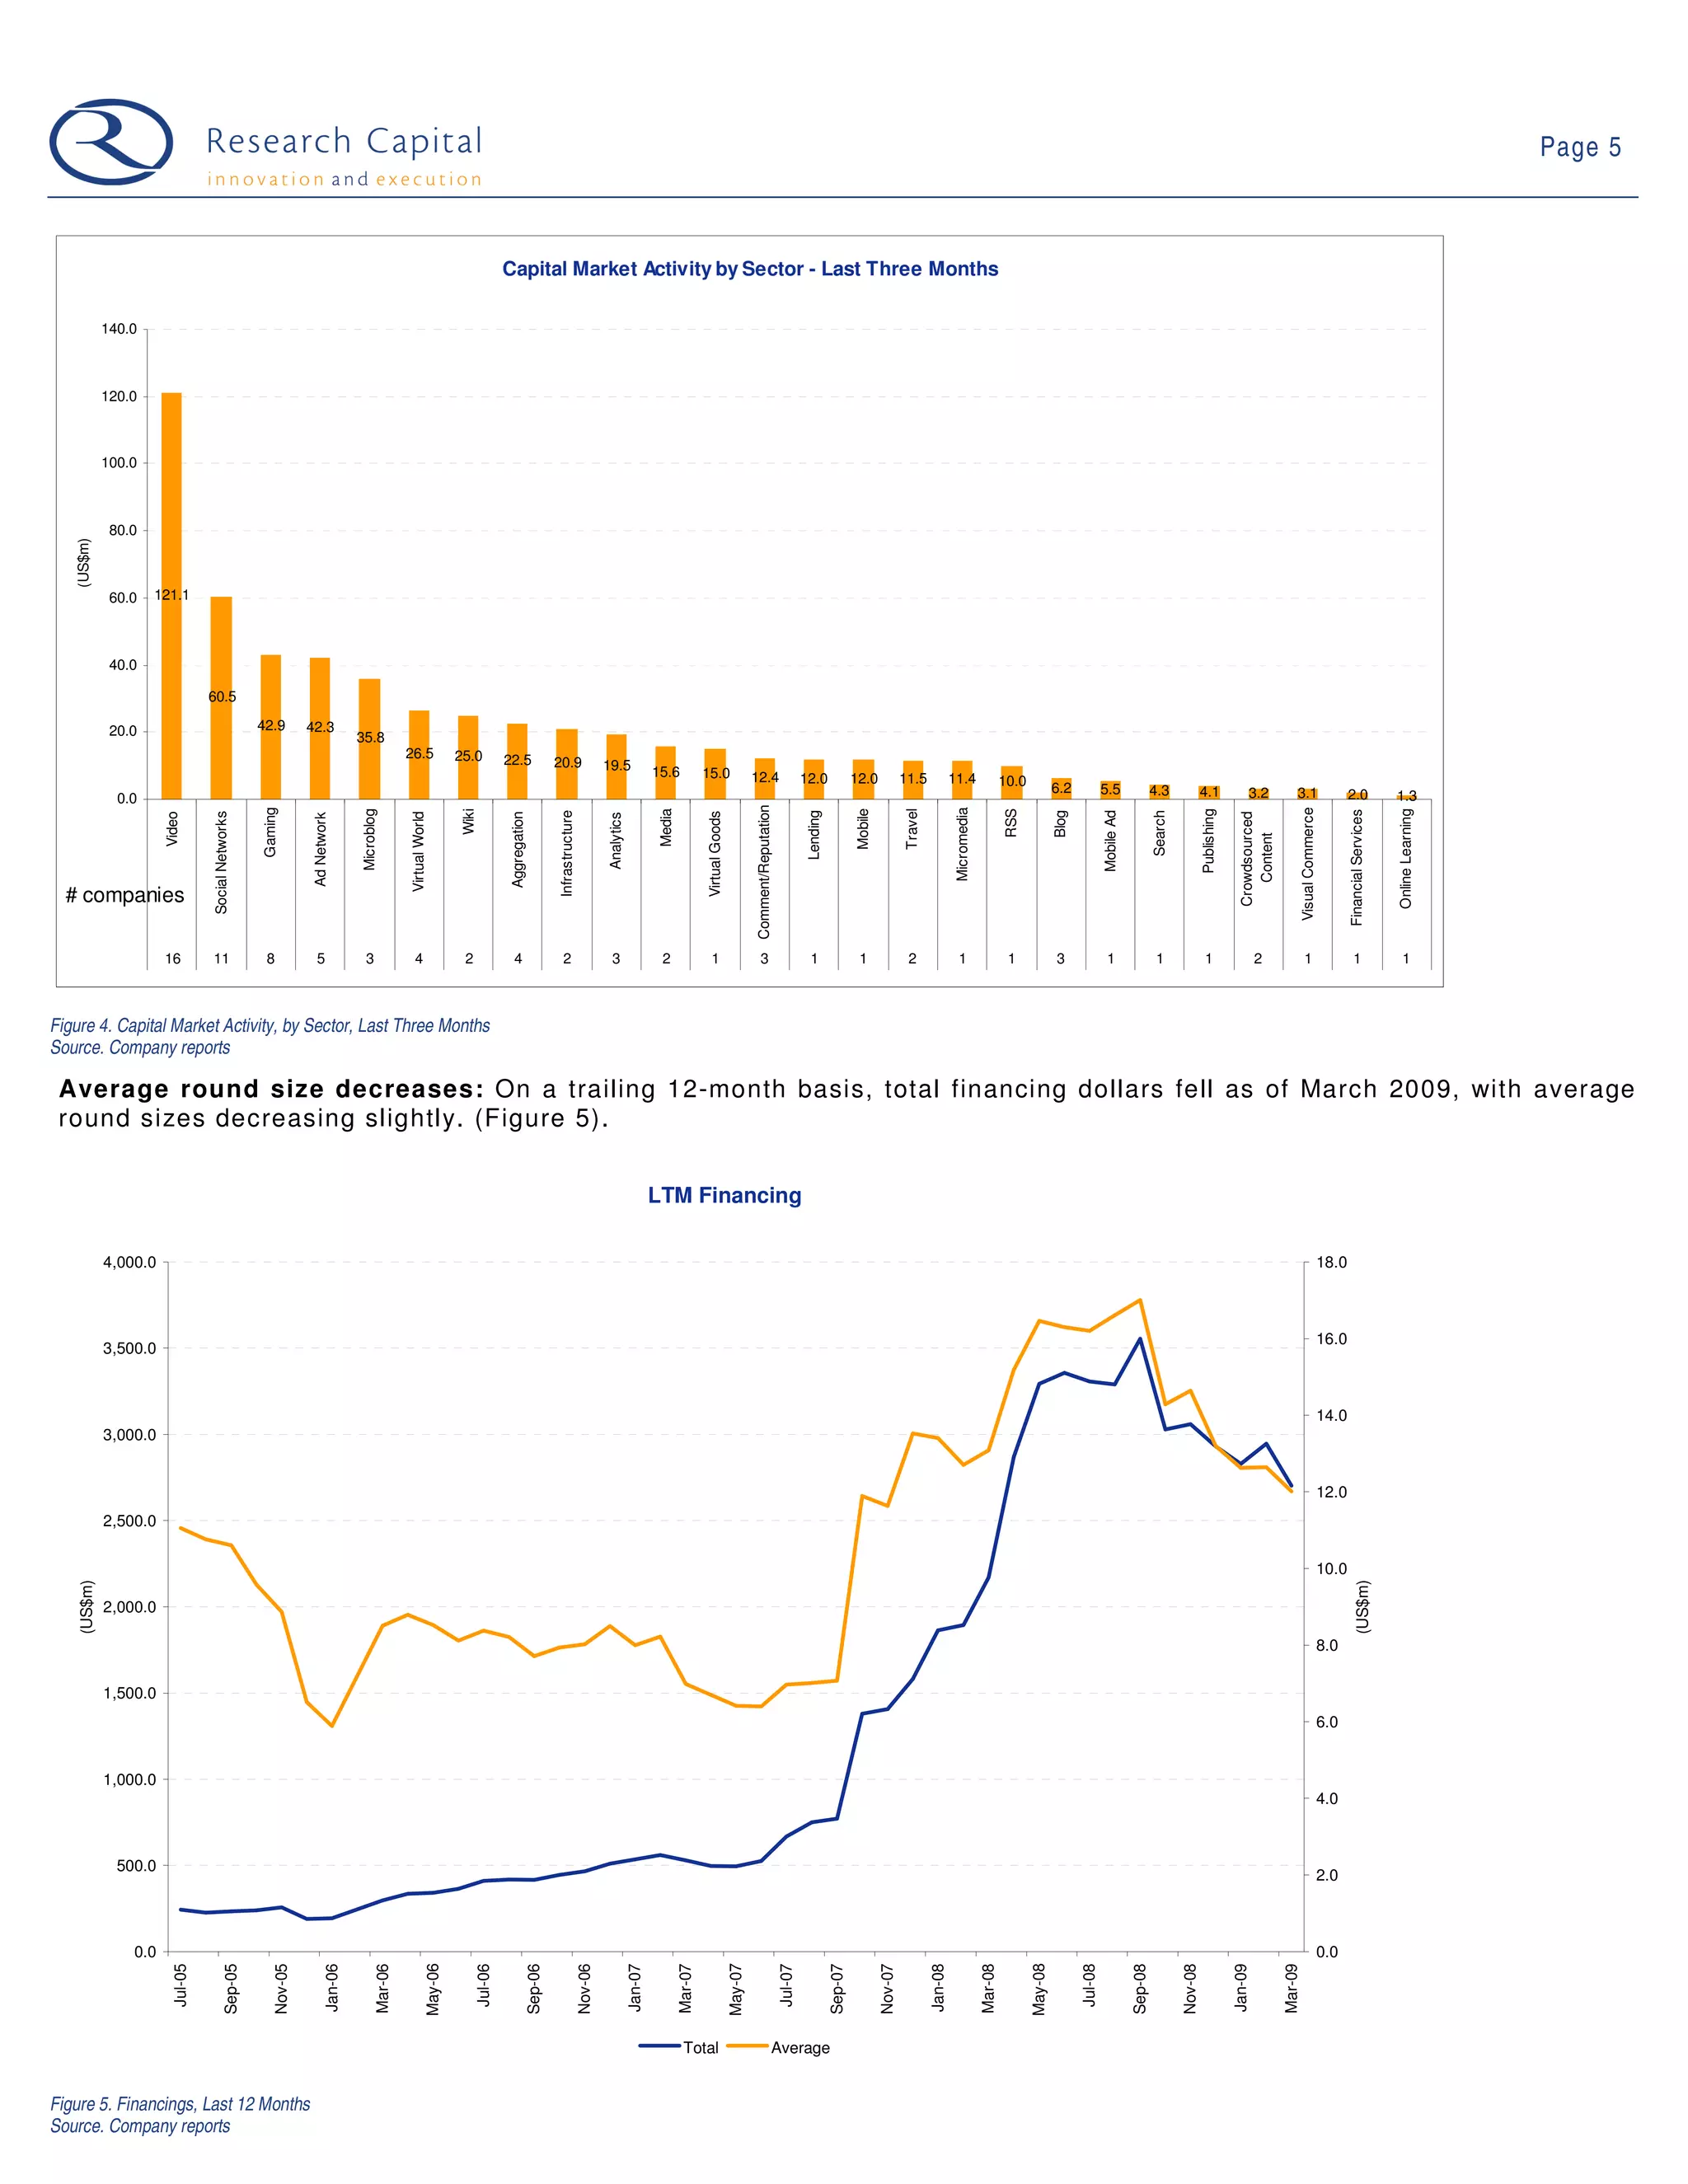
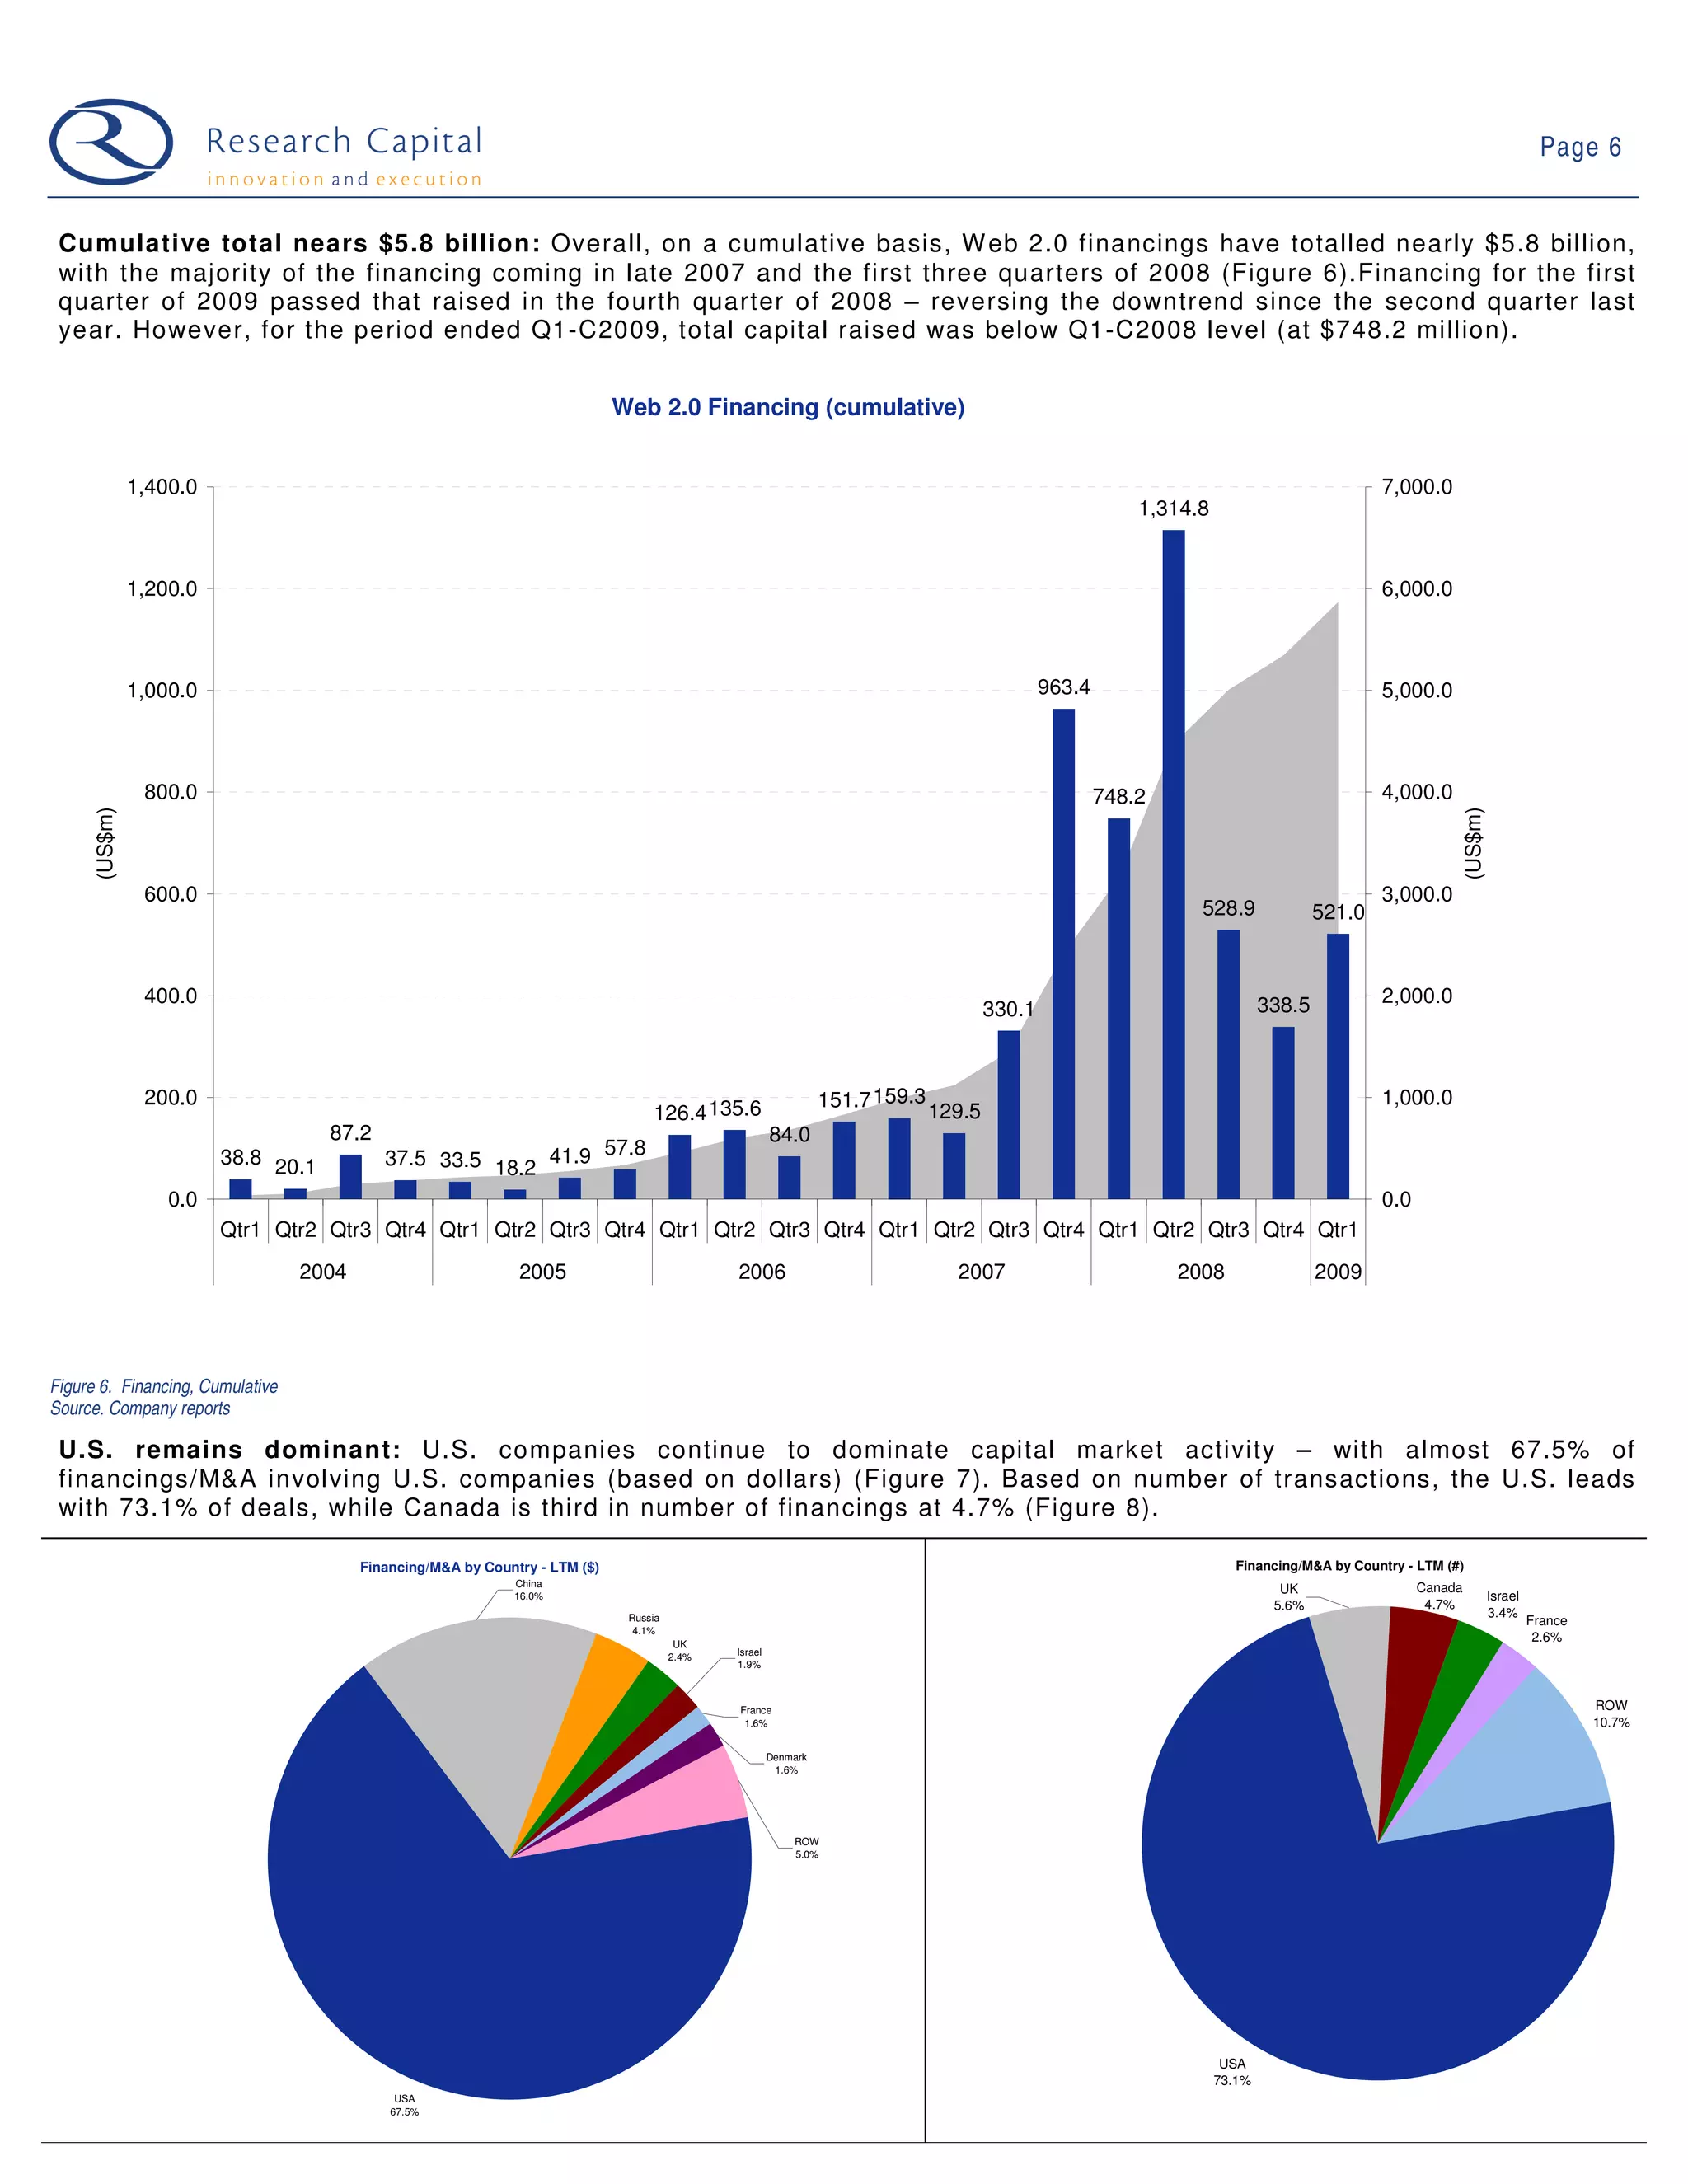
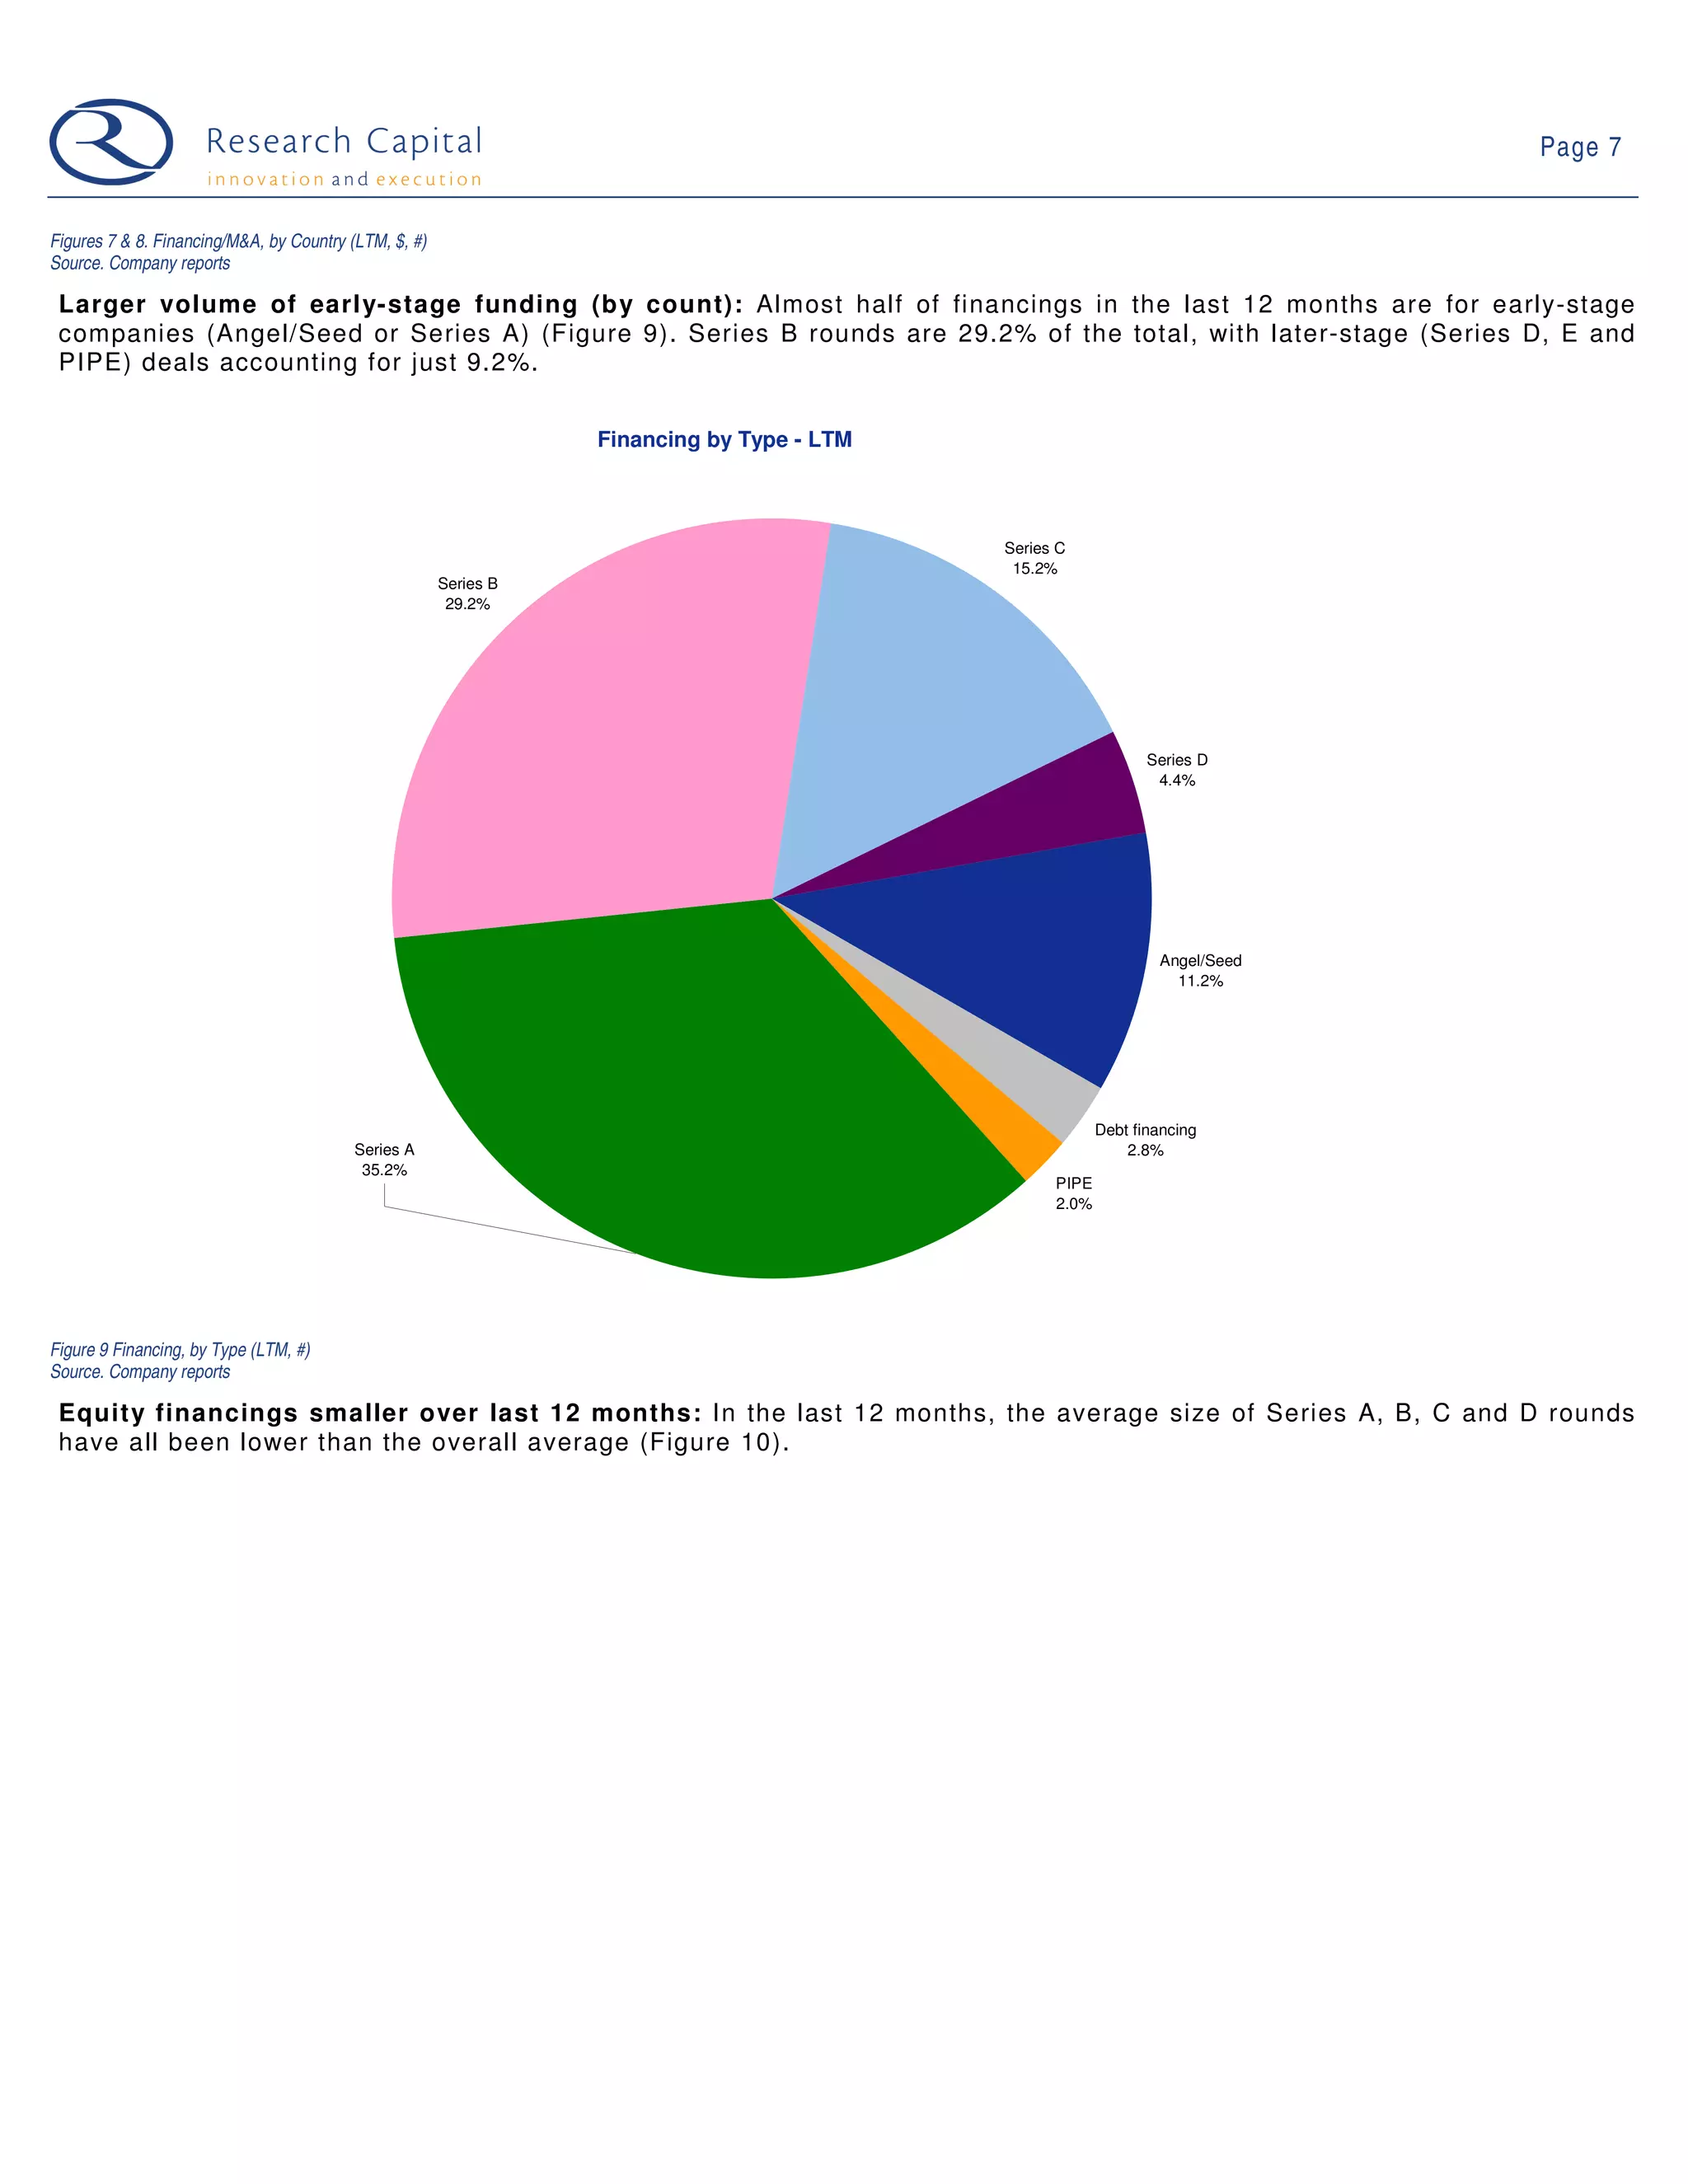
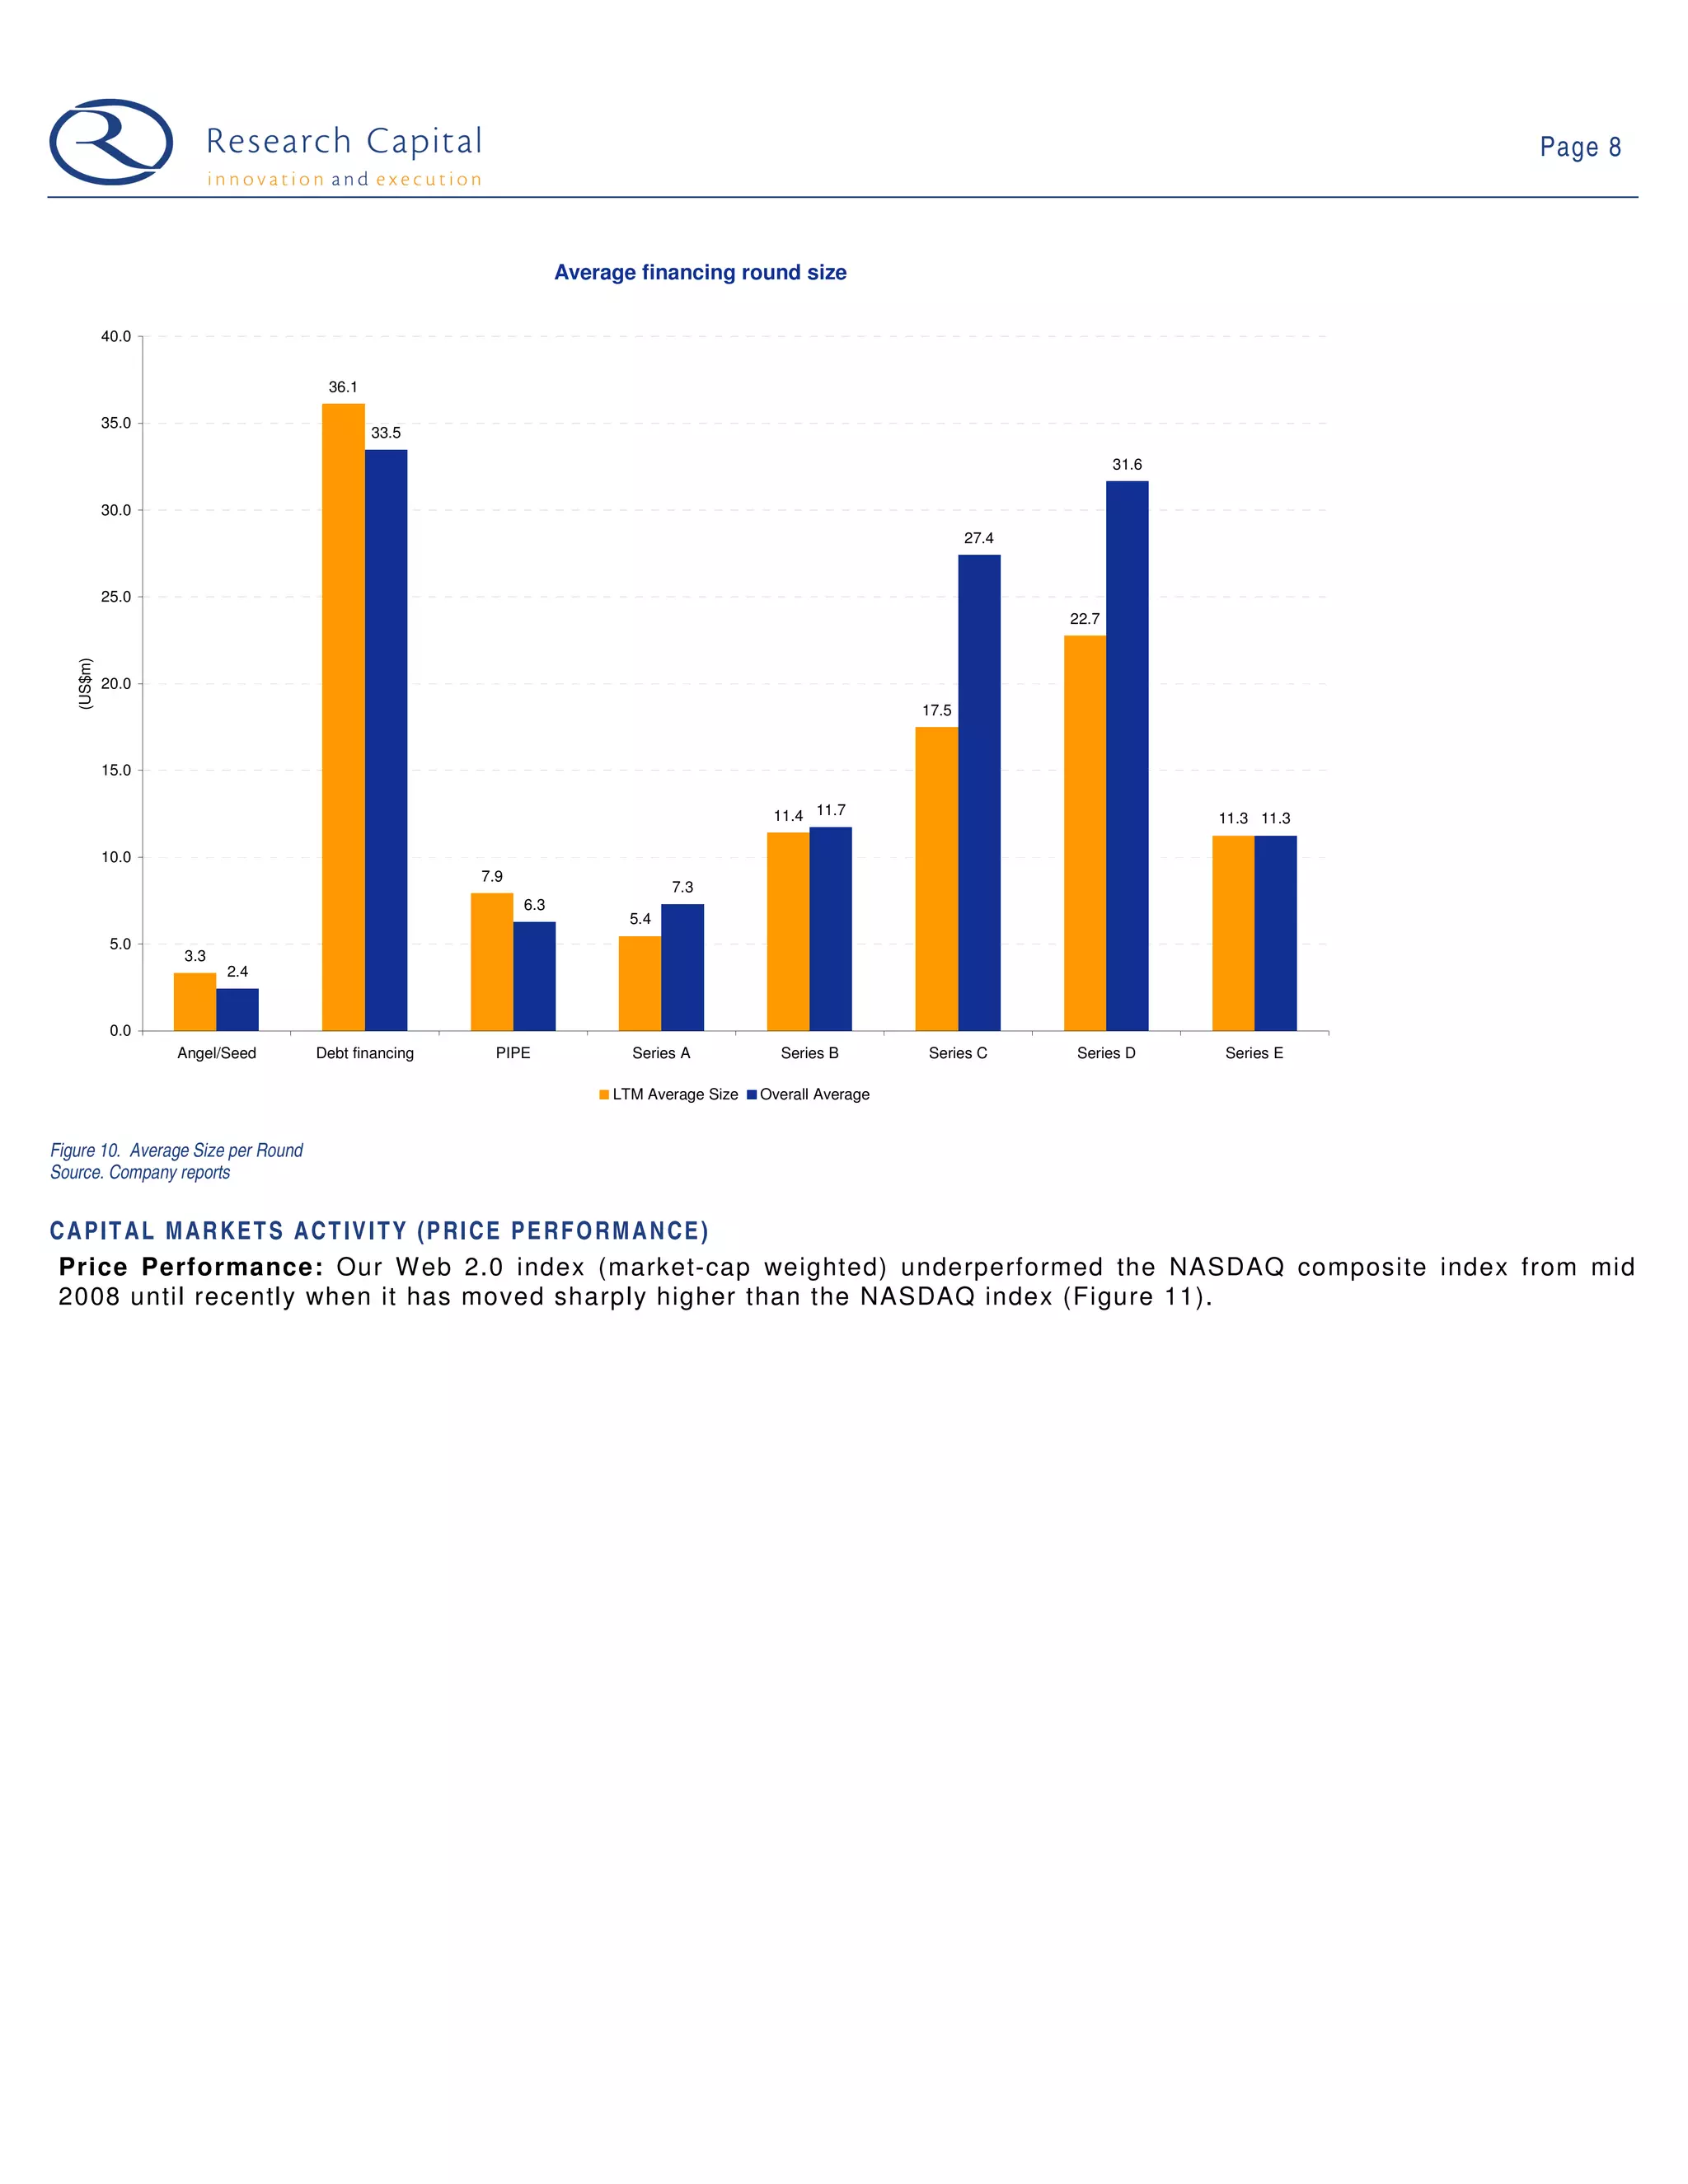
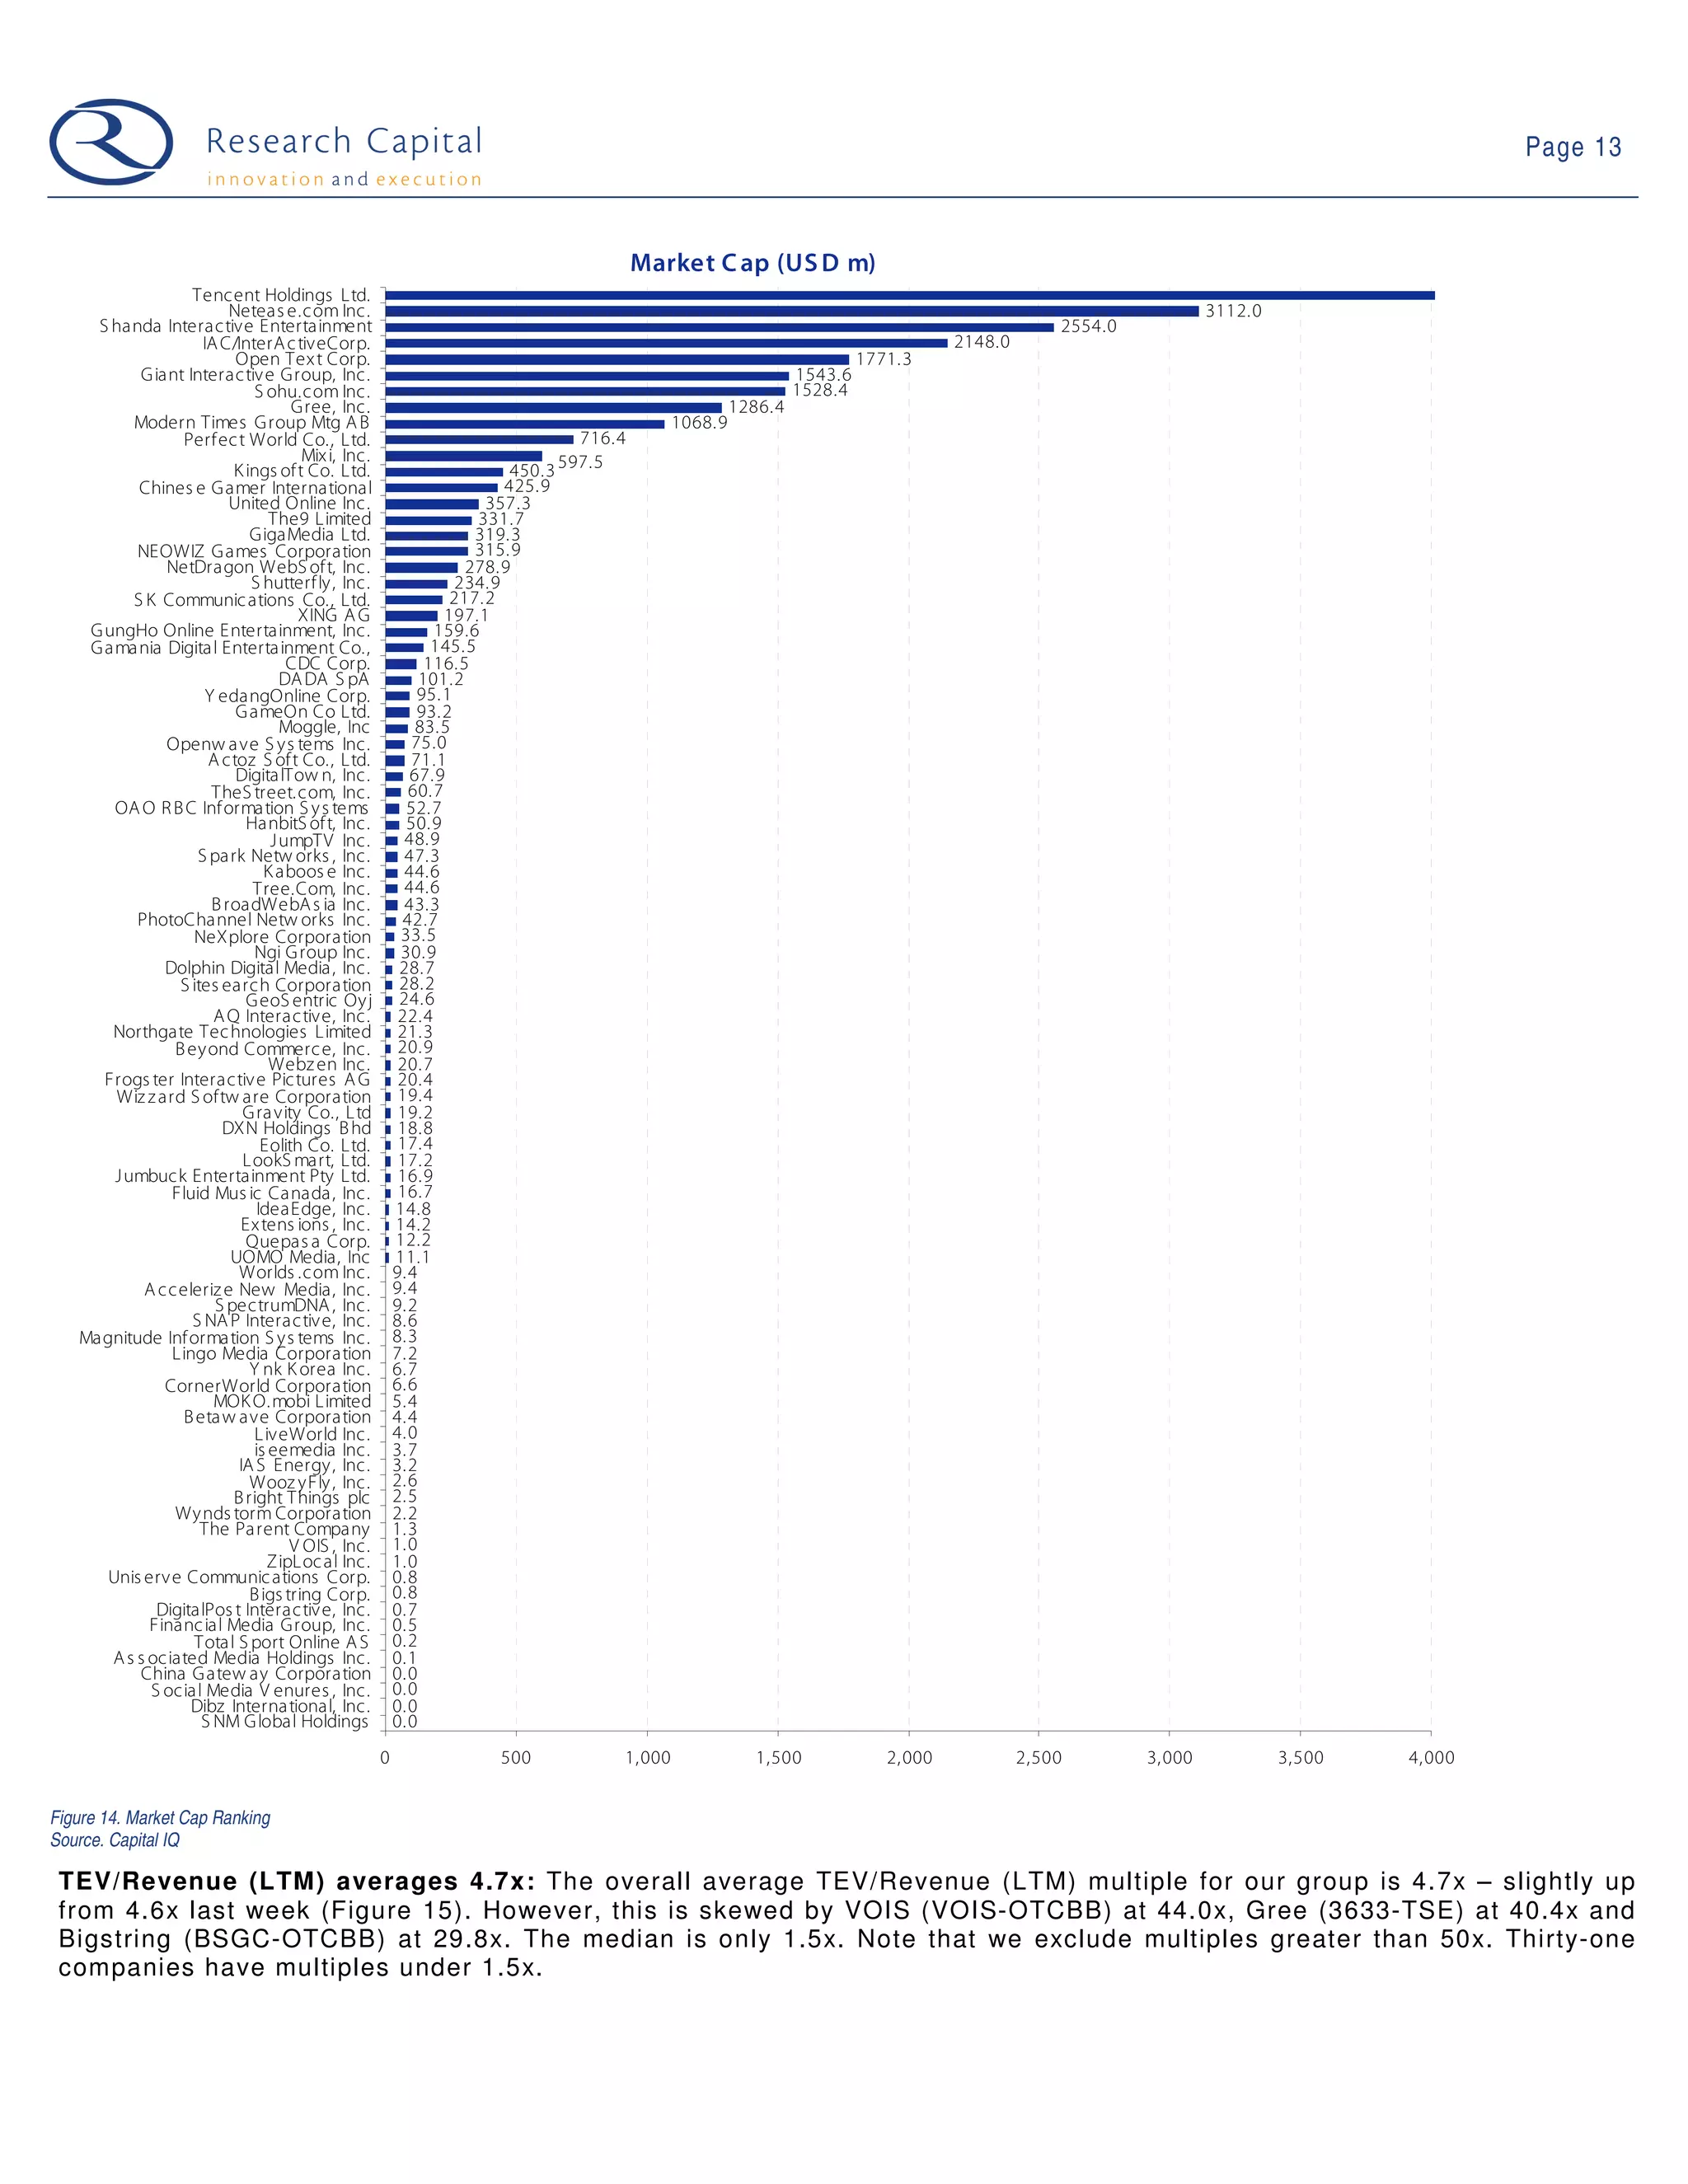
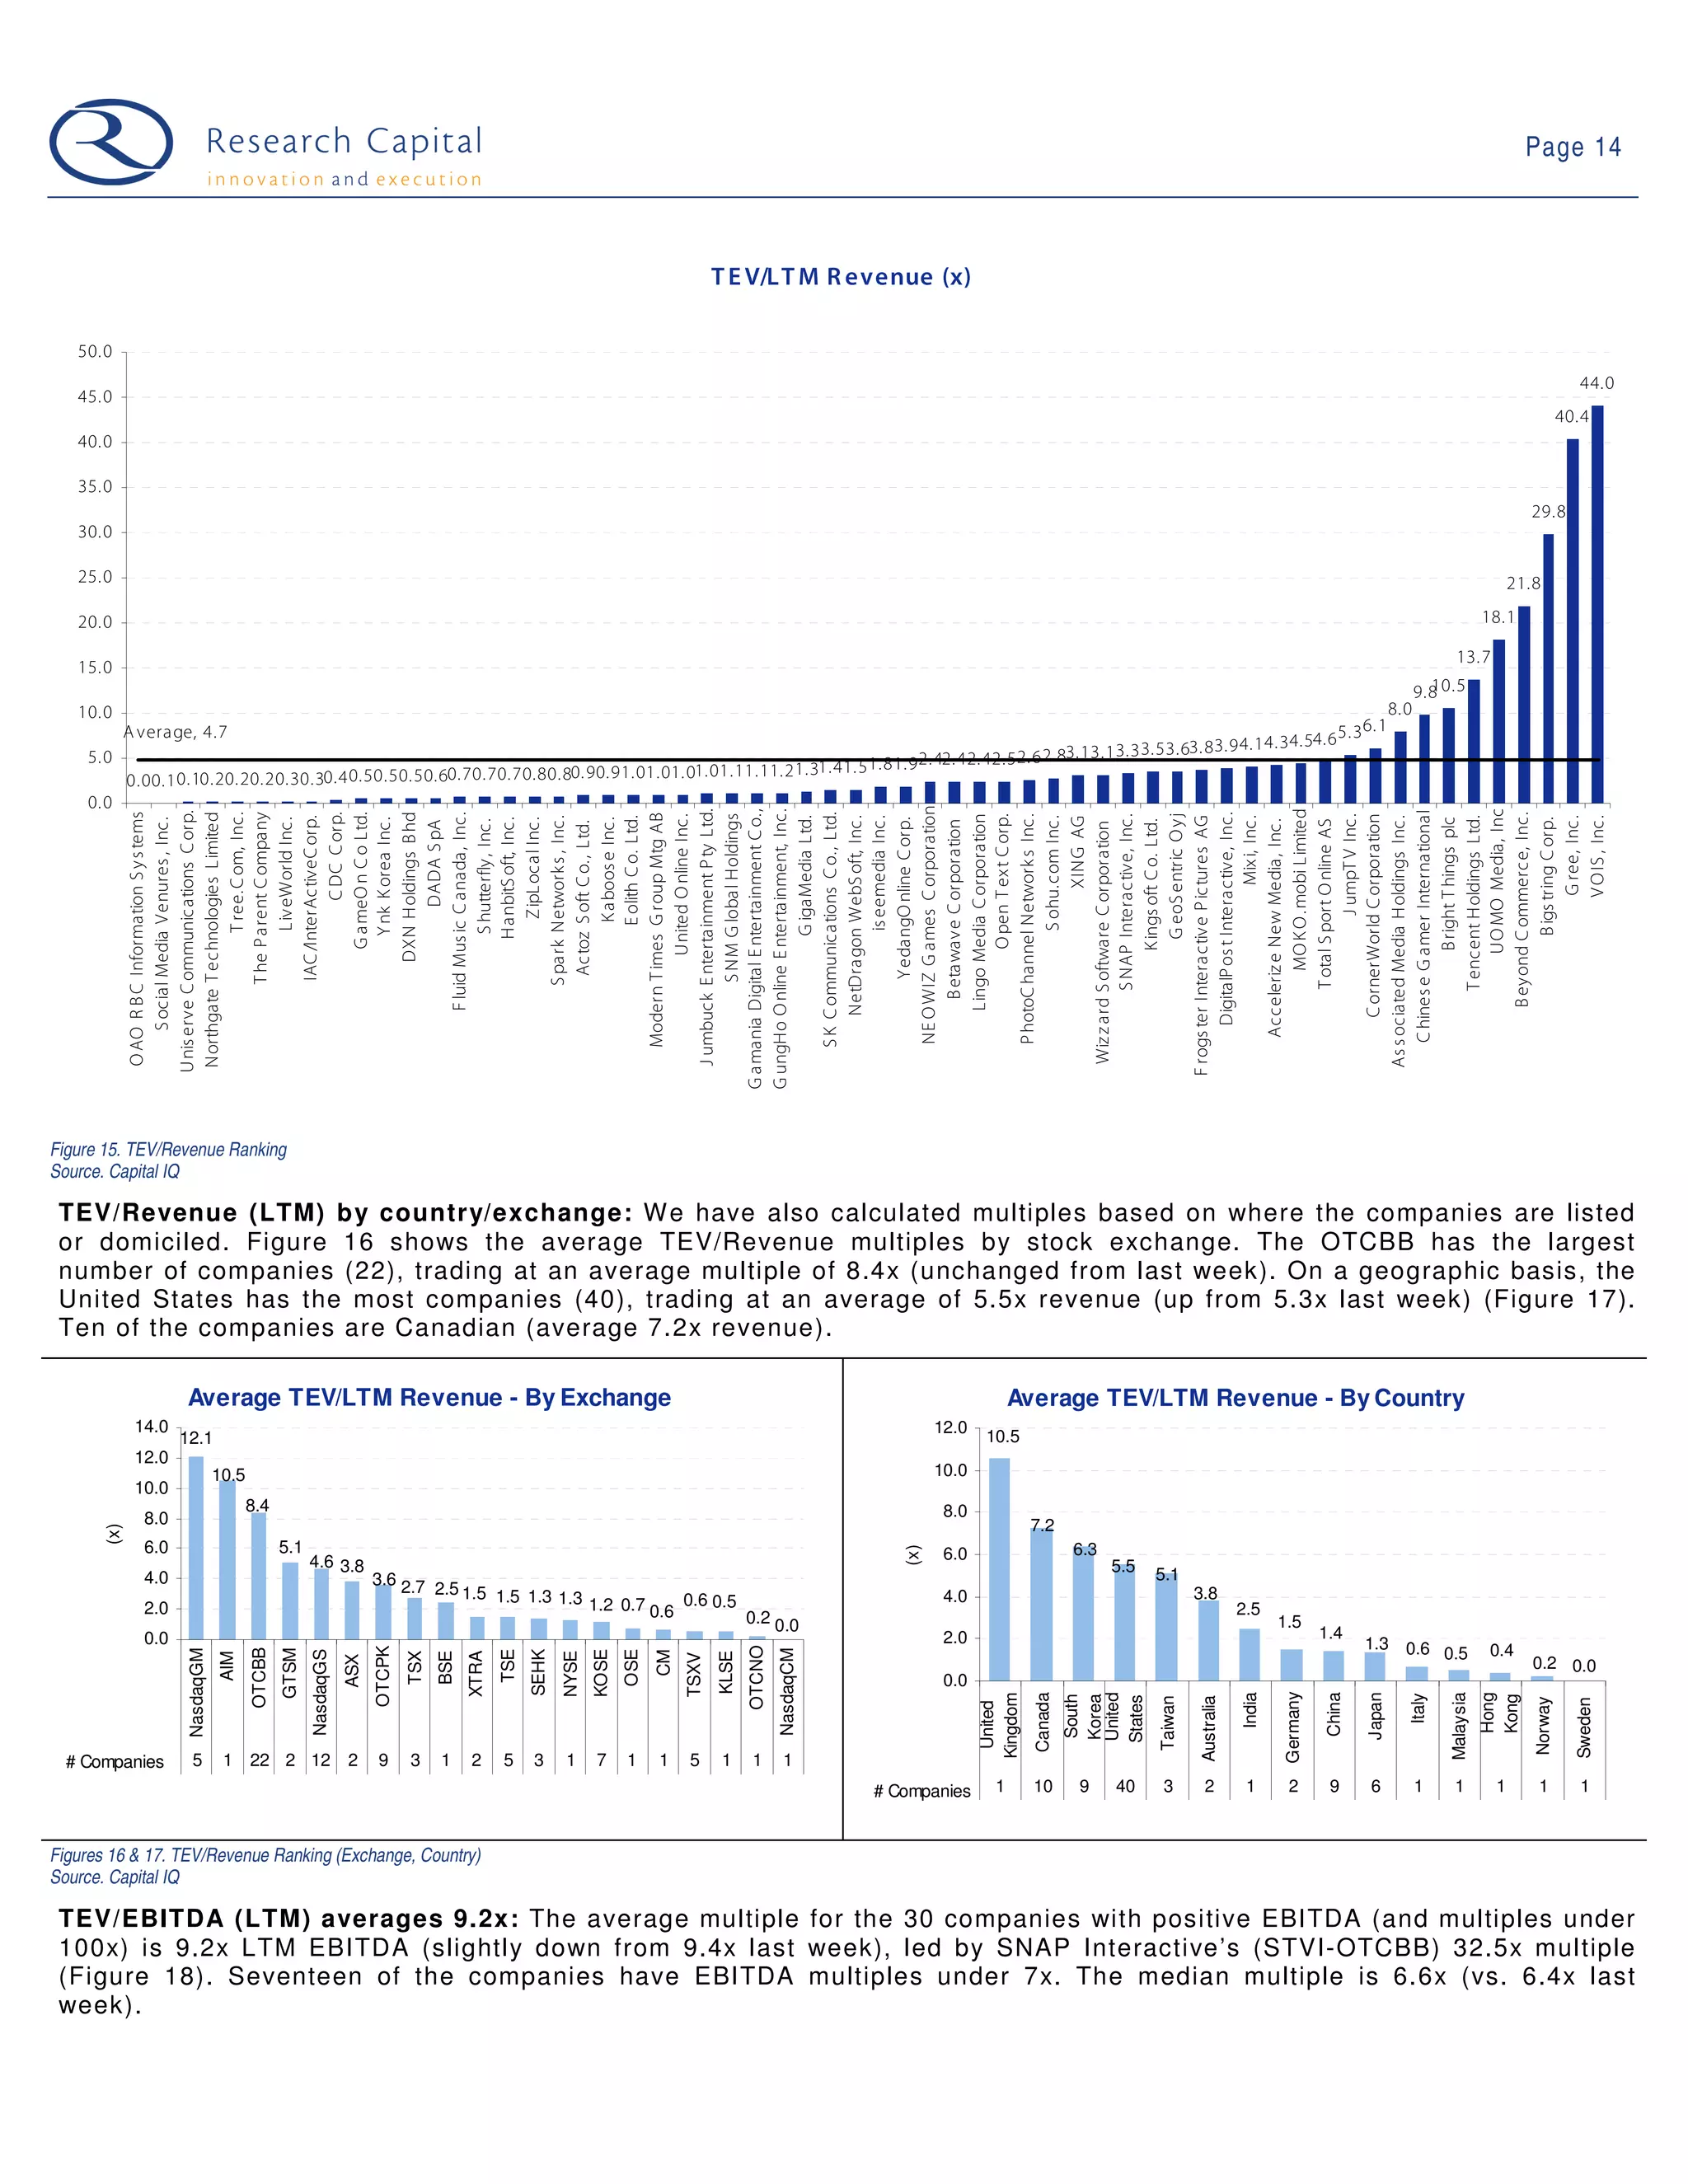
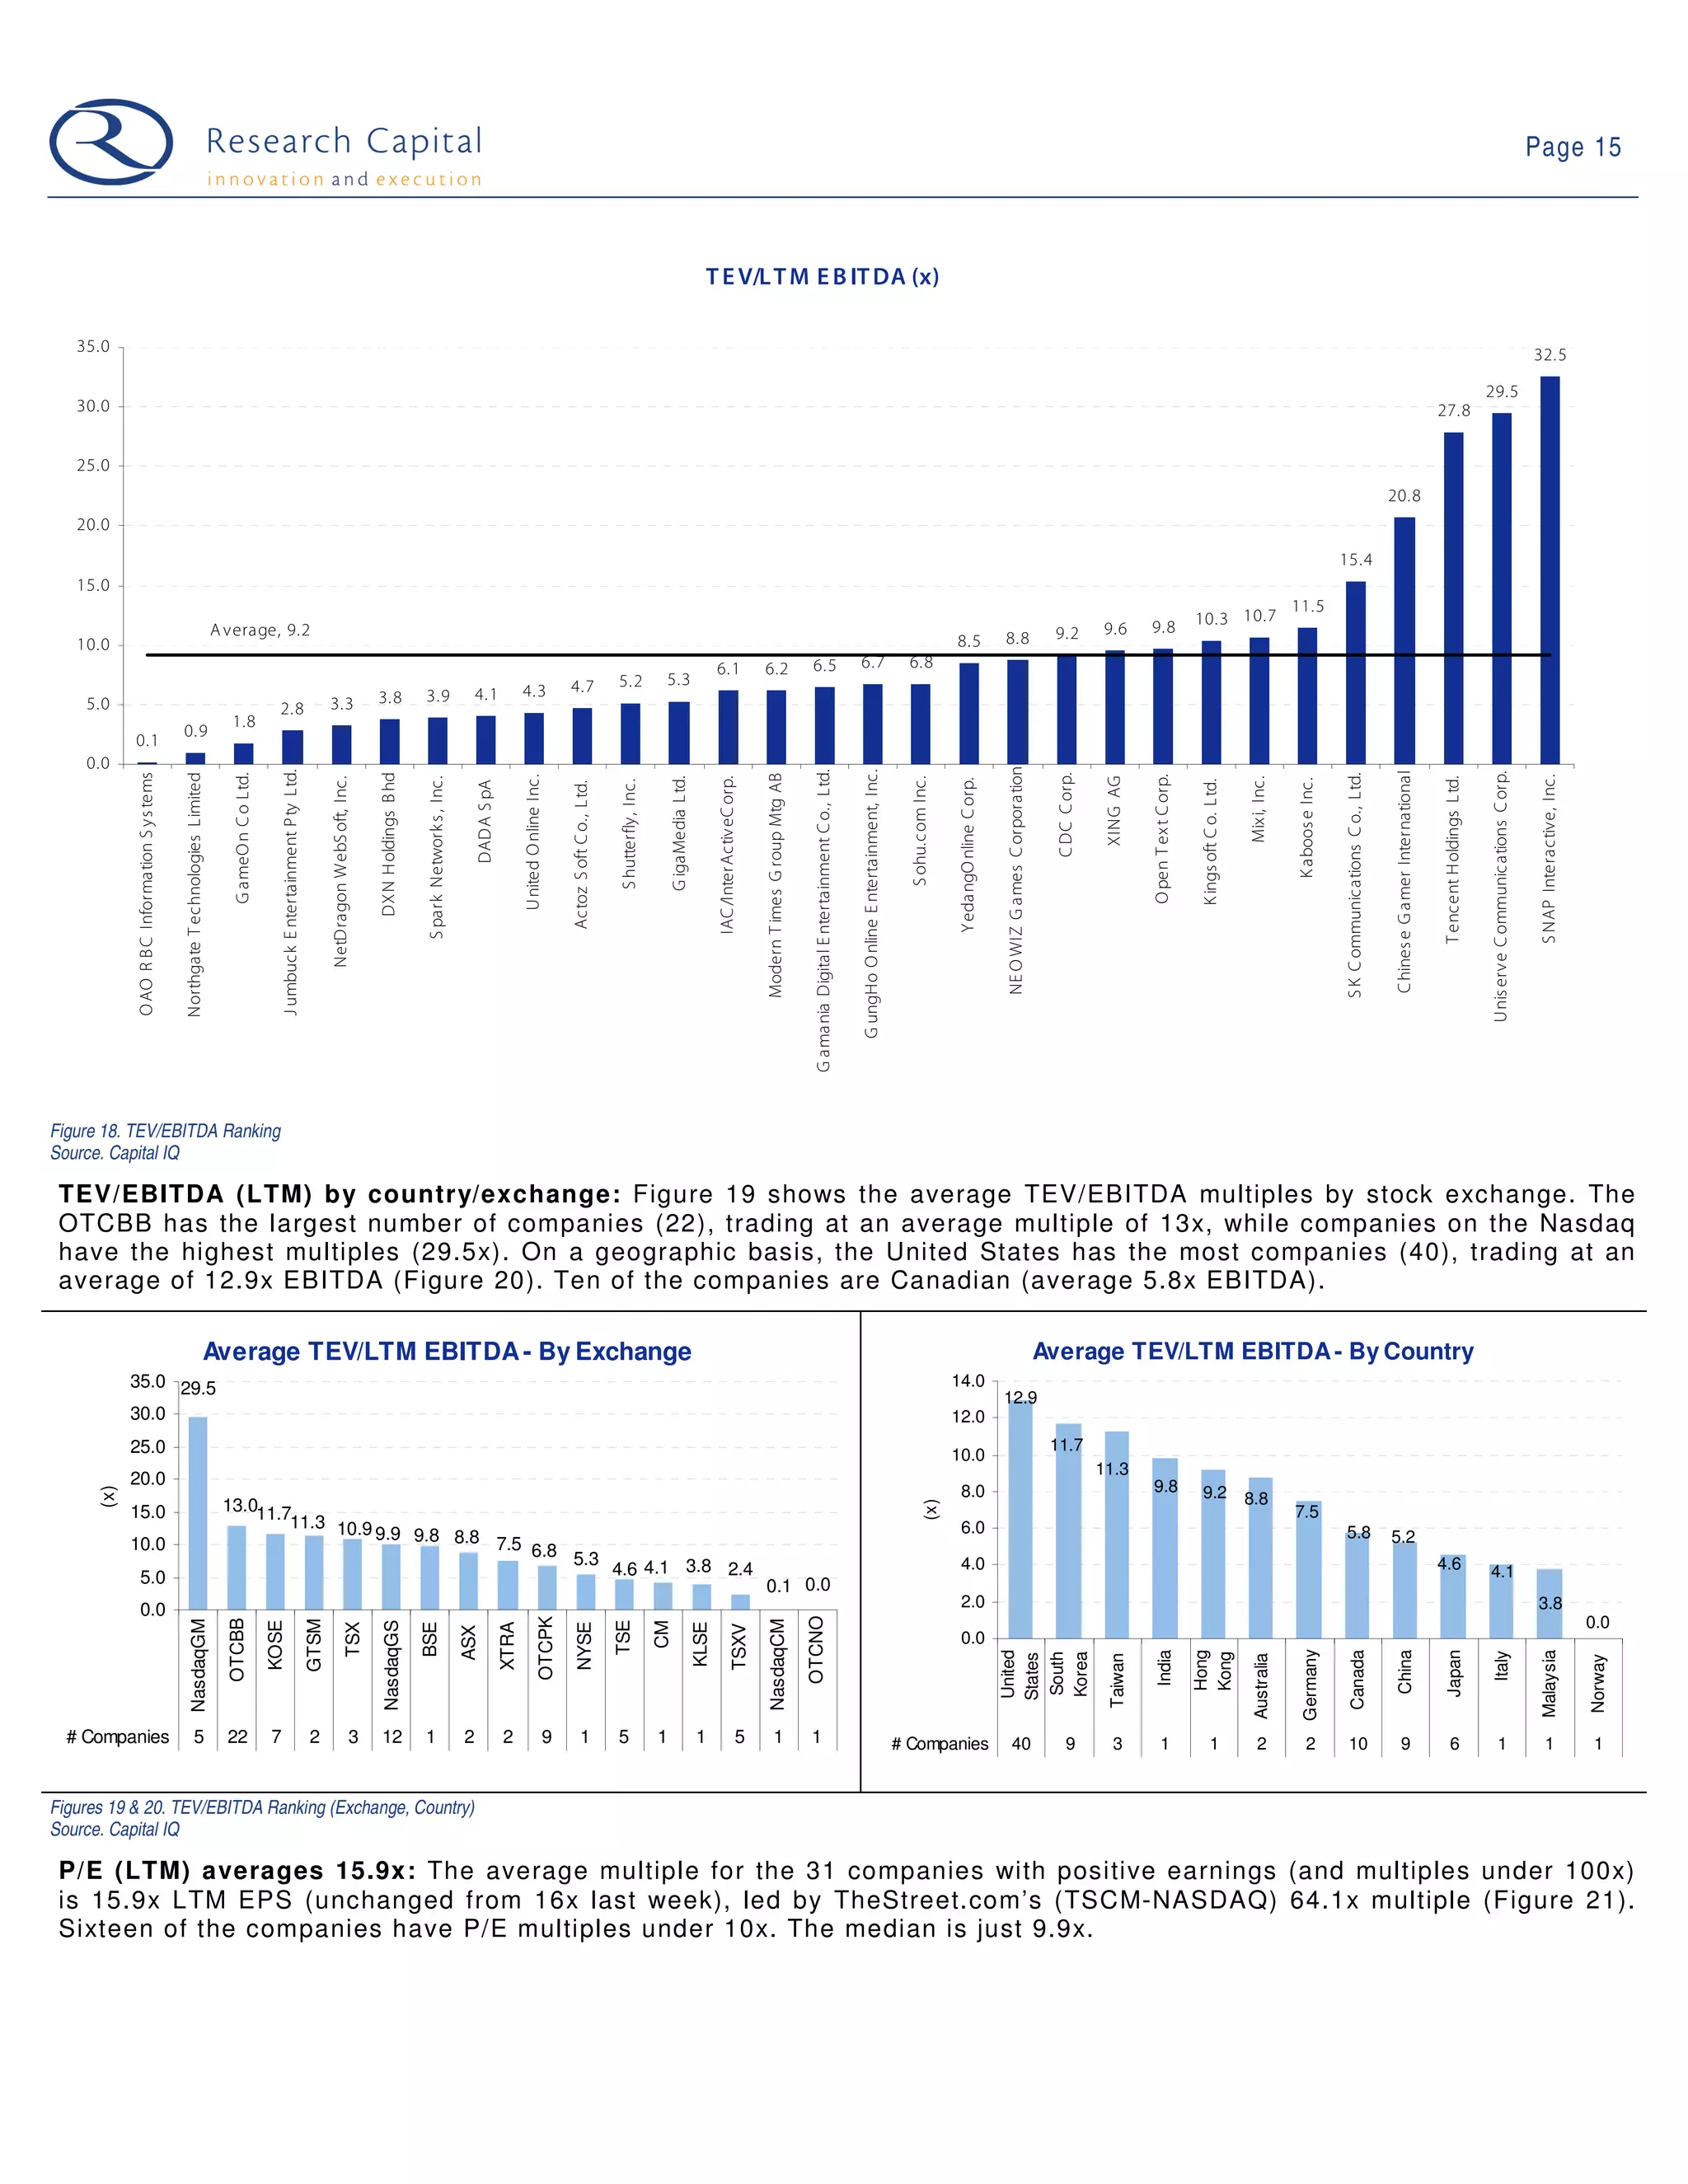
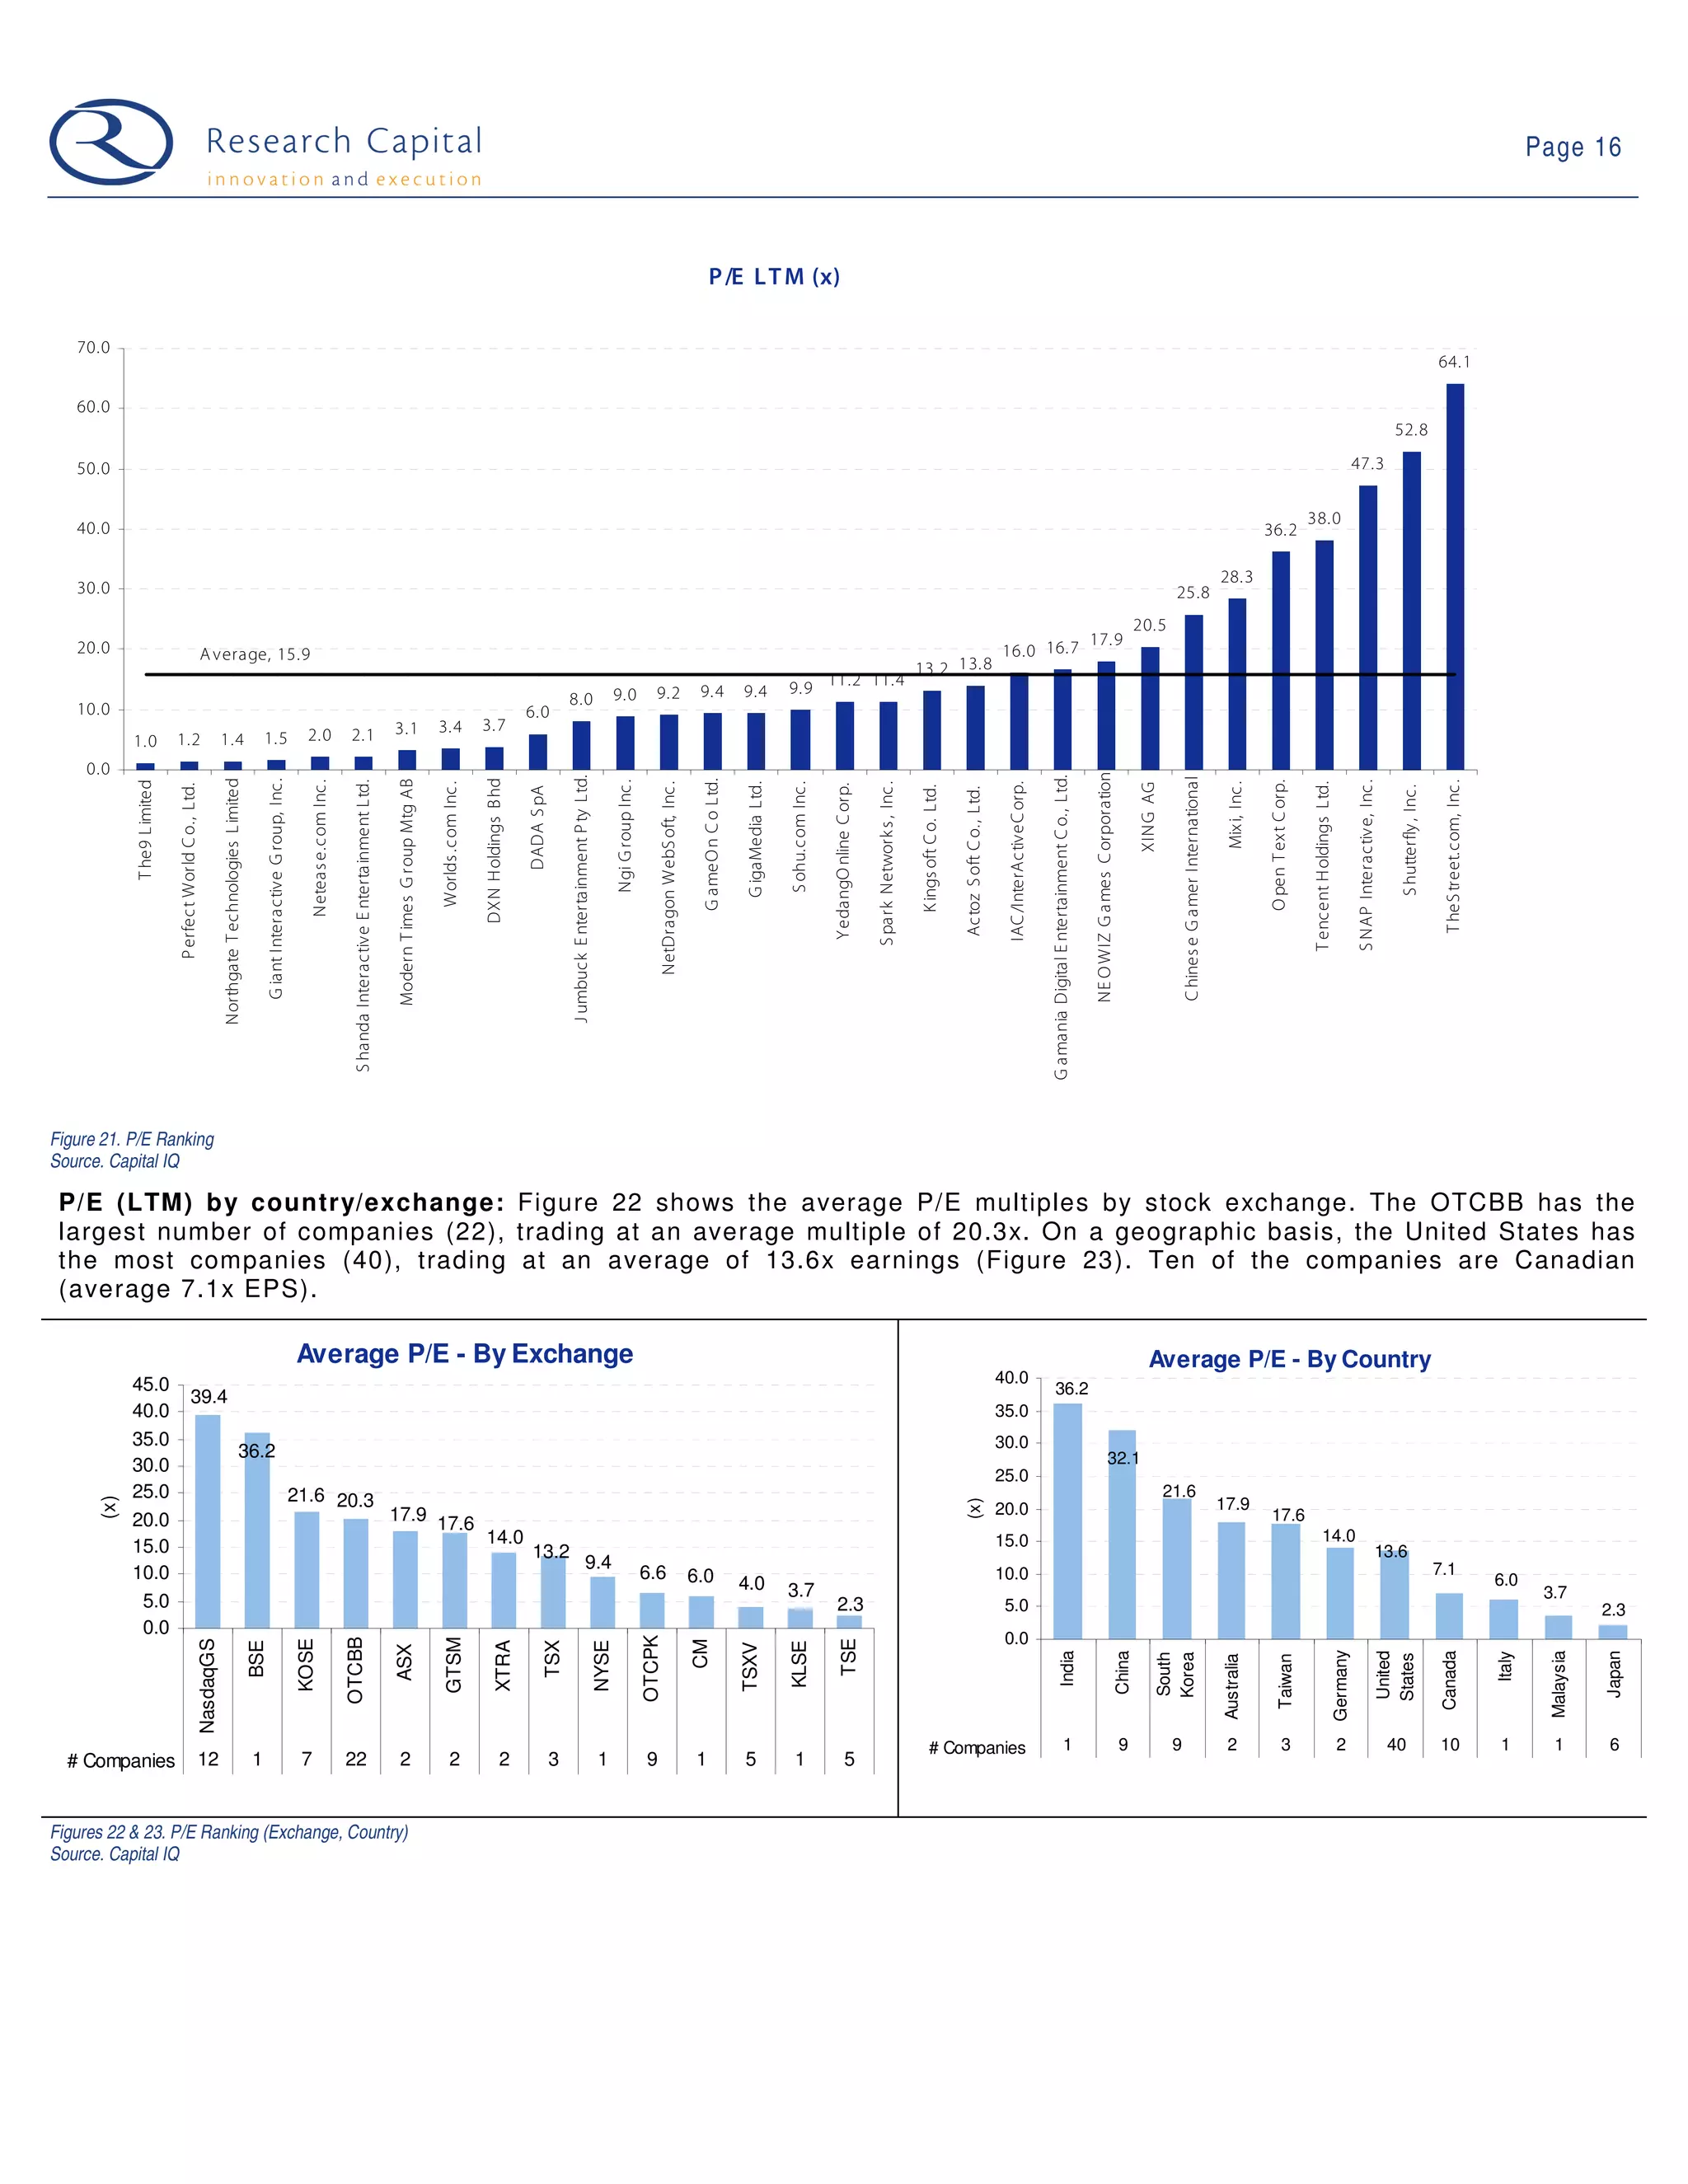
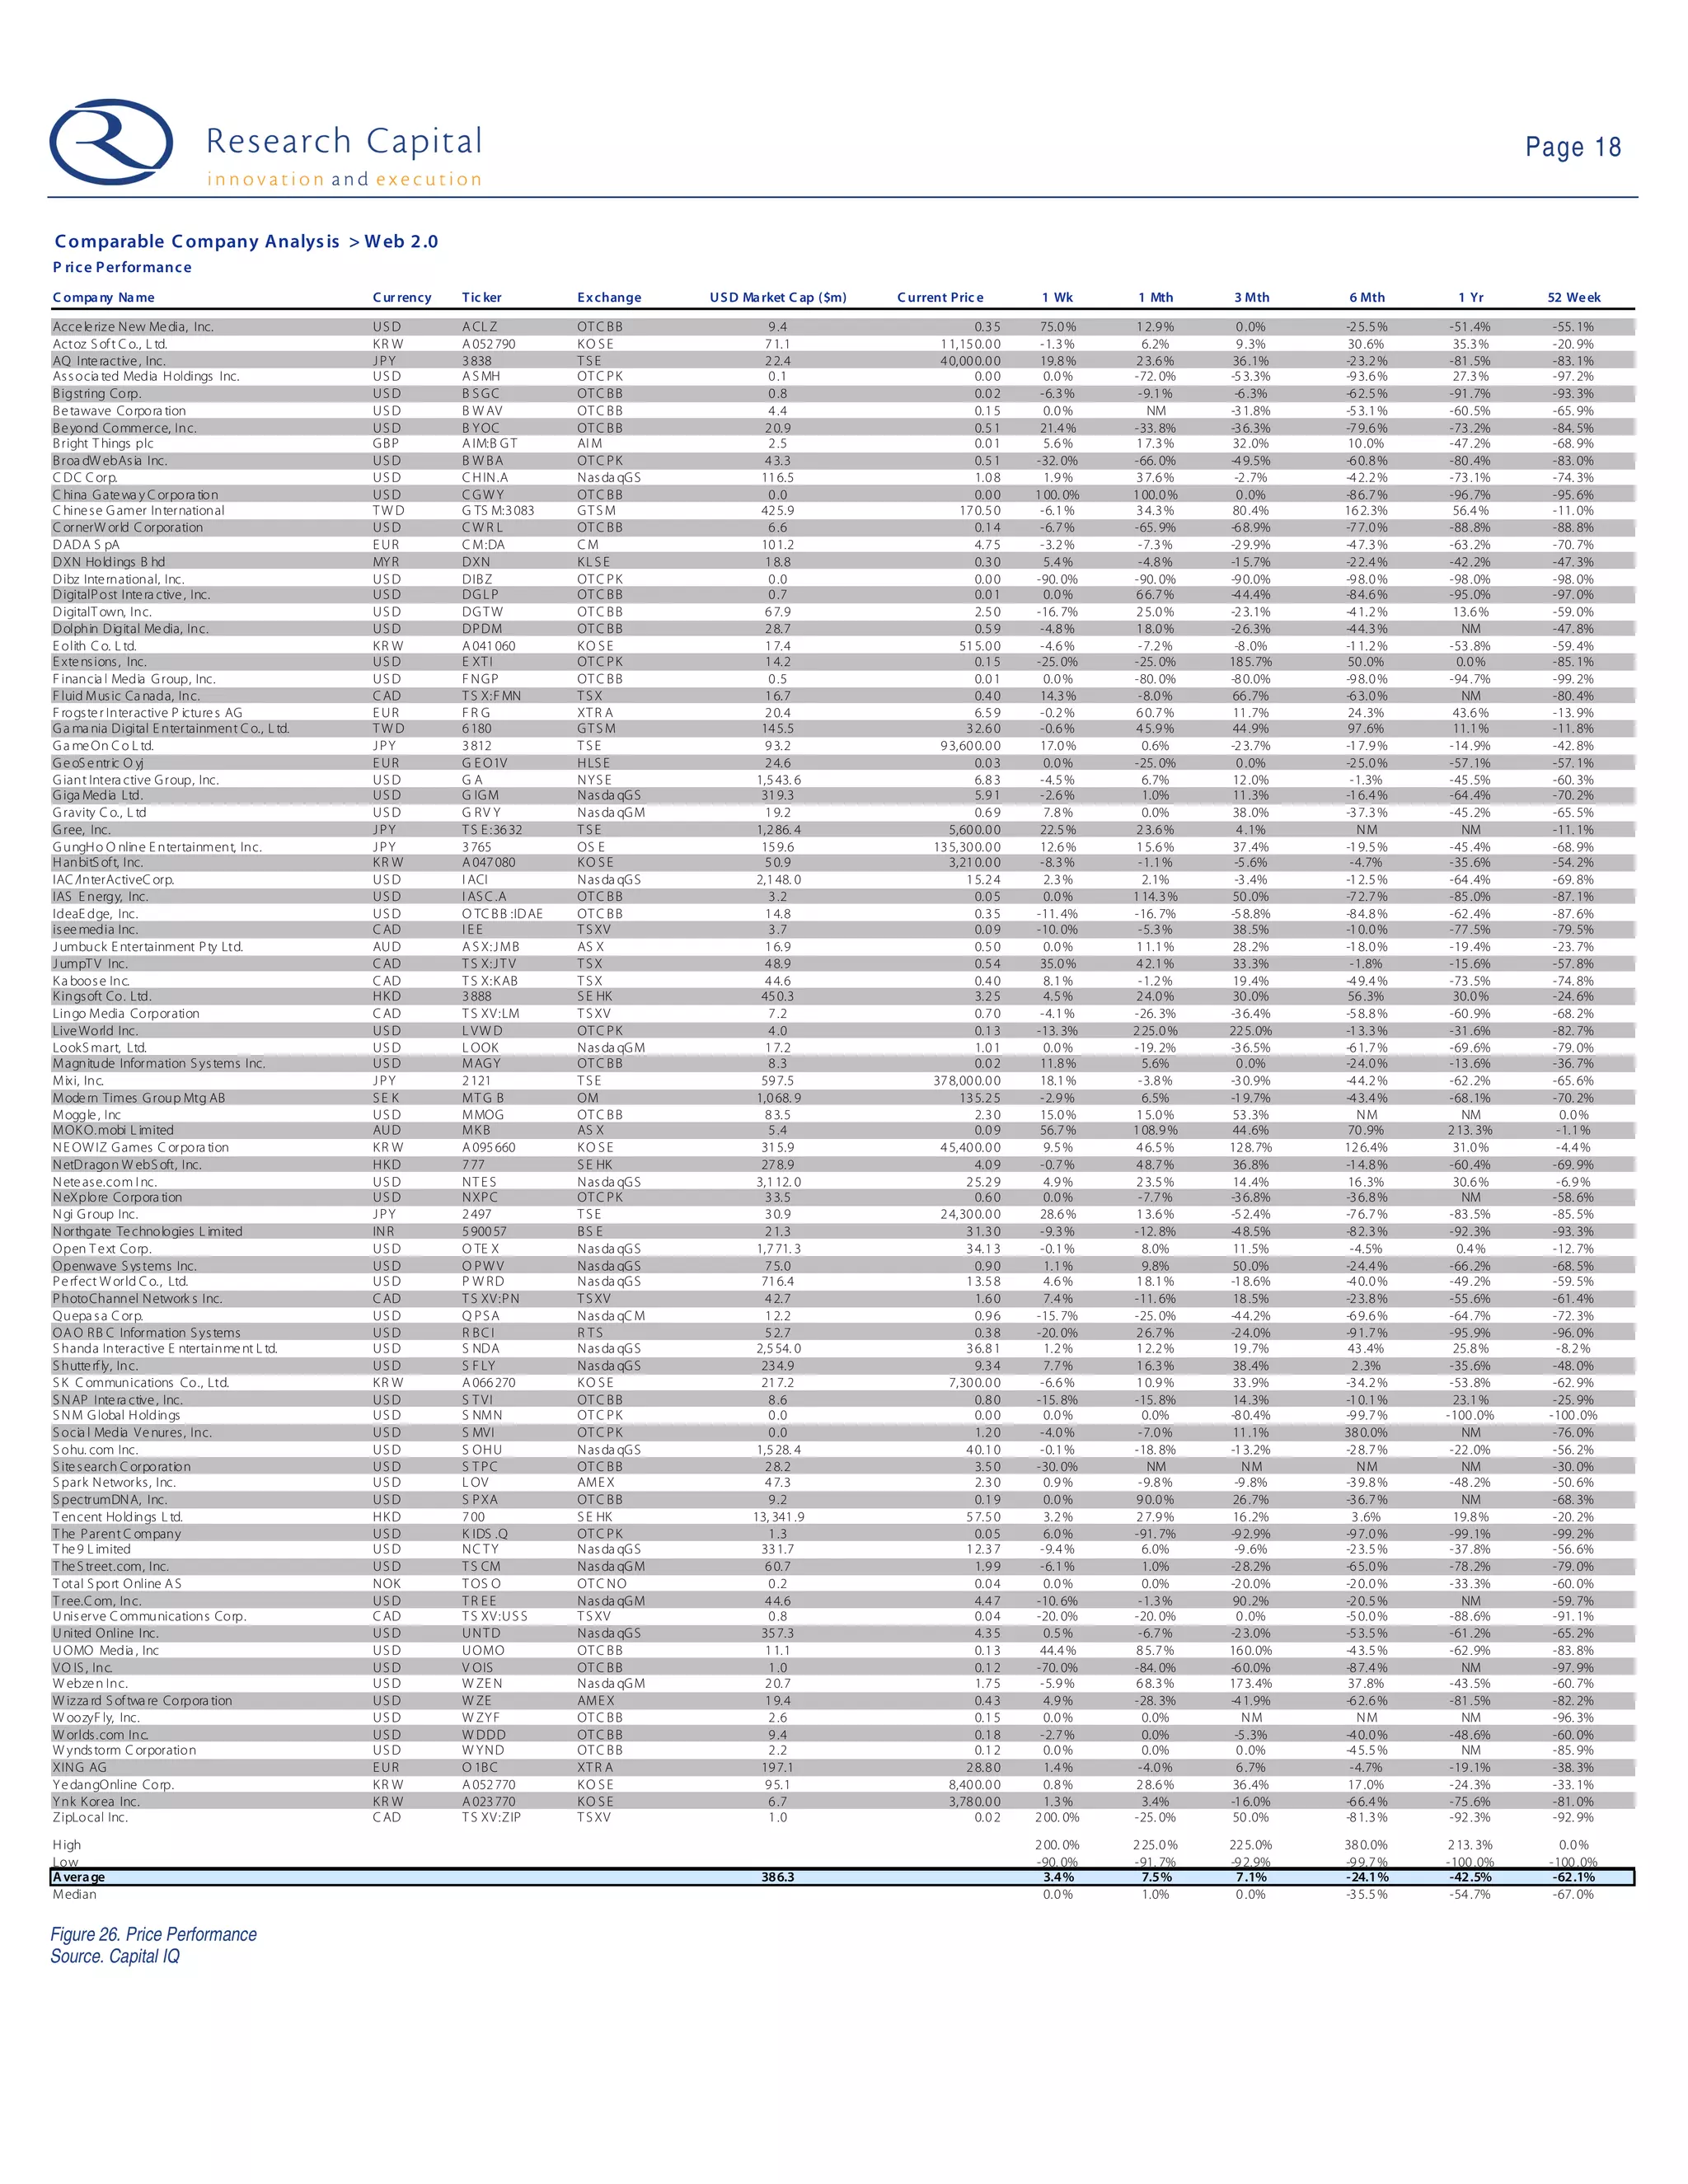
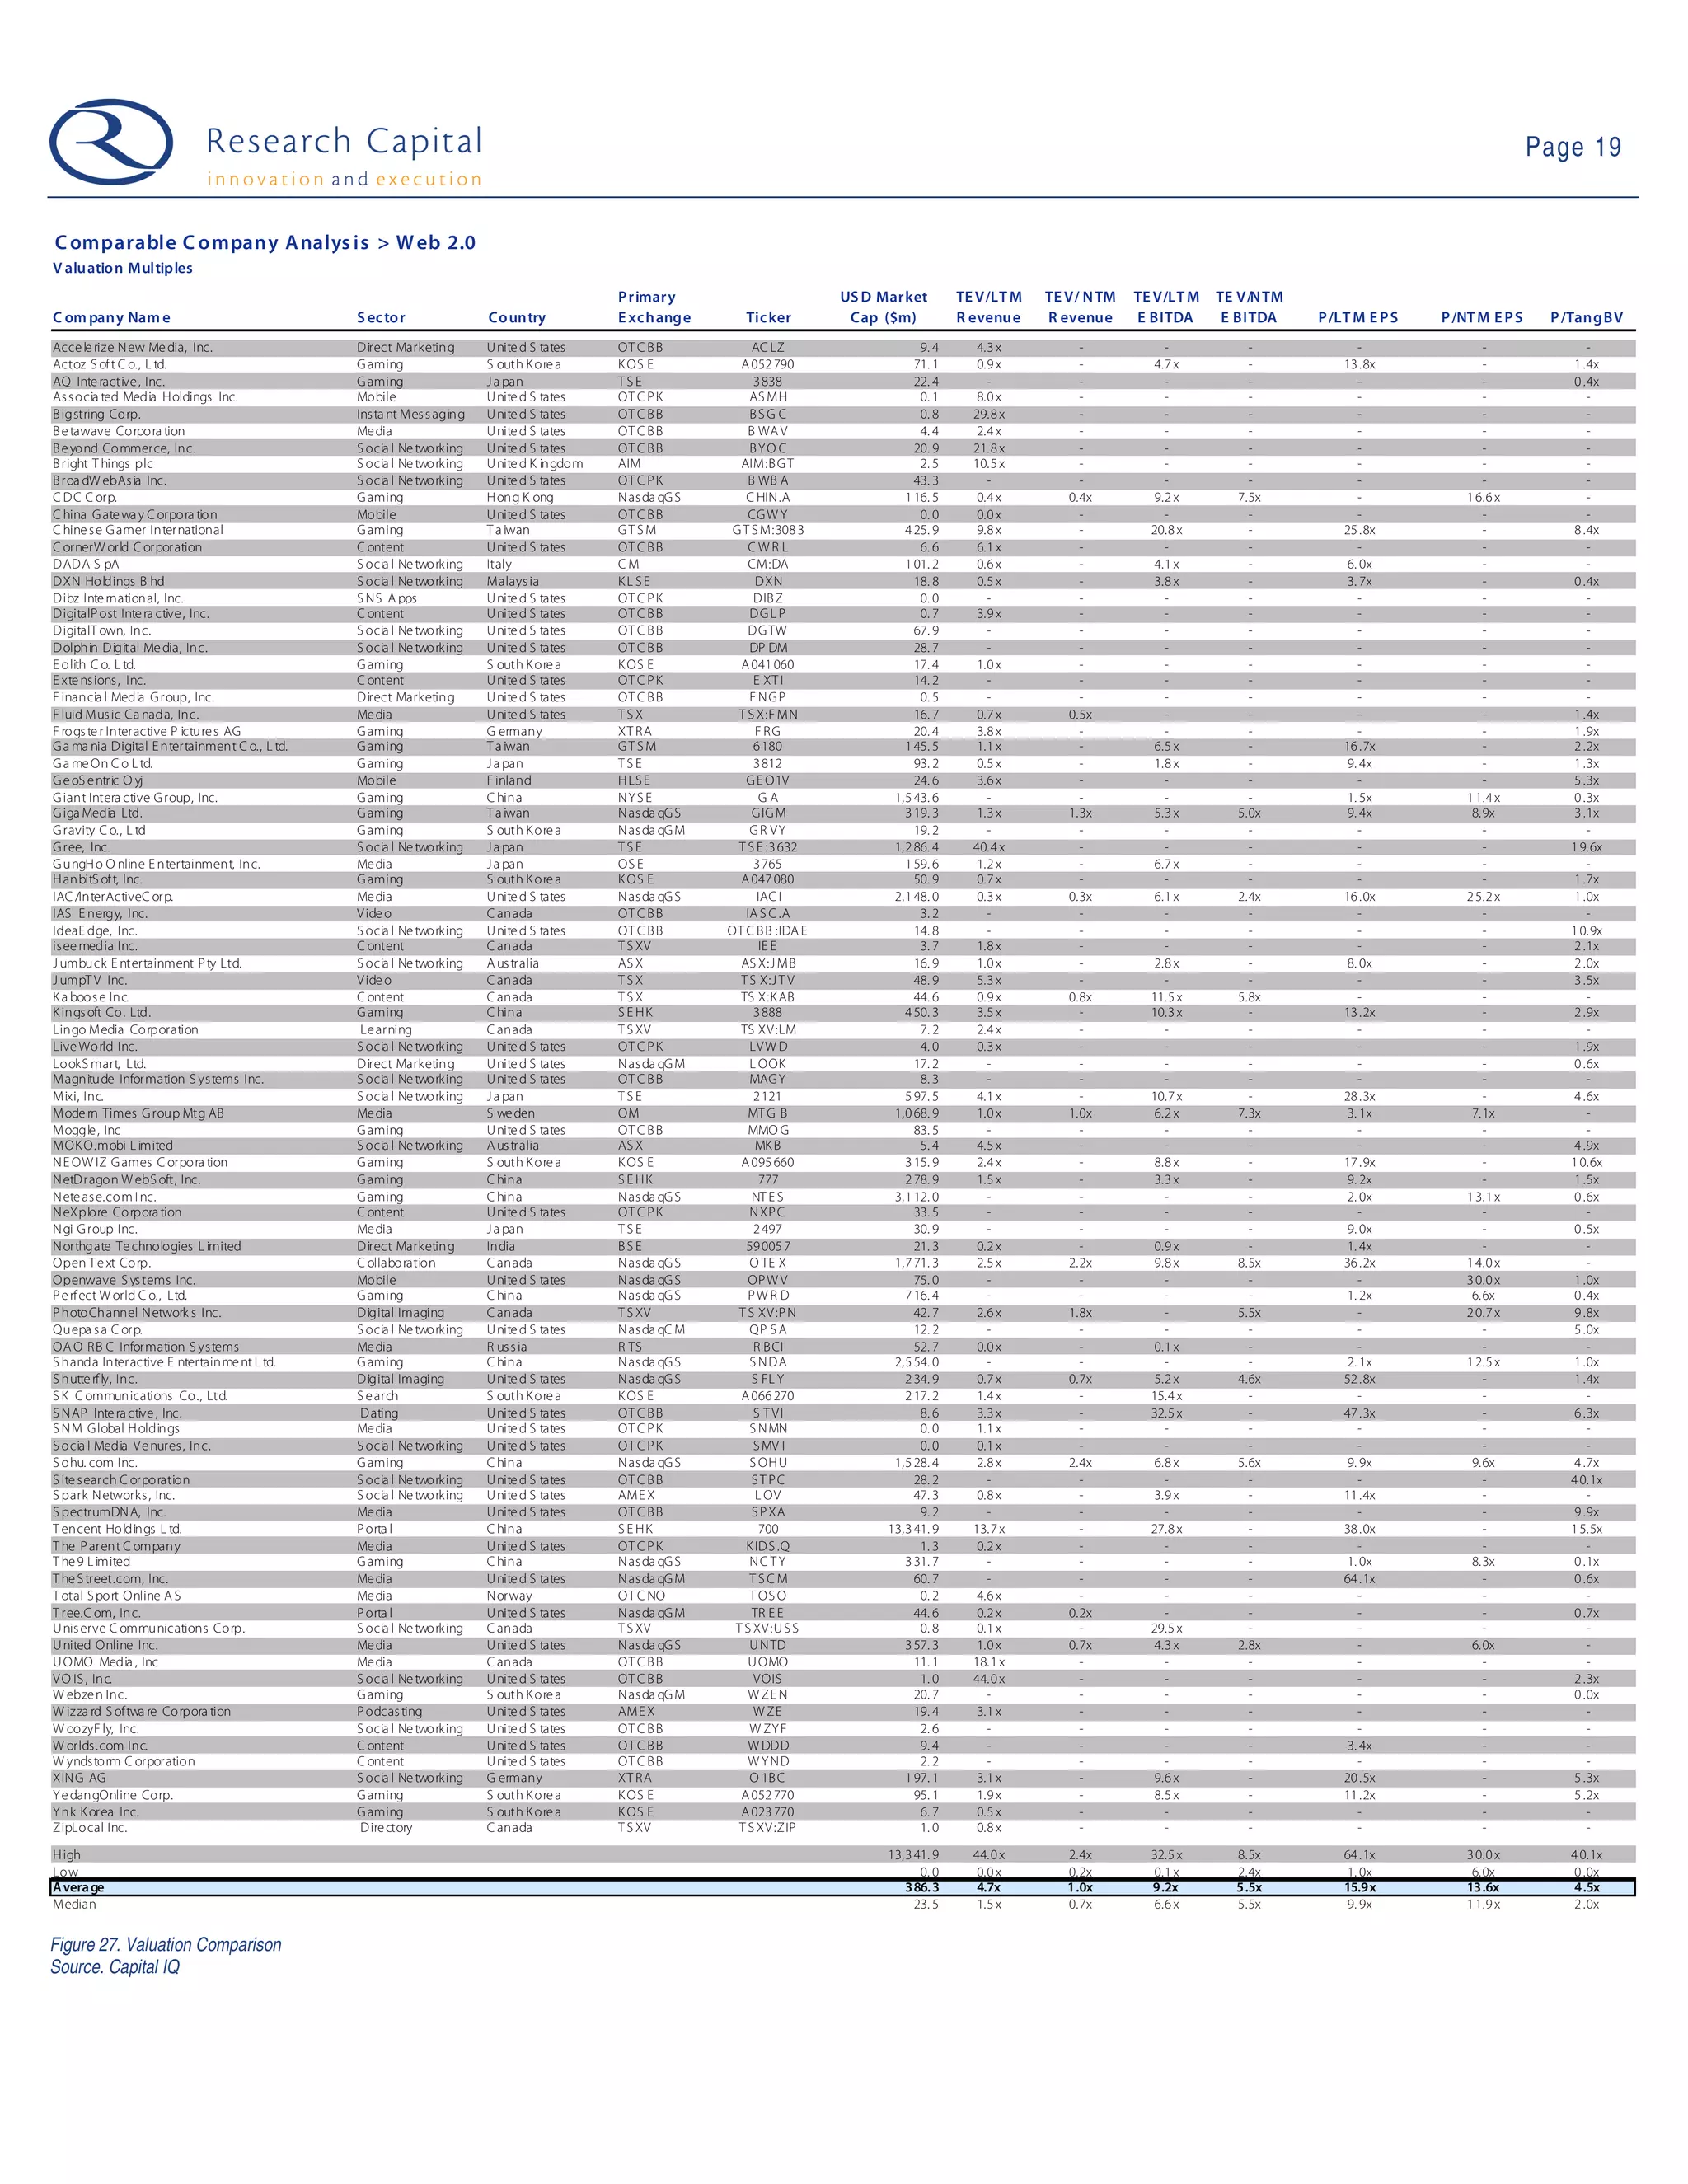
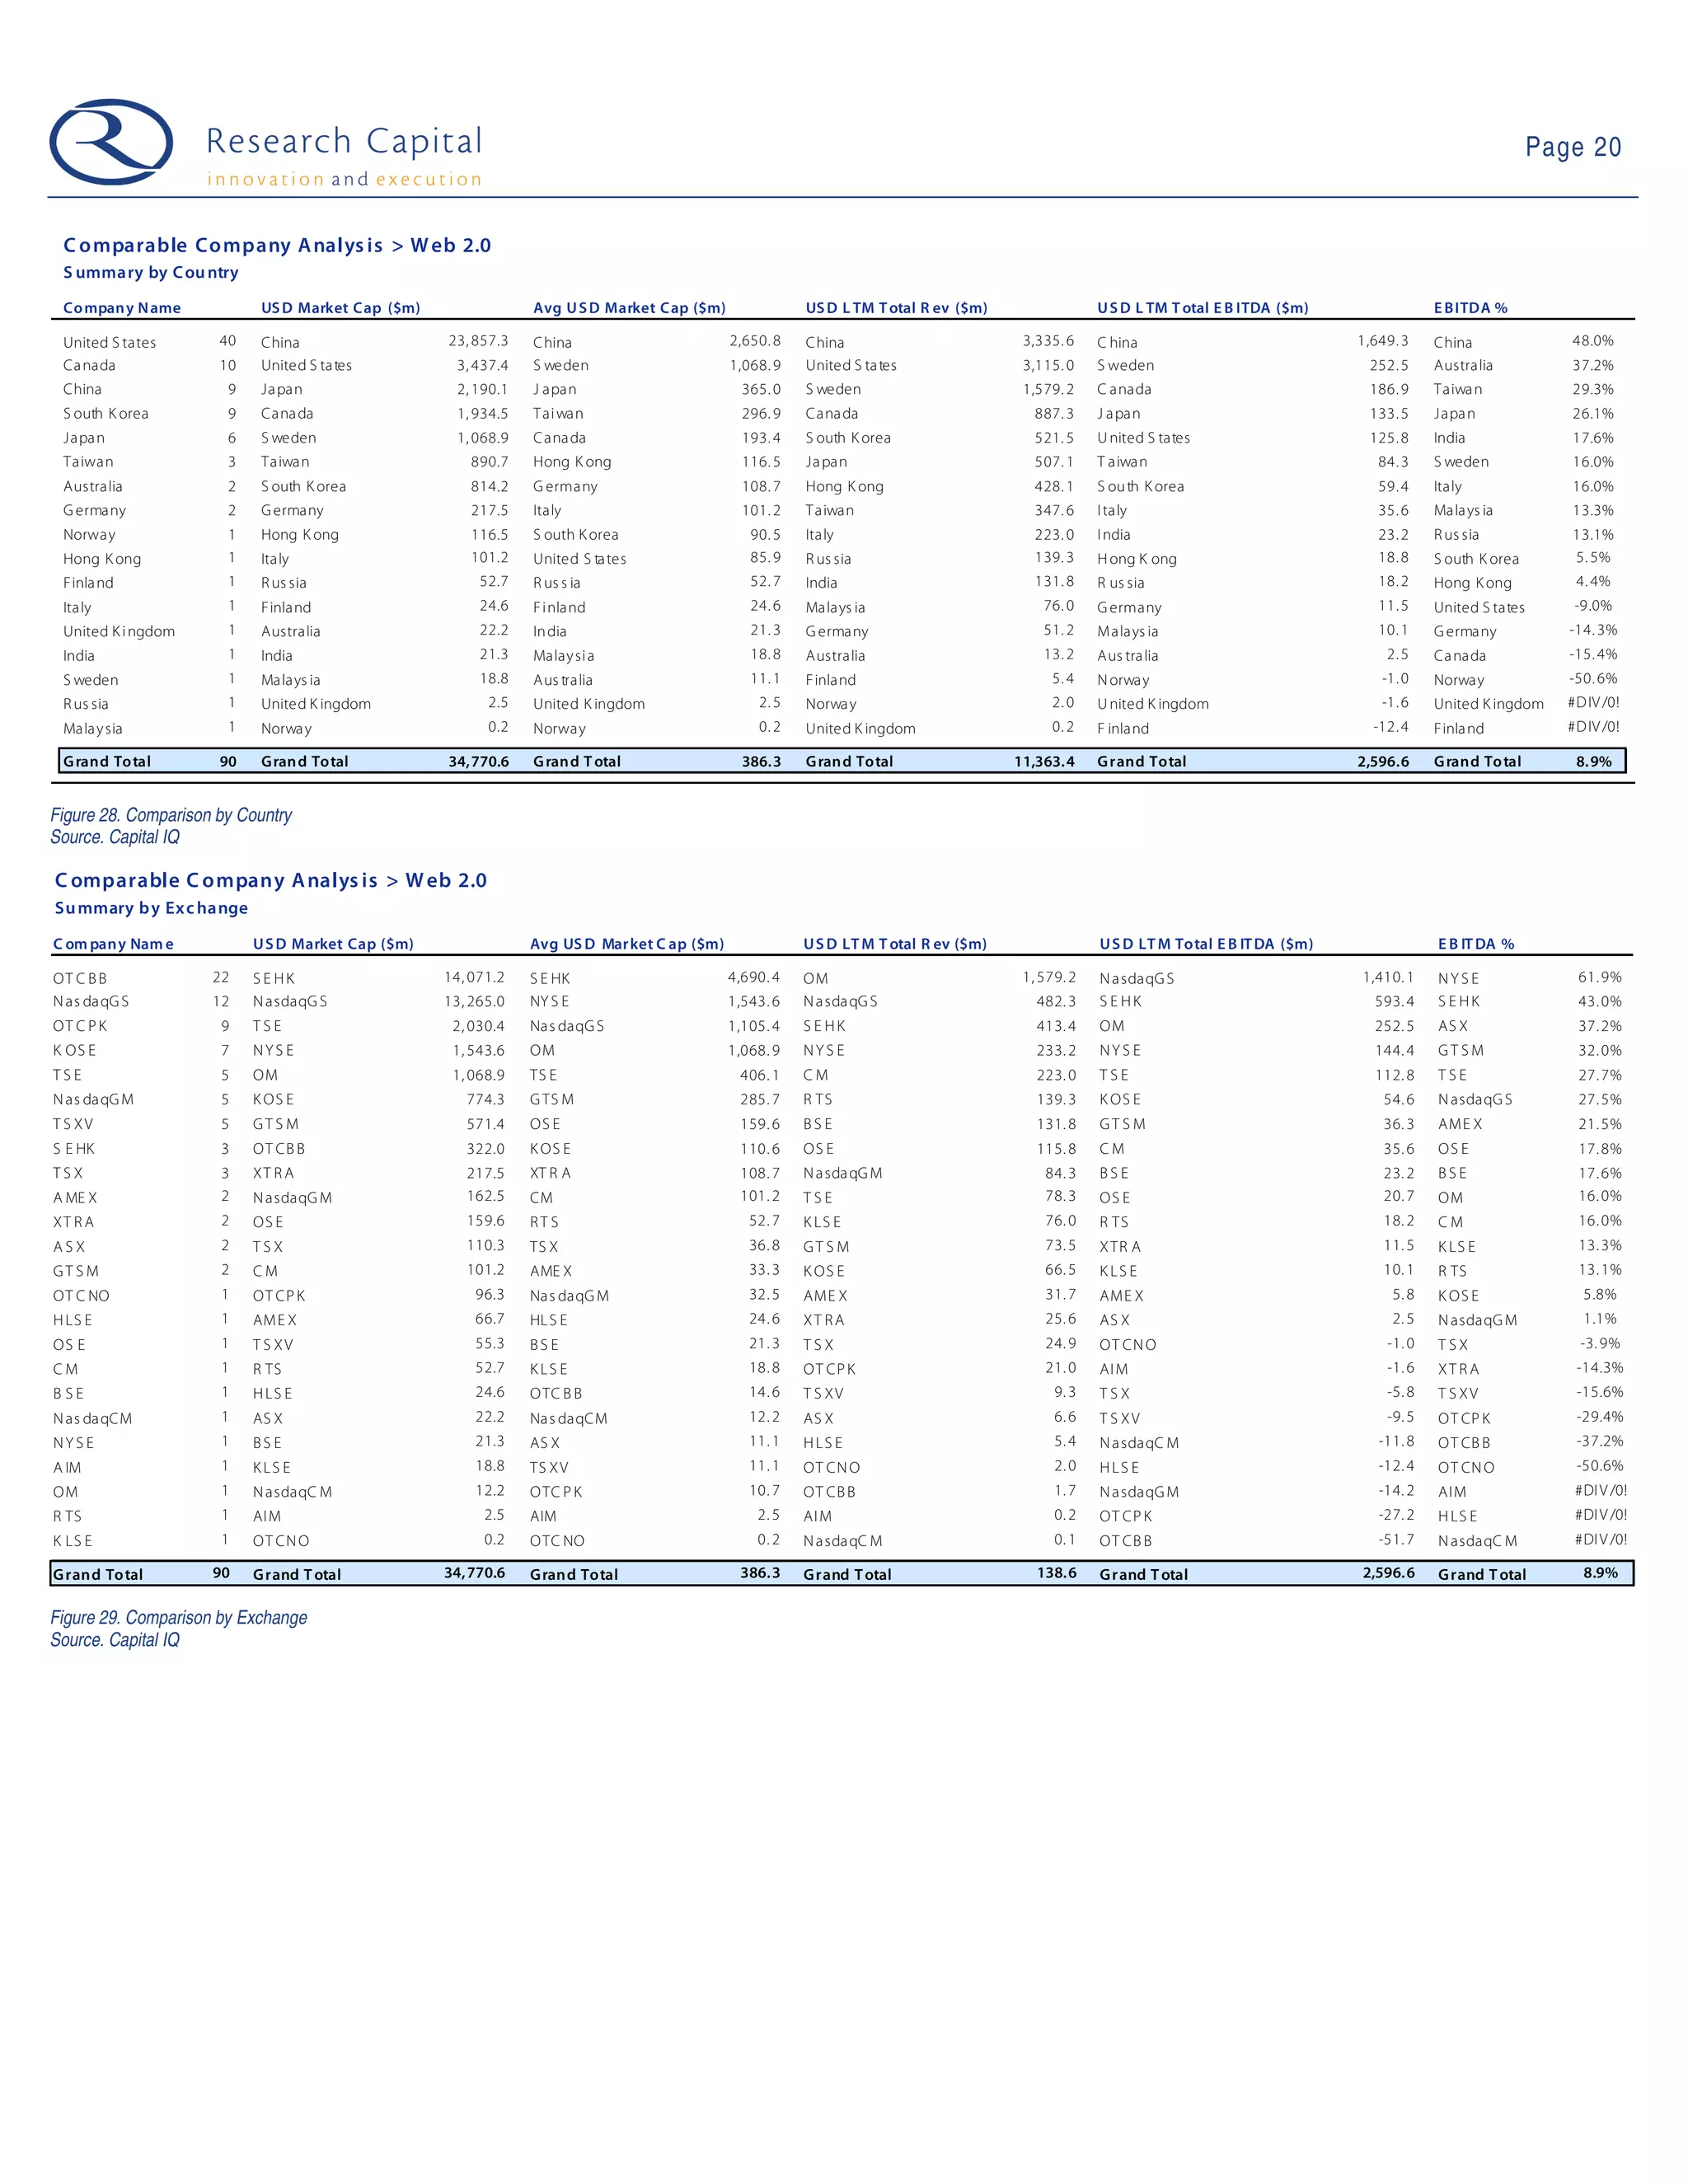
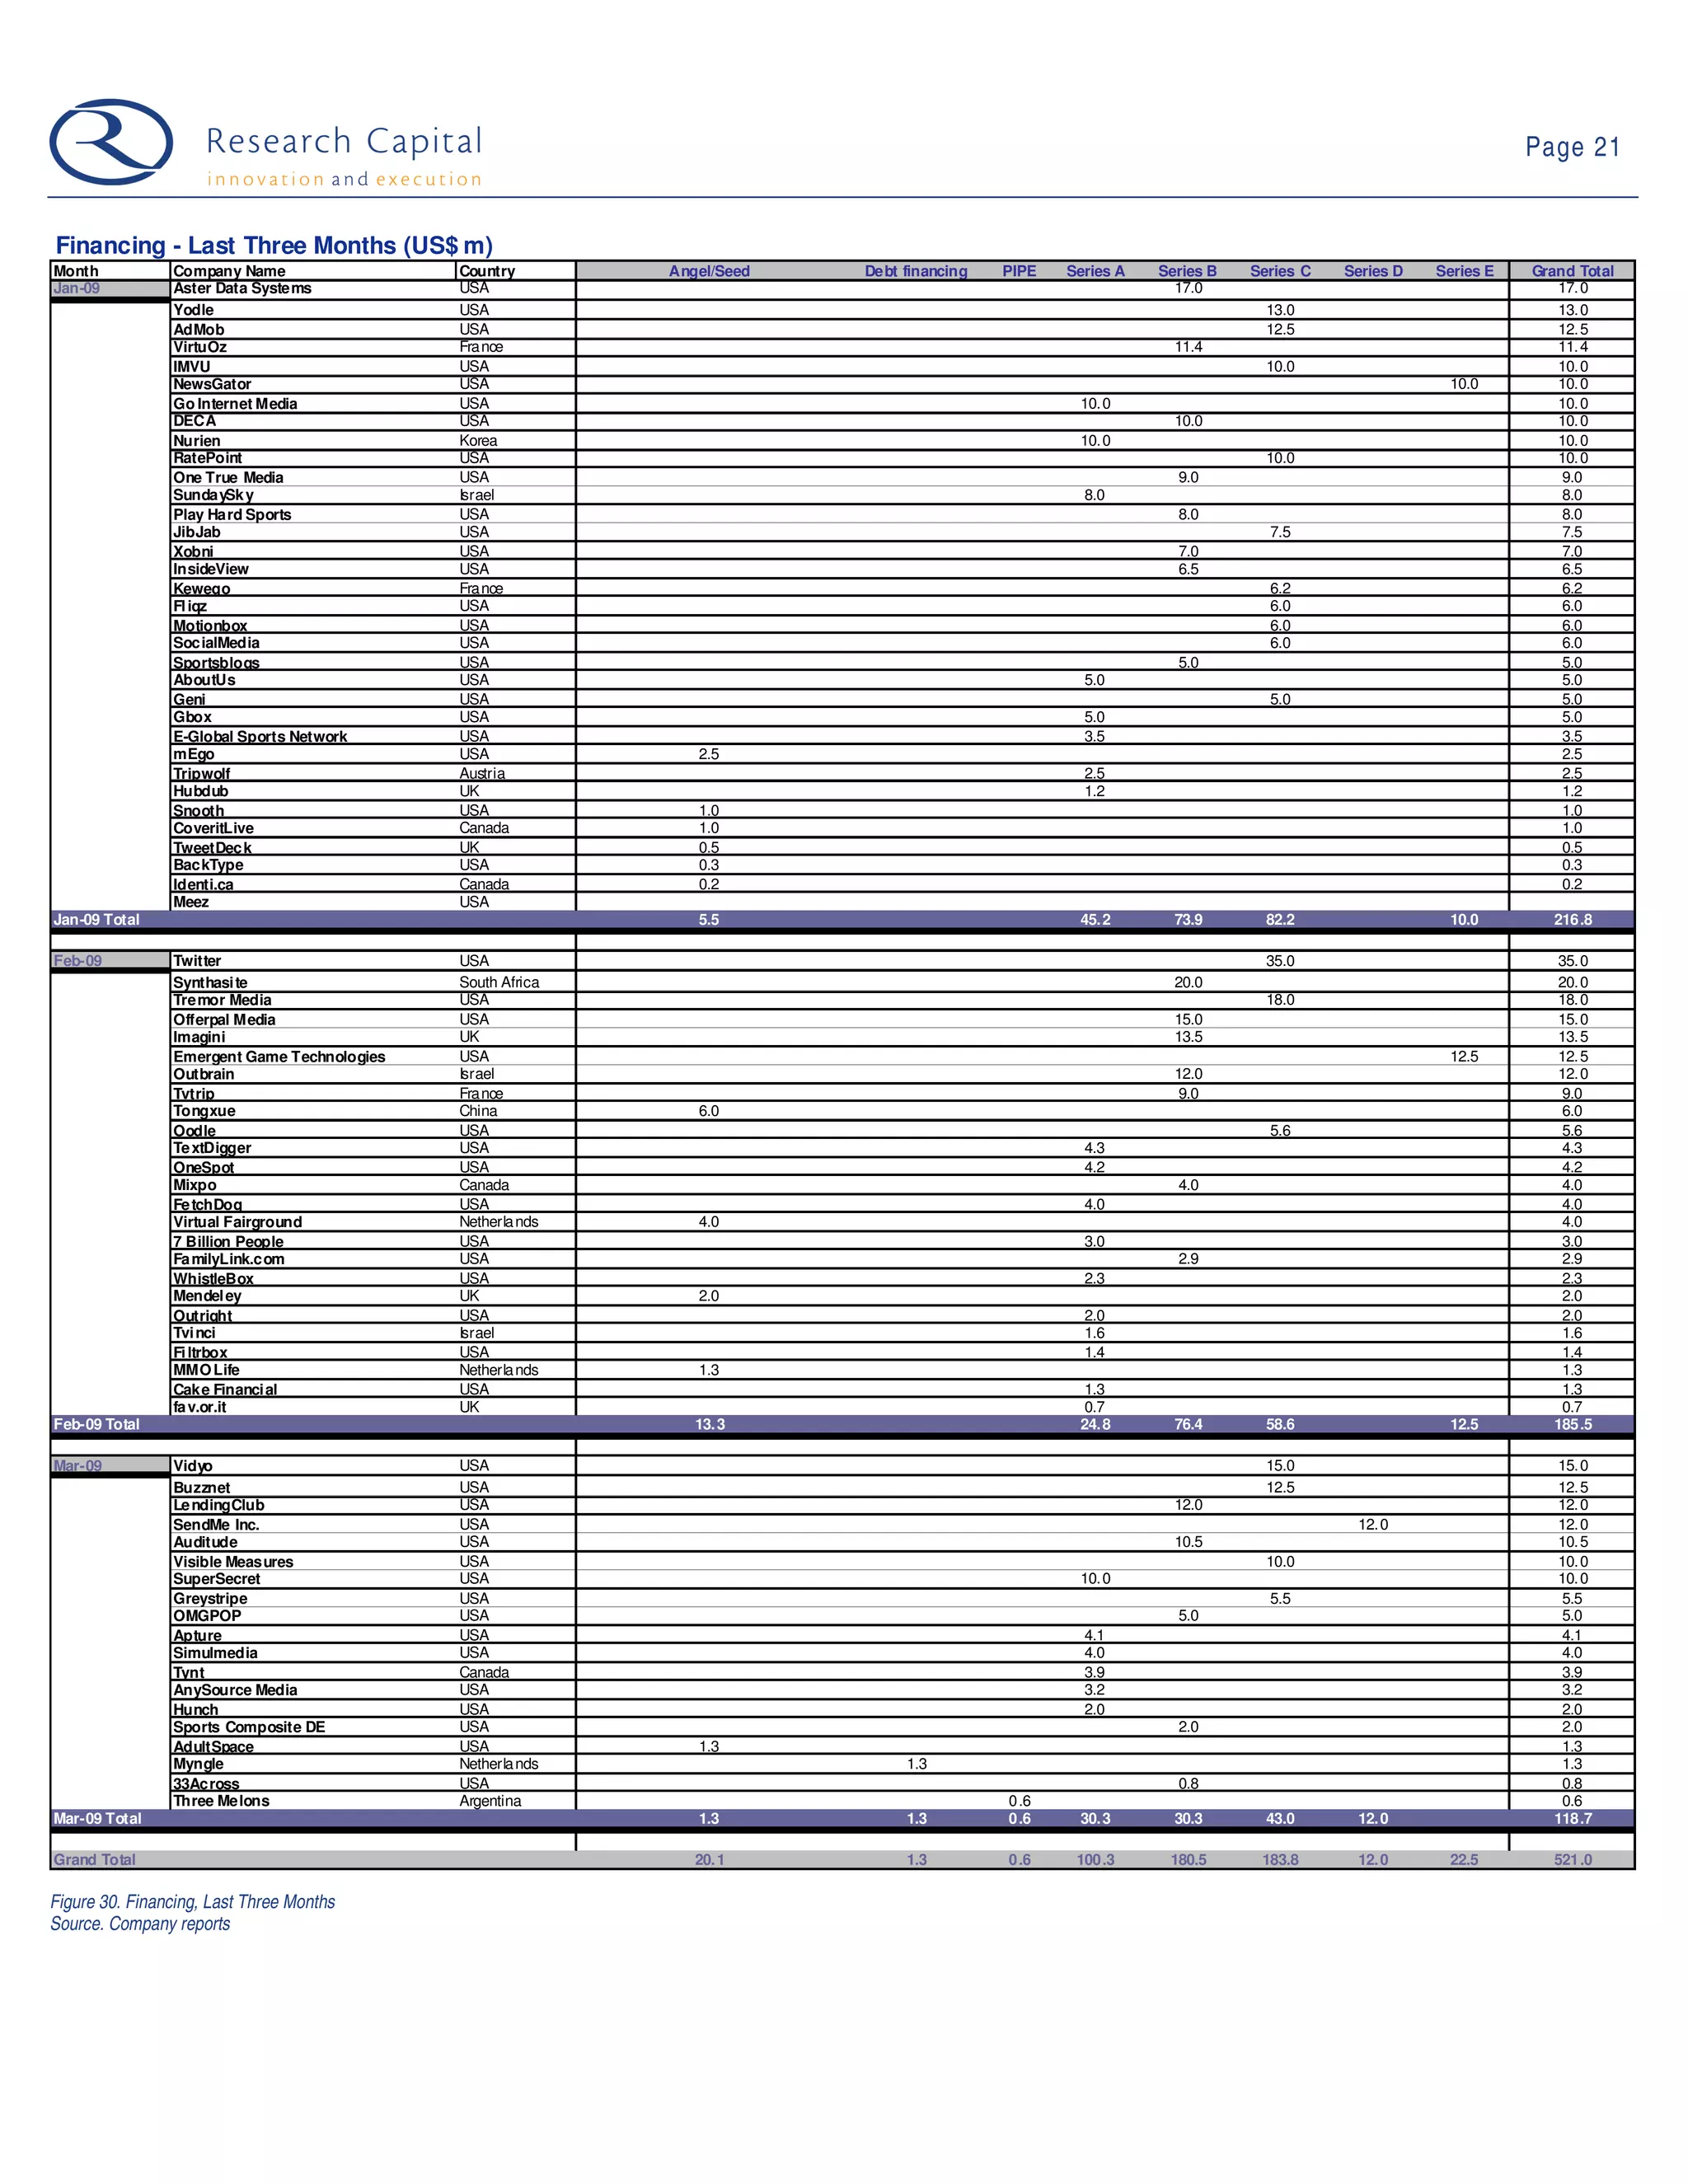
- The first quarter of 2009 saw a rebound in financing for web 2.0 companies, with $521 million invested across 77 financings, up 54% from the previous quarter but down 44% from the first quarter of 2008.
- Video and social networking sectors attracted the most investment in the quarter, with Twitter raising the most of any single company at $35 million.
- The document identifies 90 public web 2.0 companies, with a total market cap of $34.8 billion, and provides a table comparing various financial metrics like revenue, market cap, employees and valuation for these companies.
LATTER HALF OF 2009: FORGING FORWARD
DEAL VALUE ON PACE TO MEET NOVEMBER LEVEL
December starts at strong pace: Total transaction value in the Web 2.0 universe for the first week of December is $68.8 million. The number of financings stands at seven, averaging $9.8 million each. In comparison, total capital raised in November was $203.4 million, averaging $11.3 million (18 deals); October was $171.3 million, averaging $6.3 million (27 deals); and September was $232.8 million, averaging $9.0 million (26 deals).
Broad-based sector financing: Video, Gaming, Advertising, Collaboration, and Analytics experienced the most financing activity among our Web 2.0 sector categories in the past three months by number of transactions (six each). Social Networks remain strong with five deals in the past quarter. Infrastructure and Search round out the top three positions at four deals each over the past three months. The $400 million acquisition of Playfish skews the Virtual Worlds segment to the highest total.
Market pull-back abates – universe split between risers and decliners: Twenty-five companies in our universe had positive stock price performances over the past week (for stocks with prices greater than $1), while 22 companies showed negative 1-week returns.
Month-to-date financings in May totalled $106.6 million; led by the $20
million One Net financing. So far, there have been 18 financings in May,
with 10 deals greater than $5 million and only five less than $5 million.
There have been two financings greater than $10 million (Cyberplex and One
Net), with the capital raises by Imeem and EveryZing close behind at $8.8
million and $8.3 million, respectively. The average value thus far in May is
$5.9 million, slightly below the average value for April of $6.5 million on
21 financings. The March average was $6.6 million on 24 financings. Except
for two deals (Kaixin001.com and Collective Media), all were below $20
million for the last three months and a total of four deals were greater
than or equal to $15 million.
*One Net’s $20 million financing is largest deal in May: *One Net announced
a $20 million financing last week, the largest deal so far in May. Ten of
the 18 deals in the month are equal to or greater than $5 million. For
additional details, see Figures 23 and 24 (at end of note). Also note that
the spin-off of StumbleUpon from E-bay on a $29 million valuation occurred
in May. E-bay had bought StumbleUpon for $75 million.
*A strong price performance week: *The companies in our universe had
relatively strong stock price performances over the past week (for stocks
with prices greater than $1) (Figure 6), with 31 companies showing positive
returns on the week. OpenWave Systems (NASDQ:OPWV) led the group with a
49.2% return, while DigitalTown (OTCBB:DGTW) had the worst return, dropping
35.0% in the week.
April on track to be record month?: Total transaction value in the Web 2.0 universe April-to-date is $726.1 million. The number of financings stands at 40 averaging $18.2 million each. Note that this includes the $300 million investment in DST by Tencent. Even excluding this transaction, the average is $15.2 million. In comparison, total capital raised in March was $168.1 million, averaging $5.4 million over 31 deals. The highest monthly total in our Web 2.0 financing database was April 2008 with a total of $765.5 million raised in 47 transactions.
Deal round-up for April: The large deal highlights for the month include:
§
•Tencent invested $300mm in DST (investor in Facebook, Zynga, Groupon).
DST invested $135mm in social-shopping service Groupon.
Salesforce.com acquired crowd-sourced personal contact service, Jigsaw, for $142 mm.
•Warner Bros. acquired gaming company, Turbine, for $160 mm.
•Ankeena Networks, media infrastructure solution provider was acquired by Juniper for $100mm.
Bullish week for Web 2.0: Sixty-nine percent of the companies in our universe had increased or flat market caps over the past week, sixty-nine percent had increased EV/Revenue multiples, 75% had increased or flat EV/EBITDA multiples and 73% had increased or flat P/E mutliples .
The fourth week of April had only a marginal number of capital raises (four)
and not enough to push the month above March and February levels. Total
financings (month-to-date) were $102.3 million, with February and March
closing off at $185.5 mm and $159.5 mm, respectively. As of last week, a
total of 16 deals closed, with the $20 million raise by Collective Media and
$16 million by GOOM Radio being major contributors. Most of the companies in
our universe had positive stock price performances over the past week (for
stocks with prices greater than $1), with 22 companies showing positive
returns on the week. Modern Times Group Mtg AB (MTG B-OM) led the group with
a 27.7% return, while DigitalTown Inc. (DGTW-OTCBB) had the worst return,
dropping 21.7% in the week. Two companies had better than 20% price
increases last week.
New royalty agreement for webcasting & copyright firms: SoundExchange, a nonprofit royalty collecting organization associated with the Recording Industry Association of America (RIAA) agreed this past week to a new deal regarding royalty rates for webcasting. Under the new agreement, large commercial webcasters will pay up to 25% of their revenue to copyright holders – well below the 70% that could have been imposed under an earlier deal. While the deal was initially agreed to by three smaller Internet radio webcasters, Pandora Media, the third largest radio site (according to Alexa), also indicated it would sign on to the agreement.
Online Media companies lead financing: Two online media companies – Pandora (Internet Radio) and QuickPlay (Mobile Video) have secured the largest financing transactions thus far in July ($35 million and $12 million respectively). Total capital raised so far in July is $66.1 million through eight transactions, averaging $8.3 million per transaction. June closed with $180 million in financing on 36 transactions. The averages for the months of May (excluding the Facebook transaction) and June were $6.4 million and $4.7 million, respectively.
A weak price performance week: The companies in our universe had weak stock price performances over the past week (for stocks with prices greater than $1) (Figure 6), with 30 companies showing negative returns on the week. Gravity (NasdaqGM: GRVY) led the group with a 33% return, while GungHo (3765-OSE) had the worst return, dropping 26.4% in the week.
Financing activity continued to ramp up in April after a slow start to the month. Total financings (month-to-date) jumped to $92.2 million (this week) from $66.3 million (last week) – a significant +40%. As of last week, a total of 12 deals closed, with a $16 million raise by GOOM Radio being a major contributor. A total of four deals greater than $10 million each helped the overall statistics. Social Networking company DigitalTown Inc. (DGTW-OTCBB) was the top price performer for the week, returning 20%, closely followed by Kingsoft Co. Ltd. (3888-EHK) at 17.6%. The9 Ltd. (NCTY-NasdaqGS) had the worst return, dropping 27.6% in the week after news of its losing the license to operate World of Warcraft in China. Of the 34 companies (with stock price greater than $1), 10 companies on our list had price performances greater than +10%. Only one company returned more than
20%.
Web 2.0 Weekly - June 22, 2010: "AOL Sells Bebo for Massive Loss"David Shore
Deals (M&A, Finance)
AOL is reported to have sold Bebo, the UK-based social network it bought just two years ago for $850 mm, to private equity firm Criterion Partners for under $10 mm. Based on our calculations, AOL paid the equivalent of $38 per Unique Visitor (UV) for Bebo, and sold it for under $1 per UV.
Positive price performance
The Web 2.0 public company universe rose again this week, with 60% of companies seeing their market cap rise vs. 33% falling and 7% flat.
Web 2.0 Weekly - July 20, 2010: "DST Cashing Up"David Shore
Large deals drive July financing to near record levels: With another huge financing (DST - see below) July financing is near record monthly levels. Total raised month-to-date is $742.6 million over 29 deals - averaging $25.6 million each. Excluding the Zynga ($100 million) and DST ($388 million) deals, the average deal size is $9.4 million. In comparison, total capital raised in July 2009 was $209.0 million, averaging $5.2 million over 40 deals. The monthly median total is ~$280 million with a median deal size of $8.1 million.
Deals (M&A, Finance)
Naspers, a South African media and print conglomerate, invested $388 mm in Digital Sky Technologies, the Russian digital media holding company with significant stakes in Facebook, Groupon, Mail.ru, and Zynga.
The next biggest raise of the week was Australian enterprise software developer, Atlassian, receiving $60 mm in Series A funds from Accel Partners.
Social Commerce continues to garner attention – this week BlueSwarm ($0.8 mm angel round) and Shopkick ($15 mm Series B round) raised money.
Another $31 mm in venture funds found their way to Advertising-related start-ups, including Israel-based Adsmarket ($17 mm), as well as a pair of India-based companies – Komli Media ($6 mm) and InMobi ($8 mm).
Price performance split
The Web 2.0 public company universe was split this week, with 48% of companies seeing their market cap fall vs. 43% rising and 9% flat.
Web 2.0 Weekly - July 27, 2010: "July Financings - Approaching High for 2010"David Shore
Deals (M&A, Finance)
Jive Software received the biggest investment of the week at $30 mm, bringing its total capital raised to date to $57 mm – the company brings social network-like functions to the realm of enterprise collaboration.
Advertising networks continue to receive the most attention among sectors we track – this week, $24.6 mm in financings were announced, including sports-related ad network Sportgenic (acquired by Glam Media for $12 mm), and TurnHere ($12.6mm in Series B funds).
Rumour alert – we continue to hear more frequent buzz concerning the potential acquisition of social gaming developer Playdom by Disney.
Synchronica (AIM:SYNC) intends to acquire iseemedia (TSXV:IEE) for C$8.8 mm in stock – both companies are engaged in mobile communications development, such as email-to-SMS.
Price performance turns positive
The Web 2.0 public company universe was positive this week, with 54% of companies seeing their market cap rise vs. 34% falling and 12% flat.
*Capital Market Activity: *The month of May closed with 20 financings
totalling $327.1 million led by the $200 million investment by Digital Sky
Technologies in Facebook. Excluding the Facebook transaction, May would have
been the lowest month in CY2009. The Facebook transaction aside, four
transactions (One Net Ent., Cyberplex, Peer39 and OpenX), were greater than
or equal to $10 million. The average value in May is $15.6 million (and $6.4
million excluding the Facebook transaction), greater than the average value
for April of $6.2 million on 21 financings. The March average was $6.5
million on 24 financings. If you are aware of any companies that have
recently raised money that are not on our list, please send me an email to
have them added to our database.
*Price Performance: *Most of the companies in our universe had positive
stock price performances over the past week (for stocks with prices greater
than $1) (Figure 12), with 29 companies showing positive returns on the
week. GameOn co. Ltd (3812-TSE) led the group with a 28.2% return, while
eolith Co. Ltd. (A041060-KOSE) had the worst return, dropping 13.7% in the
week.
The month of April saw 21 financings totalling $144.5 million, with not enough transactions (volume and size) to boost levels above any month in 2009. In perspective, February and March closed off at $185.5 mm and $159.5 million, respectively. On a much more positive note, we saw the announcement from Disney taking a significant position in Hulu - a strategic move in Web-TV distribution. This brings together three of the biggest broadcast and cable network owners under the same banner. Additionally, we would like to highlight that from a sector perspective, video saw the most amount of capital raised at $75.4 million (Figure 4) over a 3-month period. Is this an indication of things to come? Most of the companies in our universe had positive stock price performances over the past week (for stocks with prices greater than $1) (Figure 12), with 19 companies showing positive returns on the week. Tree.com (TREE-NASDAQ) led the group with a 62.3% return, while Beyond Commerce Inc. (BYOC-OTCBB) had the worst return, dropping 10.7% in the week. Four companies had better than 20% price increases last week.
In the first week of May, $38.9 million was raised on seven deals. Over the last three months, four sectors, Media, Ad Network, Video, and Social Network, have seen the most activity, bringing in a combined $209 million on 25 transactions. Overall, capital market activity has trended downwards on the back of a declining economy and lower valuations. With any sustainable certainty and stability in the public markets, we would expect to see activity pick up as more institutions participate in private placements. Seven companies raised $38.9 million in the first week of May. EveryZing, a company in the video search sector, raised $8.3 million, followed by Gist at $6.8 million. All transactions except one (Resonate Networks) were greater than or equal to $5 million. The companies in our universe had mixed stock price performances over the past week (for stocks with prices greater than $1) (Figure 6), with 22 companies showing positive returns on the week. Tree.com (TREE-NASDAQ) led the group with a 27.5% return, while Beyond Commerce, Inc. (BYOC-OTCBB) had the worst return, dropping 21.8% in the week.
This email and any files transmitted with it are privileged, confidential, subject to copyright and intended solely for the use of the individual or entity to whom they are addressed. Views expressed are those of the user and not necessarily this Firm or its subsidiaries. Any unauthorized use, copying, review or disclosure is prohibited. Please notify the sender immediately if you have received this communication in error. Please note that this Firm, nor any of it's employees accept trade instructions via email. If trade instructions are received via email, they will not be acted upon. Thank you for your assistance and co-operation. Member CIPF.
Ce courrier électronique et toutes les pièces jointes transmises sont privés, confidentiels et assujettis aux droits d'auteur et sont conçus pour l'emploi exclusif de l'individu ou de l'entité destinataire. Les opinions exprimées sont celles de l'utilisateur et ne sont pas nécessairement celles de cette firme ou ses filiales. Il est interdit de diffuser, distribuer, réviser ou divulguer ce courrier électronique illégalement. Si ce message vous avez reçu ce communiqué par erreur, veuillez aviser l'expéditeur immédiatement. Veuillez noter que ni cette firme , ni ses employés ne peuvent accepter des instructions de transactions envoyées par courrier électronique. De telles instructions ne seront pas suivies ou exécutées si elles sont reçues par courrier électronique. Nous vous remercions pour votre aide et pour votre coopération. Membre du FCPE.
ES el. komercijos statistiniai duomenys, 2011 m.Saulius Dackys
Pateikiame ES institucijų, renginiui Digital Agenda Assembly 2012, surinktus statistinius duomenis apie bandrą situaciją el. komercijos rinkoje. Juose puikiai matosi kokioje vietoje yra el. komercija Lietuvoje. Džiugu tai, kad turime kur dirbti.
Last week we saw a number of companies in the media and Web 2.0 sector reporting earnings, but none was more surprising than Cyberplex. This company, operating in the ad network space, continued to surprise investors both on the earnings front and capital market activity. In posting approximately 300% growth in revenues Y/Y (see figure below), the company has demonstrated the merit of its business model and has returned to the equity markets for C$15 million to fuel the next phase of its growth.
Month-to-date financings in May totaled $84.3 million and benefited from a financing from Cyberplex for $12.9 million. So far, there have been 14 financings in May with seven deals greater than $5 million and only three less than $5 million. Except for Cyberplex, no deals were greater than $10 million, with the capital raise by Imeem and EveryZing close behind at $8.8 million and $8.3 million, respectively. The companies in our universe had mixed stock price performances over the past week (for stocks with prices greater than $1) (Figure 6), with 24 companies showing positive returns on the week. Ynk Korea, Inc. (A023770-KOSE) led the group with a 30.9% return, while Mixi , Inc. (2121-TSE) had the worst return, dropping 9.2% in the week.
Russian M&A - Cross-Border OpportunitiesAalto Capital
Aalto Capitalilla on ilo kutsua Teidät Venäjä-aiheiseen aamuun. Tilaisuudessa pureudumme Venäjän talouden näkymiin talouskriisin jälkeen ja saamme paikallisen toimijan näkemyksen Venäjän yrityskauppamarkkinasta. Eduskunnan ajankohtaiset terveiset tulee kertomaan kansanedustaja Ilkka Kanerva.
Ravintola Savoy, Salikabinetti
20. toukokuuta 2010 klo 08:30 – 10:30
Several of the largest MMOG companies reported their Q4/08 results over the past week; including Shanda, Netease,
and The9. The MMOG market continued to grow on a sequential basis in Q4.
As Facebook announced its upcoming IPO, lots of interrogations are still pending about the relevance of such an important valorization, whereas the website’s revenues are still border line.
This longed-for IPO is the occasion to come back on the short history of this social network and to understand better the bases on which he is developed.
It’s also the occasion to anticipate the issues which it would facing with, to forecast the areas of growth that would enable it to concretize his current success, and see how this company might be a potential source of benefits.
Web 2.0 Weekly - Aug. 10, 2010: "Consolidation by Google"David Shore
Deals (M&A, Finance) – Consolidation by Google
Google confirmed or announced two acquisitions during the week, including Jambool
($70 mm) involved in virtual goods monetization processes, and widget market, Slide
($182 mm).
In other acquisition-related news, Forbes sold investment media website Investopedia to ValueClick for $42 mm. Zynga acquired Japanese mobile app and game developer,
Unoh, for an estimated $29 mm. Finally, dubbed “the Spanish Facebook,” social
networking site, Tuenti, was acquired by Telefonica in a $99 mm deal.
The largest financing (aside from the aforementioned M&A activity) involved “the
Chinese Youtube,” Tudou, raising $50 mm in Series E funds.
Price Performance
Distinctly negative price momentum, with 49% of stocks falling over the past week (after 48% of stocks declines last week, and 51% declined the week prior).
Web 2.0 Weekly - Aug. 4, 2010: "Playdom is going to Disney World"David Shore
Deals (M&A, Finance) – Disney Gets In To Social/Mobile Video Games
Disney acquired social and mobile game developer, Playdom, for $563 mm in upfront consideration and the potential for $200 mm in further earn-out based consideration. Disney management notes that the company continues to be on the acquisition war path.
The largest deals in the week involved (wait for it…) the advertising sector, with $15 mm in follow-on financings to eXelate and AdMeld, and $8 mm to BuzzLogic.
Four different social network/media companies received financing in the week, including, Hot Potato (acquired for $10 mm by Facebook), PlacePop ($1.4 mm round), Rapportive ($1 mm seed round), and dating site, Triangulate ($0.75 seed round).
Price Performance - Web 2.0 Valuation Reverse Course and Head Upward
The Web 2.0 public company universe was positive this week with 47% of stocks rising, 46% falling, and 7% flat.
Google/Zynga deal drives July financing results: After starting very slowly (just one deal announced in the prior week) July financing increased substantially as a result of the Google/Zynga financing ($100-200 million). Total raised month-to-date is $158.8 million over 12 deals - averaging $13.2 million each. In comparison, total capital raised in July 2009 was $206.5 million, averaging $5.3 million over 39 deals. Excluding Dec 09 and Apr 10, the average monthly total is ~$280 million.
Deals (M&A, Finance)
Google invested a rumoured $100-$200 mm in social game developer, Zynga, bringing that company’s total funding to almost $500 mm (assuming the lower end of the range).
The Gaming sector remains hot – along with Google’s investment in Zynga, The9 Ltd. (Chinese online game developer and operator) invested $5 mm in Delaware-based Aurora Feint (focused on gaming for the mobile space).
A triad of financings in the Social Commerce space this week, including Beyond the Rack ($12 mm), ThredUP ($1.7 mm), and BuyWithMe ($16 mm in a Series B financing).
Sysomos, Canadian social media monitoring firm, was acquired by MarketWire for between $25 mm and $35 mm.
Price performance turns positive
The Web 2.0 public company universe rose this week, with 58% of companies seeing their market cap rise vs. 32% rising and 10% flat.
Summer financing doldrums: After a very strong June (with total transaction value (excluding M&A) of $542.8 million from 66 transactions, averaging $8.4 million each), July has started very slowly with only one small financing announced. However, we have seen some large M&A transactions (see below). In comparison, total capital raised in July 2009 was $206.2 million, averaging $5.4 million over 38 deals. Excluding Dec 09 and Apr 10, the average monthly total is ~$270 million.
Deals (M&A, Finance)
Google, acquired ITA Software, search provider for the travel industry for $700 mm.
infoGROUP, provider of business and consumer databases for sales leads, mailing lists, direct marketing, database marketing, e-mail marketing, and marketing research solutions, was taken private for $645 mm by CCMP Capital Advisers.
GroupSpaces, a provider of web-based tools for sports clubs, university societies, organizations, and groups of friends or coworkers, raised $1.3 mm.
Domain based online advertising services provider, OCTANE360, was acquired by Local.com for $10.9 mm.
Negative price performance
The Web 2.0 public company universe fell again this week, with 61% of companies seeing their market cap fall vs. 27% rising and 12% flat.
June financing well ahead of average: Financing in the Web 2.0 universe in June was the third highest month (over the past 12) with total transaction value (excluding M&A) of $459.6 million from 51 transactions, averaging $9.0 million each - led by the $147 million Zynga financing. In comparison, total capital raised in June 2009 was $226.3 million, averaging $4.5 million over 50 deals. Excluding Dec 09 and Apr 10, the average monthly total is ~$260 million.
Deals (M&A, Finance)
Alloy, a provider of news and commentary concerning New Media, was acquired by ZelnickMedia for $127 mm.
Facebook’s implied valuation rose to $24 bn as Elevation Partners purchased 5 mm shares of the company for $120 mm in the secondary market.
Danish Skype competitor, Vopium, received $16.5 mm in financing from Indian financier, Raghuvinder Kataria.
Social networking software developer based in France, Pearltrees, raised $1.6 mm.
PapayaMobile, mobile application software company based in China, raised $4 mm.
Two Israeli mobile developers received funding this week, including Perfecto Mobile ($4 mm) and Snaptu ($6 mm).
Negative price performance
The Web 2.0 public company universe fell this week, with 68% of companies seeing their market cap fall vs. 25% rising and 7% flat.
Web 2.0 Weekly - May 26, 2010: "Market Declines Impact Web 2.0 Universe Valua...David Shore
May tracking to average monthly levels: After a slow start to the month, financing in the Web 2.0 universe has rebounded and is now on track with prior months. Total transaction value (excluding M&A) in the Web 2.0 universe for May (month-to-date) is $189.9 million from 30 transactions, averaging $6.3 million each. In comparison, total capital raised in May 2009 was $375.0 million, averaging $12.5 million over 30 deals. Excluding May 09, Dec 09 and Apr 10, the average monthly total is $212 million.
Deals (M&A, Finance)
Cyberplex (TSX:CX) announced plans to acquire Tsavo Media for US$75.6 mm, partially funded through a C$30 mm bought deal financing at $0.55.
Online gaming company Gaikai, raised $10.0 mm in Series B financing.
Blip.TV, online TV provider, raised $10.1 mm in Series C financing.
Financial Results/Guidance
Netease.com (NasdaqGS:NTES, online gaming) reported Q1/F10 revenue of RMB 1.2 bn (vs. RMB 781.7 mm in the same period last year).
Snap Interactive (OTCBB:STVI, online dating) reported Q1/F10 revenue growth of 20% to $0.927 mm from $0.768 mm.
Bearish week again: Price performance was largely negative in our Web 2.0 universe. This impacted valuation multiples, which fell for ~80% of the companies in our universe.
Slow start in May after record April: Total transaction value (excluding M&A) in the Web 2.0 universe for April was $813.5 million - the highest monthly total we have recorded. The number of financings was also a record, at 49, averaging $16.6 million each. Note that this includes the $300 million investment in DST by Tencent. Excluding this transaction, the average is $10.7 million. May 2010, in contrast, has started slowly, with only $37.4 million in financing announced thus far, averaging just $3.4 million across 11 deals. In comparison, total capital raised in May 2009 was $375.0 million, averaging $12.5 million over 30 deals.
Deal round-up for May: The large deal highlights for the month include:
Fluid Music (TSX:FMN, digital music distributor) will acquire Mood Media (provider of sensorial marketing solutions) for €160 mm.
Lithium is purchasing analytics developer, Scout Labs, for $20 mm.
Fatfoogoo (purveyor of virtual goods) is being acquired by Digital River for $10 mm.
Groupalia, the Spanish answer to online group discount retailers, Groupon and LivingSocial, raised $2.5 mm in a Series A financing – the online group discounters have been raising money quickly (DST invested $135 mm in Groupon in April) with a total of $222 mm in funding coming to just these three players thus far.
Bearish week again: Price performance was largely negative in our Web 2.0 universe, with prices dropping for over 70% of the companies.
April 2010 a record month for Web 2.0 Financing: Total transaction value (excluding M&A) in the Web 2.0 universe for April was $808.2 million - the highest monthly total we have recorded. The number of financings was also a record, at 48, averaging $16.8 million each. Note that this includes the $300 million investment in DST by Tencent. Excluding this transaction, the average is $9.6 million. In comparison, total capital raised in March was $168.1 million, averaging $5.4 million over 31 deals.
Deal round-up for April: The large deal highlights for the month include:
Tencent invested $300mm in DST (investor in Facebook, Zynga, Groupon).
Apple acquired Siri, a mobile local search developer for a rumoured $225 mm.
DST acquired ICQ, the instant messaging company, for $187.5 mm.
Warner Bros. acquired gaming company, Turbine, for $160 mm.
DST invested $135mm in social-shopping service Groupon.
Salesforce.com acquired crowd-sourced personal contact service, Jigsaw, for $142 mm.
Ankeena Networks, media infrastructure solution provider was acquired by Juniper for $100mm.
Bearish week: Price performance was largely negative in our Web 2.0 universe, with prices dropping for over 60% of the companies.
10 01 05 Web 2.0 Weekly Special EditionDavid Shore
TOP FIVE DEALS OF 2009
The Top Five: Despite over 400 transactions in 2009, it wasn’t hard choosing our Top Five transactions for 2009 (with a little bit of massaging). Our Top Five transactions are: Facebook’s $200 million D round, Twitter’s $100 million E round, the $2.25 billion acquisition of Skype, the almost $1 billion in financing/M&A for Social Gaming companies (including Zynga, Playdom and Playfish), and the incredible per unique visitor value ascribed in the financing for location-based social networking company Gowalla.
• Facebook raises $200 million D round: In May 2009, Facebook announced a new financing round – raising $200 million from Digital Sky Technologies. The transaction gave Digital Sky a 1.96% stake, valuing Facebook at $10 billion. This financing brought the company’s total to $678.2 million. This was also the largest financing we recorded in 2009.
• Twitter raises $100 million E round: The third largest financing round in 2009 belonged to Twitter – a $100 million Series E in September 2009. The financing reportedly valued Twitter at $1 billion – a remarkable valuation for a company that has not yet formalized a revenue model! More recently, it has been reported that Twitter was actually profitable in 2009 due to the $25 million in search deals it signed in October with Google and Microsoft.
• Skype is acquired for $2.025 billion: By far the largest overall transaction in our database in 2009 was the acquisition of a majority position (65%) in Skype from eBay for $2.025 billion – announced in September 2009. The transaction was completed in November 2009. eBay had purchased Skype for $4.0 billion in 2005.
• Social Gaming financing activity reaches ~$1 billion (Zynga, Playfish, Playdom, etc.): Perhaps the hottest sector overall in 2009 was Social Gaming. This segment of the Web 2.0 market had the third highest number of deals (39) and generated almost $1 billion in financing/M&A activity – the second highest total overall (Figure 1). Three transactions in particular stand out in the social gaming space – the $400 million acquisition of Playfish (by Electronic Arts, November 2009), the $180 million financing of Zynga (Series C, December 2009, by Digital Sky), and the $43 million first round of financing for Playdom (New Enterprise lead, November 2009, Series A). There has been much speculation as to how the larger social gaming companies will proceed, with potential IPO or further strategic M&A most likely.
• Hottest new sector? Location-based social networks (Foursquare, Gowalla, etc.). Unique visitor value skyrockets: Financing activity for location-based social networks really heated up late in 2009. While the total financing raised in 2009 was quite small (~$15 million), the hype surrounding location-based SNS companies was substantial. In our opinion, this was highlighted by the $8.4 million December Series B financing for Gowalla. The reported valuation of $28.4 million implies a value of $568 for each of its 50,000 users (Figure 2). That compares to a $40 per user value we estimate for the Foursquare financing in September.
how to sell pi coins in South Korea profitably.DOT TECH
Yes. You can sell your pi network coins in South Korea or any other country, by finding a verified pi merchant
What is a verified pi merchant?
Since pi network is not launched yet on any exchange, the only way you can sell pi coins is by selling to a verified pi merchant, and this is because pi network is not launched yet on any exchange and no pre-sale or ico offerings Is done on pi.
Since there is no pre-sale, the only way exchanges can get pi is by buying from miners. So a pi merchant facilitates these transactions by acting as a bridge for both transactions.
How can i find a pi vendor/merchant?
Well for those who haven't traded with a pi merchant or who don't already have one. I will leave the telegram id of my personal pi merchant who i trade pi with.
Tele gram: @Pi_vendor_247
#pi #sell #nigeria #pinetwork #picoins #sellpi #Nigerian #tradepi #pinetworkcoins #sellmypi
How to get verified on Coinbase Account?_.docxBuy bitget
t's important to note that buying verified Coinbase accounts is not recommended and may violate Coinbase's terms of service. Instead of searching to "buy verified Coinbase accounts," follow the proper steps to verify your own account to ensure compliance and security.
Yes of course, you can easily start mining pi network coin today and sell to legit pi vendors in the United States.
Here the telegram contact of my personal vendor.
@Pi_vendor_247
#pi network #pi coins #legit #passive income
#US
2. Elemental Economics - Mineral demand.pdfNeal Brewster
After this second you should be able to: Explain the main determinants of demand for any mineral product, and their relative importance; recognise and explain how demand for any product is likely to change with economic activity; recognise and explain the roles of technology and relative prices in influencing demand; be able to explain the differences between the rates of growth of demand for different products.
how can I sell pi coins after successfully completing KYCDOT TECH
Pi coins is not launched yet in any exchange 💱 this means it's not swappable, the current pi displaying on coin market cap is the iou version of pi. And you can learn all about that on my previous post.
RIGHT NOW THE ONLY WAY you can sell pi coins is through verified pi merchants. A pi merchant is someone who buys pi coins and resell them to exchanges and crypto whales. Looking forward to hold massive quantities of pi coins before the mainnet launch.
This is because pi network is not doing any pre-sale or ico offerings, the only way to get my coins is from buying from miners. So a merchant facilitates the transactions between the miners and these exchanges holding pi.
I and my friends has sold more than 6000 pi coins successfully with this method. I will be happy to share the contact of my personal pi merchant. The one i trade with, if you have your own merchant you can trade with them. For those who are new.
Message: @Pi_vendor_247 on telegram.
I wouldn't advise you selling all percentage of the pi coins. Leave at least a before so its a win win during open mainnet. Have a nice day pioneers ♥️
#kyc #mainnet #picoins #pi #sellpi #piwallet
#pinetwork
Seminar: Gender Board Diversity through Ownership NetworksGRAPE
Seminar on gender diversity spillovers through ownership networks at FAME|GRAPE. Presenting novel research. Studies in economics and management using econometrics methods.
What price will pi network be listed on exchangesDOT TECH
The rate at which pi will be listed is practically unknown. But due to speculations surrounding it the predicted rate is tends to be from 30$ — 50$.
So if you are interested in selling your pi network coins at a high rate tho. Or you can't wait till the mainnet launch in 2026. You can easily trade your pi coins with a merchant.
A merchant is someone who buys pi coins from miners and resell them to Investors looking forward to hold massive quantities till mainnet launch.
I will leave the telegram contact of my personal pi vendor to trade with.
@Pi_vendor_247
1. SOFTWARE & SERVICES 31 MARCH 2009
DAVID SHORE, CFA, MBA 416.860.6784
WEB 2.O WEEKLY david.shore@researchcapital.com
Arun Thomas (Associate) 416.860.7666
FINANCING REBO UND IN Q1
F IR ST Q UA RT E R CL O S E S B ET T E R T HA N P R E VI OU S QU A RT ER
The first quarter of 2009 finished with 77 financings totalling $521 million, up 54% Q/Q (Q4/08 at $338.5 million) and
down 44% Y/Y (Q1/08 at $748.2 million). March was the weakest month in the first quarter at $118.7 million, with
January and February closing at $216.8 million and $185.5 million, respectively. Does this rise in quarterly rise over
Q4/F08 portend what 2009 will look like? W e will be keeping track and discussing trends in our upcoming reports.
Sectors that attracted the most amount of capital in the first quarter are Video ($121 million) and social networking
($60 million), with gaming not far behind at $43 million. W e wonder if the interest in the video sector is a leading
indicator of where the next big innovation is located or companies’ looking to capitalize on the massive traffic online
video is driving?
Among individual companies, Twitter leads the pack in the quarter, raising $35 million, with Synthasite taking the
runners-up at $20 million.
Financing by Month
800.0 35
720.8
700.0
30
649.9
600.0
25
500.0
461.7
20
(US$mm)
(#)
400.0
360.5
15
318.7
304.3
300.0
244.0
216.8 10
192.6 185.5
200.0
142.0
132.3
122.8 114.6 118.7
111.0
101.1
99.0 5
82.6
82.5
100.0
69.5
68.8 69.0 69.0
56.3
40.5 48.7 42.0 38.0
40.9
38.8 38.8 38.6 38.6
24.4 22.0
21.4 21.2 18.8
16.5
15.4
12.5 12.2
8.0
0.0 0
5
6
6
7
7
8
8
05
06
6
06
07
7
07
08
8
08
09
9
5
6
7
8
-0
-0
-0
-0
-0
-0
-0
-0
-0
-0
-0
l-0
l-0
l-0
l-0
p-
n-
p-
n-
p-
n-
p-
n-
ov
ay
ov
ay
ov
ay
ov
ar
ar
ar
ar
Ju
Ju
Ju
Ju
Se
Ja
Se
Ja
Se
Ja
Se
Ja
M
M
M
M
N
M
N
M
N
M
N
This report has been created b y Anal ysts that are emplo yed b y Research Capital Corporation, a Canadian Investment Dealer.
For further disclosures, please see last page of this report.
w w w . r e s e a rc h c a p i t a l . c o m
T o ro n t o 4 1 6 . 8 6 0 . 7 6 0 0 Montreal 514.399.1500 Vancouver 604.662.1800 Calgary 403.265.7400 Regina 306.566.7550
2. Page 2
THE WEB 2.0 UNIVERSE
Ninety public Web 2.0 companies identified: Our W eb 2.0 universe contains 90 companies, with a combined market cap
of $34.8 billion. These include a wide variety of companies, including MMOG (Massive Multi-Player Online Gaming)
companies, social networking software companies, media sharing companies, and social lending companies. See below
for a summary of the full universe (Figure 1). The average market cap for the group is ~$386 million (but a median of only
$31 million), with average trailing revenue of $138.6 million (median $48 million). The companies are also generally
profitable, with a median EBITDA margin of 16.4%. On a valuation basis, the overall average is 4.7x trailing revenue
(median 1.3x) and 8.9x trailing EBITDA (median 6.6x). Twelve of the companies have more than 500 employees.
C omparable C o mpany A nalys is > W eb 2.0
Trading Current U S D Market U S D LT M To tal US D L TM T otal E B ITDA TE V/LT M T E V/LT M
C om pany Nam e L TM as of T ic ker E xc hang e Curr enc y H Q P ric e C ap ($m) R ev ($m) E B ITDA ($m) % R evenu e E B IT DA E mployees
Acce le rize New Me dia, Inc. 9 /30 /200 8 AC LZ OT C B B US D U nited S ta tes 0 .35 9 .4 3.2 (4 .7) NM 4.3 x - 20
Actoz S oft C o., L td. 9 /30 /200 8 A0 527 90 K OS E KR W S outh K orea 11, 150 7 1.1 52. 9 9 .7 18 .3% 0.9 x 4.7x NA
AQ Inte ractive , Inc. 1 2/31 /200 8 38 38 TSE J PY J apan 40 ,000 .00 2 2.4 62. 1 5 .0 8 .0% - - NA
As s ocia ted Media H oldings Inc. 6 /30 /200 7 AS MH OT C P K US D U nited S ta tes 0 0 .1 0.1 (2 .3) NM 8.0 x - 3
B igstring Corp. 9 /30 /200 8 BS GC OT C B B US D U nited S ta tes 0 .02 0 .8 0.1 (2 .1) NM 29.8 x - 8
B e tawave Corpora tion 9 /30 /200 8 B W AV OT C B B US D U nited S ta tes 0 4 .4 6.3 (1 1.0) NM 2.4 x - 41
B e yond Commerce, Inc. 9 /30 /200 8 B Y OC OT C B B US D U nited S ta tes 0 .51 2 0.9 1.1 (7 .7) NM 21.8 x - 25
B right T hings plc 9 /30 /200 8 AIM:B G T AIM GBP U nited K ingdom 0 2 .5 0.2 (1 .6) NM 10.5 x - 9
B roa dW ebAs ia Inc. 9 /30 /200 8 BW BA OT C P K US D U nited S ta tes 0 .51 4 3.3 0.0 (4 .6) NM - - 46
C DC C orp. 9 /30 /200 8 C HIN.A N as da qG S US D H ong K ong 1 11 6.5 428 .1 1 8.8 4 .4% 0.4 x 9.2x 3 ,12 5
C hina G ate wa y C orpora tion 9 /30 /200 8 C GW Y OT C B B US D U nited S ta tes 0 .00 0 .0 6.7 (6 .6) -9 8.9% 0.0 x - 37
C hine s e G amer International 9 /30 /200 8 G T S M:308 3 GTSM TWD T aiwan 171 42 5.9 37. 8 1 7.8 47 .1% 9.8 x 2 0.8 x NA
C ornerW orld C orporation 1 /31 /200 9 C WR L OT C B B US D U nited S ta tes 0 .14 6 .6 1.3 NM NM 6.1 x - NA
D ADA S pA 9 /30 /200 8 C M:D A CM E UR Ita ly 5 10 1.2 223 .0 3 5.6 16 .0% 0.6 x 4.1x 574
D XN Holdings B hd 1 1/30 /200 8 D XN KL SE MY R Ma la ys ia 0 .30 1 8.8 76. 0 1 0.1 13 .3% 0.5 x 3.8x NA
D ibz Inte rnational, Inc. NA D IB Z OT C P K US D U nited S ta tes 0 0 .0 NA NM NM - - NA
D igitalP ost Inte ra ctive , Inc. 9 /30 /200 8 D G LP OT C B B US D U nited S ta tes 0 .01 0 .7 0.4 (3 .3) NM 3.9 x - 11
D igitalT own, Inc. 1 1/30 /200 8 DGT W OT C B B US D U nited S ta tes 3 6 7.9 NM (2 .5) NM - - 3
D olphin Digital Me dia, Inc. NA D P DM OT C B B US D U nited S ta tes 0 .59 2 8.7 NA NM NM 1.0 x - 6
E olith C o. L td. 1 2/31 /200 7 A0 410 60 K OS E KR W S outh K orea 515 1 7.4 18. 1 (0 .0) -0 .3% - - NA
E xte ns ions , Inc. 9 /30 /200 8 E XT I OT C P K US D U nited S ta tes 0 .15 1 4.2 NM NM NM - - 2
F inancia l Media G roup, Inc. 1 1/30 /200 8 F NG P OT C B B US D U nited S ta tes 0 0 .5 6.8 1 .2 18 .3% 0.7 x - 22
F luid Mus ic Ca nada, Inc. 9 /30 /200 8 T S X:F MN TSX C AD U nited S ta tes 0 .40 1 6.7 4.2 (8 .6) NM 3.8 x - 29
F rogs te r Interactive P icture s AG 6 /30 /200 8 F RG XT R A E UR G ermany 7 2 0.4 5.3 (3 .2) -6 0.6% 1.1 x 6.5x NA
G a ma nia D igital E ntertainment C o., L td. 9 /30 /200 8 61 80 GTSM TWD T aiwan 32 .60 14 5.5 109 .3 1 8.5 16 .9% 0.5 x 1.8x NA
G a me On C o L td. 1 2/31 /200 8 38 12 TSE J PY J apan 93, 600 9 3.2 76. 8 1 9.9 25 .9% 3.6 x - NA
G e oS e ntric O yj 9 /30 /200 8 G E O1 V H LS E E UR F inland 0 .03 2 4.6 5.4 (1 2.4) NM - - 92
G iant Intera ctive G roup, Inc. 1 2/31 /200 8 GA NYS E US D C hina 7 1,5 43.6 233 .2 14 4.4 61 .9% 1.3 x 5.3x NA
G iga Media Ltd. 9 /30 /200 8 G IG M N as da qG S US D T aiwan 5 .91 31 9.3 200 .5 4 8.0 23 .9% - - 975
G ravity C o., L td 9 /30 /200 8 GR VY N as da qG M US D S outh K orea 1 1 9.2 35. 4 6 .8 19 .2% 40.4 x - 636
G ree, Inc. 6 /30 /200 8 T S E : 363 2 TSE J PY J apan 5 ,600 .00 1,2 86.4 30. 3 1 0.9 36 .0% 1.2 x 6.7x NA
G ungH o O nline E ntertainment, Inc. 1 2/31 /200 8 37 65 OS E J PY J apan 1 35, 300 15 9.6 115 .8 2 0.7 17 .8% 0.7 x - NA
H anbitS of t, Inc. 1 2/31 /200 8 A0 470 80 K OS E KR W S outh K orea 3 ,210 .00 5 0.9 50. 3 (1 4.2) -2 8.2% 0.3 x 6.1x NA
IAC /InterActiveC orp. 1 2/31 /200 8 IAC I N as da qG S US D U nited S ta tes 15 2,1 48.0 1 ,44 5.1 6 4.6 4 .5% - - 3 ,20 0
IAS E nergy, Inc. 1 /31 /200 9 IAS C.A OT C B B US D C ana da 0 .05 3 .2 0.0 (0 .8) NM - - NA
IdeaE dge, Inc. 1 2/31 /200 8 OT C B B :IDAE OT C B B US D U nited S ta tes 0 1 4.8 0.0 (4 .6) NM 1.8 x - NA
is ee media Inc. 1 2/31 /200 8 IE E T S XV C AD C ana da 0 .09 3 .7 1.2 (4 .7) NM 1.0 x 2.8x NA
J umbuck E ntertainment P ty Ltd. 1 2/31 /200 8 AS X:J MB AS X AU D Aus tra lia 1 1 6.9 12. 2 4 .5 37 .2% 5.3 x - 72
J umpT V Inc. 6 /30 /200 8 T S X:J T V TSX C AD C ana da 0 .54 4 8.9 11. 5 (1 .8) -1 5.3% 0.9 x 1 1.5 x NA
K a boos e Inc. 9 /30 /200 8 T S X:K AB TSX C AD C ana da 0 4 4.6 59. 1 4 .5 7 .6% 3.5 x 1 0.3 x NA
K ings oft Co. Ltd. 9 /30 /200 8 38 88 S E HK HKD C hina 3 .25 45 0.3 106 .8 3 6.1 33 .8% 2.4 x - 1 ,66 0
Lingo Media Corporation 9 /30 /200 8 T S XV : LM T S XV C AD C ana da 1 7 .2 3.2 (1 .4) -4 2.5% 0.3 x - NA
Live World Inc. 9 /30 /200 8 LV WD OT C P K US D U nited S ta tes 0 .13 4 .0 11. 7 (1 .2) -1 0.1% - - 73
LookS mart, Ltd. 1 2/31 /200 8 LOOK N as da qG M US D U nited S ta tes 1 1 7.2 65. 0 (2 .0) -3 .1% - - NA
Magnitude Information S ys tems Inc. 9 /30 /200 8 MA G Y OT C B B US D U nited S ta tes 0 .02 8 .3 0.1 (3 .2) NM 4.1 x 1 0.7 x 13
Mixi, Inc. 1 2/31 /200 8 21 21 TSE J PY J apan 3 78, 000 59 7.5 120 .8 4 5.9 38 .0% 1.0 x 6.2x NA
Mode rn Times G roup Mtg AB 1 2/31 /200 8 MT G B OM S EK S weden 135 .25 1,0 68.9 1 ,57 9.2 25 2.5 16 .0% - - NA
Moggle , Inc 1 2/31 /200 8 MMOG OT C B B US D U nited S ta tes 2 8 3.5 NM (1 .1) NM 4.5 x - 3
MOK O.mobi L imited 1 2/31 /200 8 MK B AS X AU D Aus tra lia 0 .09 5 .4 1.0 (2 .0) NM 2.4 x 8.8x NA
N E OW IZ G ames C orpora tion 1 2/31 /200 7 A0 956 60 K OS E KR W S outh K orea 45, 400 31 5.9 130 .4 3 5.1 26 .9% 1.5 x 3.3x NA
N etD ragon W ebS oft, Inc. 1 2/31 /200 8 77 7 S E HK HKD C hina 4 .09 27 8.9 87. 2 3 9.9 45 .7% - - NA
N ete as e.com I nc. 1 2/31 /200 8 NT ES N as da qG S US D C hina 25 3,1 12.0 451 .1 29 3.3 65 .0% - - NA
N eXplore Corpora tion 9 /30 /200 7 N XP C OT C P K US D U nited S ta tes 0 .60 3 3.5 NM (4 .9) NM - - 19
N gi G roup Inc. 1 2/31 /200 8 24 97 TSE J PY J apan 24, 300 3 0.9 101 .3 3 1.2 30 .8% 0.2 x 0.9x NA
N orthgate Te chnologies L imited 1 2/31 /200 8 59 005 7 BS E INR India 31 .30 2 1.3 131 .8 2 3.2 17 .6% 2.5 x 9.8x 286
Open T e xt Corp. 1 2/31 /200 8 OT E X N as da qG S US D C ana da 34 1,7 71.3 769 .3 19 5.0 25 .3% - - 3 ,40 0
Openwave S ys tems Inc. 1 2/31 /200 8 OP W V N as da qG S US D U nited S ta tes 0 .90 7 5.0 199 .6 (1 0.2) -5 .1% - - 627
P e rf ect W orld C o., Ltd. 1 2/31 /200 8 PW R D N as da qG S US D C hina 14 71 6.4 210 .2 11 3.7 54 .1% 2.6 x - NA
P hotoChannel N etwork s Inc. 1 2/31 /200 8 T S XV : P N T S XV C AD C ana da 1 .60 4 2.7 15. 9 (0 .8) -4 .9% - - NA
Quepa s a C orp. 9 /30 /200 8 QP S A N as da qC M US D U nited S ta tes 1 1 2.2 0.1 (1 1.8) NM 0.0 x 0.1x 63
OA O R B C Information S ys tems 1 2/31 /200 7 R BC I R TS US D R us s ia 0 .38 5 2.7 139 .3 1 8.2 13 .1% - - NA
S handa Interactive E ntertainme nt L td. 1 2/31 /200 8 S N DA N as da qG S US D C hina 37 2,5 54.0 522 .0 23 9.9 46 .0% 0.7 x 5.2x NA
S hutte rf ly, Inc. 1 2/31 /200 8 S F LY N as da qG S US D U nited S ta tes 9 .34 23 4.9 213 .5 2 8.4 13 .3% 1.4 x 1 5.4 x 514
S K C ommunications Co., Ltd. 1 2/31 /200 7 A0 662 70 K OS E KR W S outh K orea 7, 300 21 7.2 150 .0 1 4.1 9 .4% 3.3 x 3 2.5 x NA
S N AP Inte ra ctive , Inc. 9 /30 /200 8 S T VI OT C B B US D U nited S ta tes 0 .80 8 .6 2.3 0 .2 10 .1% 1.1 x - 5
S N M G lobal H oldings 9 /30 /200 8 S N MN OT C P K US D U nited S ta tes 0 0 .0 2.0 (0 .7) -3 4.8% 0.1 x - 33
S ocia l Media V e nures , Inc. 1 2/31 /200 8 S MV I OT C P K US D U nited S ta tes 1 .20 0 .0 0.1 (0 .1) -6 0.5% 2.8 x 6.8x NA
S ohu. com Inc. 1 2/31 /200 8 S OH U N as da qG S US D C hina 40 1,5 28.4 429 .1 18 0.5 42 .1% - - 3 ,19 7
S ite s earch C orporation 1 /31 /200 9 S T PC OT C B B US D U nited S ta tes 3 .50 2 8.2 NM (1 .1) NM 0.8 x 3.9x 15
S park N etworks , Inc. 1 2/31 /200 8 LOV AME X US D U nited S ta tes 2 4 7.3 57. 3 1 2.3 21 .5% - - NA
S pectrumDN A, Inc. 9 /30 /200 8 S P XA OT C B B US D U nited S ta tes 0 .19 9 .2 0.1 (2 .7) NM 13.7 x 2 7.8 x 7
T encent Holdings L td. 1 2/31 /200 8 70 0 S E HK HKD C hina 58 13,3 41. 9 1 ,04 6.4 51 7.5 49 .5% 0.2 x - 6 ,19 4
T he P arent C ompany 8/2/2008 K ID S .Q OT C P K US D U nited S ta tes 0 .05 1 .3 112 .0 (1 3.5) -1 2.0% - - 347
T he 9 L imited 1 2/31 /200 8 N CT Y N as da qG S US D C hina 12 33 1.7 249 .8 8 4.1 33 .7% - - NA
T he S treet.com, Inc. 1 2/31 /200 8 TSCM N as da qG M US D U nited S ta tes 1 .99 6 0.7 71. 9 7 .0 9 .7% 4.6 x - 310
T otal S port Online A S 3 /31 /200 6 T OS O OT C NO NOK N orwa y 0 0 .2 2.0 (1 .0) -5 0.6% 0.2 x - 16
T ree.C om, Inc. 1 2/31 /200 8 TR EE N as da qG M US D U nited S ta tes 4 .47 4 4.6 228 .6 (2 3.9) -1 0.4% 0.1 x 2 9.5 x 700
U nis erve C ommunications Corp. 1 1/30 /200 8 T S XV : US S T S XV C AD C ana da 0 0 .8 23. 8 0 .1 0 .4% 1.0 x 4.3x NA
U nited Online Inc. 1 2/31 /200 8 U NT D N as da qG S US D U nited S ta tes 4 .35 35 7.3 669 .4 15 3.9 23 .0% 18.1 x - 1 ,46 9
U OMO Media , Inc 1 /31 /200 9 U OMO OT C B B US D C ana da 0 1 1.1 0.6 (0 .5) -7 8.2% 44.0 x - NA
V O IS , Inc. 1 2/31 /200 8 V OIS OT C B B US D U nited S ta tes 0 .12 1 .0 0.0 (1 .3) NM - - 4
W ebze n Inc. 1 2/31 /200 8 W ZE N N as da qG M US D S outh K orea 2 2 0.7 20. 6 (2 .1) -1 0.1% 3.1 x - 330
W iz za rd S of twa re Corpora tion 9 /30 /200 8 W ZE AME X US D U nited S ta tes 0 .43 1 9.4 6.2 (6 .5) NM - - 110
W oozyF ly, Inc. 9 /30 /200 8 W ZY F OT C B B US D U nited S ta tes 0 2 .6 0.0 NM NM - - 14
W orlds .com Inc. 9 /30 /200 8 W DDD OT C B B US D U nited S ta tes 0 .18 9 .4 0.1 NM NM - - 1
W ynds torm C orporation NA W Y ND OT C B B US D U nited S ta tes 0 2 .2 NA NM NM 3.1 x 9.6x NA
XIN G AG 1 2/31 /200 8 O1B C XT R A E UR G ermany 28 .80 19 7.1 45. 9 1 4.7 32 .0% 1.9 x 8.5x NA
Y e dangOnline Corp. 1 2/31 /200 7 A0 527 70 K OS E KR W S outh K orea 8, 400 9 5.1 49. 6 1 1.1 22 .4% 0.5 x - NA
Y nk K orea Inc. 1 2/31 /200 7 A0 237 70 K OS E KR W S outh K orea 3 ,780 .00 6 .7 14. 1 (1 .1) -7 .6% 0.8 x - NA
ZipLocal Inc. 1 2/31 /200 8 T S XV : ZIP T S XV C AD C ana da 0 1 .0 2.6 (2 .8) NM - - NA
H igh 13,3 41. 9 1 ,579 .2 51 7.5 65 .0% 44.0 x 3 2.5 x 6 ,194
Low 0 .0 0.0 -23.9 -9 8.9% - - 1
A vera ge 386.3 138.6 31.3 8.9% 4.7x 8.9x 603
Median 3 0.9 47. 8 0 .2 16 .4% 1.3 x 6.6x 83
Figure 1. Web 2.0 Universe Summary
Source. Capital IQ
C A P I T A L M A R K E T S A C T I V I T Y (M & A A N D F I N A N C I N G )
March activity slows below busy February: In the month of March there were 19 financings announced (total $118.7
million, average $6.1 million) compared to 25 financings announced in February, totalling $185.5 million, or $7.4 million on
3. Page 3
average (Figure 2). The average value for February was above the $6.8 million average for January, with four financings
over $15 million in February (Twitter, Synthasite, Tremor Media, and Offerpal Media) vs. no deals over $15 million in
January. There was only one $15 million deal in March – Vidyo.
Financing Activity Last Three Months
250.0 25.0
200.0 20.0
150.0 15.0
(US$m)
(US$m)
100.0 10.0
50.0 5.0
0.0 0.0
Jan-09 Feb-09 Mar-09
Total Average
Figure 2. Financings, Last Three Months
Source. Company reports
Vidyo largest deal in March: The largest deal in March was the $15 million Series D round for Vidyo (Figure 3). For
additional details, see Figures 30 and 31 (at end of note).
4. (US$m)
0.0
5.0
10.0
15.0
20.0
25.0
30.0
35.0
40.0
Twitter
Synthasite
Tremor Media
Aster Data Systems
Source. Company reports
Vidyo
Offerpal Media
Imagini
Yodle
Buzznet
Emergent Game
AdMob
LendingClub
SendMe Inc.
Outbrain
Miva
Figure 3. Capital Market Activity, Last Three Months
VirtuOz
Auditude
Visible Measures
companies raising $60.5 million.
SuperSecret
RatePoint
Nurien
DECA
Go Internet Media
IMVU
NewsGator
One True Media
Tvtrip
GoViral
Play Hard Sports
SundaySky
JibJab
Xobni
InsideView
Kewego
Tongxue
Motionbox
SocialMedia
Fliqz
Oodle
Greystripe
Wamba
OMGPOP
Geni
Gbox
Sportsblogs
AboutUs
TextDigger
OneSpot
Apture
FetchDog
Simulmedia
Virtual Fairground
Mixpo
Tynt
E-Global Sports Network
AnySource Media
Pixazza
Financing Summary - Last Three Months
7 Billion People
FamilyLink.com
Tripwolf
mEgo
WhistleBox
Mendeley
Sports Composite DE
Outright
Hunch
Tvinci
Filtrbox
MMO Life
AdultSpace
Cake Financial
Myngle
Hubdub
Snooth
CoveritLive
33Across
fav.or.it
Three Melons
TweetDeck
BackType
Identi.ca
Meez
Pulse Entertainment
Jan-09
Mar-09
Feb-09
Page 4
16 companies raising over $120 million (Figure 4). Social networking companies have the next highest totals, with 11
Video continues to be the most active sector: Activity over the last three months was busiest in the video sector, with
5. Page 5
Capital Market Activity by Sector - Last Three Months
140.0
120.0
100.0
80.0
(US$m)
121.1
60.0
40.0
60.5
42.9 42.3
20.0 35.8
26.5 25.0 22.5 20.9 19.5 15.6 15.0 12.4 12.0 12.0 11.5 11.4 10.0 6.2 5.5 4.3 4.1 3.2 3.1 2.0 1.3
0.0
Comment/Reputation
Gaming
Micromedia
Visual Commerce
Wiki
Travel
RSS
Microblog
Media
Mobile
Publishing
Online Learning
Financial Services
Infrastructure
Lending
Blog
Mobile Ad
Search
Social Networks
Virtual Goods
Video
Virtual World
Aggregation
Crowdsourced
Ad Network
Analytics
Content
# companies
16 11 8 5 3 4 2 4 2 3 2 1 3 1 1 2 1 1 3 1 1 1 2 1 1 1
Figure 4. Capital Market Activity, by Sector, Last Three Months
Source. Company reports
Average round size decreases: On a trailing 12-month basis, total financing dollars fell as of March 2009, with average
round sizes decreasing slightly. (Figure 5).
LTM Financing
4,000.0 18.0
16.0
3,500.0
14.0
3,000.0
12.0
2,500.0
10.0
(US$m)
(US$m)
2,000.0
8.0
1,500.0
6.0
1,000.0
4.0
500.0
2.0
0.0 0.0
May-06
May-07
May-08
Nov-05
Mar-06
Nov-06
Mar-07
Nov-07
Mar-08
Nov-08
Mar-09
Jul-05
Sep-05
Jan-06
Jul-06
Sep-06
Jan-07
Jul-07
Sep-07
Jan-08
Jul-08
Sep-08
Jan-09
Total Average
Figure 5. Financings, Last 12 Months
Source. Company reports
6. Page 6
Cumulative total nears $5.8 billion: Overall, on a cumulative basis, W eb 2.0 financings have totalled nearly $5.8 billion,
with the majority of the financing coming in late 2007 and the first three quarters of 2008 (Figure 6).Financing for the first
quarter of 2009 passed that raised in the fourth quarter of 2008 – reversing the downtrend since the second quarter last
year. However, for the period ended Q1-C2009, total capital raised was below Q1-C2008 level (at $748.2 million).
Web 2.0 Financing (cumulative)
1,400.0 7,000.0
1,314.8
1,200.0 6,000.0
963.4
1,000.0 5,000.0
800.0 4,000.0
748.2
(US$m)
(US$m)
600.0 3,000.0
528.9 521.0
400.0 2,000.0
338.5
330.1
151.7 159.3
200.0 1,000.0
126.4 135.6 129.5
87.2 84.0
37.5 33.5 18.2 41.9 57.8
38.8 20.1
0.0 0.0
Qtr1 Qtr2 Qtr3 Qtr4 Qtr1 Qtr2 Qtr3 Qtr4 Qtr1 Qtr2 Qtr3 Qtr4 Qtr1 Qtr2 Qtr3 Qtr4 Qtr1 Qtr2 Qtr3 Qtr4 Qtr1
2004 2005 2006 2007 2008 2009
Figure 6. Financing, Cumulative
Source. Company reports
U.S. remains dominant: U.S. companies continue to dominate capital market activity – with almost 67.5% of
financings/M&A involving U.S. companies (based on dollars) (Figure 7). Based on number of transactions, the U.S. leads
with 73.1% of deals, while Canada is third in number of financings at 4.7% (Figure 8).
Financing/M&A by Country - LTM (#)
Financing/M&A by Country - LTM ($)
China
Canada
UK
Israel
16.0%
4.7%
5.6%
3.4%
Russia France
4.1%
2.6%
UK
Israel
2.4%
1.9%
ROW
France
10.7%
1.6%
Denmark
1.6%
ROW
5.0%
USA
73.1%
USA
67.5%
7. Page 7
Figures 7 & 8. Financing/M&A, by Country (LTM, $, #)
Source. Company reports
Larger volume of early-stage funding (by count): Almost half of financings in the last 12 months are for early-stage
companies (Angel/Seed or Series A) (Figure 9). Series B rounds are 29.2% of the total, with later-stage (Series D, E and
PIPE) deals accounting for just 9.2%.
Financing by Type - LTM
Series C
15.2%
Series B
29.2%
Series D
4.4%
Angel/Seed
11.2%
Debt financing
Series A 2.8%
35.2%
PIPE
2.0%
Figure 9 Financing, by Type (LTM, #)
Source. Company reports
Equity financings smaller over last 12 months: In the last 12 months, the average size of Series A, B, C and D rounds
have all been lower than the overall average (Figure 10).
8. Page 8
Average financing round size
40.0
36.1
35.0
33.5
31.6
30.0
27.4
25.0
22.7
(US$m)
20.0
17.5
15.0
11.4 11.7 11.3 11.3
10.0
7.9
7.3
6.3
5.4
5.0
3.3
2.4
0.0
Angel/Seed Debt financing PIPE Series A Series B Series C Series D Series E
LTM Average Size Overall Average
Figure 10. Average Size per Round
Source. Company reports
C A P I T A L M A R K E T S A C T I V I T Y (P R I C E P E R F O R M A N C E )
Price Performance: Our W eb 2.0 index (market-cap weighted) underperformed the NASDAQ composite index from mid
2008 until recently when it has moved sharply higher than the NASDAQ index (Figure 11).