SlideShare a Scribd company logo
Charts for LPS Press Release: LPS Releases Study That Demonstrates Impact of Foreclosure Sales
on Home Prices – August 2009

                                                 Alabama

                    30,000                                                                   18.0%
                                                        Residential S ales                   16.0%
                    25,000
                                                        S hare o f REO S ales                14.0%
                    20,000                                                                   12.0%
                                                                                             10.0%
                    15,000
                                                                                             8.0%
                    10,000                                                                   6.0%
                                                                                             4.0%
                     5,000
                                                                                             2.0%
                         0                                                                   0.0%

                             2004   2005      2006       2007        2008       Jan - June
                                                                                  2009

                                           LP S, Applied Analytics


                                                 Arkansas

                    14,000                                                                   25.0%
                                                        Residential S ales
                    12,000
                                                                                             20.0%
                                                        S hare o f REO S ales
                    10,000

                     8,000                                                                   15.0%

                     6,000                                                                   10.0%
                     4,000
                                                                                             5.0%
                     2,000

                         0                                                                   0.0%

                             2004   2005      2006       2007        2008       Jan - June
                                                                                  2009

                                           LP S, Applied Analytics
Arizona

250,000                                                                   60.0%
                                     Residential S ales
                                                                          50.0%
200,000
                                     S hare o f REO S ales
                                                                          40.0%
150,000
                                                                          30.0%
100,000
                                                                          20.0%

 50,000
                                                                          10.0%

      0                                                                   0.0%

          2004   2005       2006      2007        2008       Jan - June
                                                               2009

                        LP S, Applied Analytics


                            California

800,000                                                                   60.0%
700,000                              Residential S ales
                                                                          50.0%
600,000                              S hare o f REO S ales
                                                                          40.0%
500,000
400,000                                                                   30.0%
300,000
                                                                          20.0%
200,000
                                                                          10.0%
100,000
      0                                                                   0.0%

          2004   2005       2006      2007        2008       Jan - June
                                                               2009

                        LP S, Applied Analytics
District of Columbia

8,000                                                                    20.0%
7,000                               Residential S ales

6,000                               S hare o f REO S ales                15.0%
5,000
4,000                                                                    10.0%
3,000
2,000                                                                    5.0%
1,000
    0                                                                    0.0%

         2004   2005      2006       2007        2008       Jan - June
                                                              2009

                       LP S, Applied Analytics


                           Connecticut

60,000                                                                   16.0%
                                    Residential S ales                   14.0%
50,000
                                    S hare o f REO S ales                12.0%
40,000
                                                                         10.0%
30,000                                                                   8.0%
                                                                         6.0%
20,000
                                                                         4.0%
10,000
                                                                         2.0%
     0                                                                   0.0%

         2004   2005       2006      2007        2008       Jan - June
                                                              2009

                       LP S, Applied Analytics
Colorado

140,000                                                                       35.0%
                                         Residential S ales
120,000                                                                       30.0%
                                         S hare o f REO S ales
100,000                                                                       25.0%

 80,000                                                                       20.0%

 60,000                                                                       15.0%

 40,000                                                                       10.0%

 20,000                                                                       5.0%

         0                                                                    0.0%

              2004   2005       2006       2007       2008       Jan - June
                                                                   2009

                            LP S, Applied Analytics


                                 Delaware

14,000                                                                        12.0%
                                         Residential S ales
12,000                                                                        10.0%
                                         S hare o f REO S ales
10,000
                                                                              8.0%
 8,000
                                                                              6.0%
 6,000
                                                                              4.0%
 4,000

 2,000                                                                        2.0%

     0                                                                        0.0%

             2004    2005      2006       2007        2008       Jan - June
                                                                   2009

                            LP S, Applied Analytics
Georgia

160,000                                                                   25.0%
140,000                              Residential S ales
                                                                          20.0%
120,000                              S hare o f REO S ales
100,000                                                                   15.0%
 80,000
 60,000                                                                   10.0%

 40,000
                                                                          5.0%
 20,000
      0                                                                   0.0%

          2004   2005       2006      2007        2008       Jan - June
                                                               2009

                        LP S, Applied Analytics


                              Florida

700,000                                                                   40.0%
                                     Residential S ales                   35.0%
600,000
                                     S hare o f REO S ales                30.0%
500,000
                                                                          25.0%
400,000
                                                                          20.0%
300,000
                                                                          15.0%
200,000
                                                                          10.0%
100,000                                                                   5.0%
      0                                                                   0.0%

          2004   2005       2006      2007        2008       Jan - June
                                                               2009

                        LP S, Applied Analytics
Hawaii

30,000                                                                     10.0%
                                    Residential S ales
25,000
                                                                           8.0%
                                    S hare o f REO S ales
20,000
                                                                           6.0%
15,000
                                                                           4.0%
10,000

                                                                           2.0%
 5,000

     0                                                                     0.0%

         2004   2005      2006       2007        2008        Jan - June
                                                               2009

                       LP S, Applied Analytics


                                 Iowa

16,000                                                                     9.0%
14,000                               Residential S ales                    8.0%

12,000                               S hare o f REO S ales                 7.0%
                                                                           6.0%
10,000
                                                                           5.0%
 8,000
                                                                           4.0%
 6,000
                                                                           3.0%
 4,000                                                                     2.0%
 2,000                                                                     1.0%
     0                                                                     0.0%

         2004   2005       2006         2007      2008        Jan - June
                                                                2009

                       LP S, Applied Analytics
Illinois

200,000                                                                       35.0%
                                         Residential S ales
                                                                              30.0%
150,000                                  S hare o f REO S ales
                                                                              25.0%

                                                                              20.0%
100,000
                                                                              15.0%

                                                                              10.0%
 50,000
                                                                              5.0%

         0                                                                    0.0%

              2004   2005       2006       2007       2008       Jan - June
                                                                   2009

                            LP S, Applied Analytics


                                 Kentucky

20,000                                                                        35.0%
                                         Residential S ales
                                                                              30.0%
15,000                                   S hare o f REO S ales
                                                                              25.0%

                                                                              20.0%
10,000
                                                                              15.0%

                                                                              10.0%
 5,000
                                                                              5.0%

     0                                                                        0.0%

             2004    2005      2006       2007        2008       Jan - June
                                                                   2009

                            LP S, Applied Analytics
Massachusetts

100,000                                                                   16.0%
                                     Residential S ales                   14.0%
 80,000
                                     S hare o f REO S ales                12.0%

 60,000                                                                   10.0%
                                                                          8.0%
 40,000                                                                   6.0%
                                                                          4.0%
 20,000
                                                                          2.0%
      0                                                                   0.0%

          2004   2005       2006      2007        2008       Jan - June
                                                               2009

                        LP S, Applied Analytics


                             Maryland

180,000                                                                   16.0%
160,000                              Residential S ales                   14.0%
140,000                              S hare o f REO S ales                12.0%
120,000
                                                                          10.0%
100,000
                                                                          8.0%
 80,000
                                                                          6.0%
 60,000
 40,000                                                                   4.0%

 20,000                                                                   2.0%
      0                                                                   0.0%

          2004   2005       2006      2007        2008       Jan - June
                                                               2009

                        LP S, Applied Analytics
Michigan

160,000                                                                       70.0%
140,000                                  Residential S ales
                                                                              60.0%
120,000                                  S hare o f REO S ales
                                                                              50.0%
100,000
                                                                              40.0%
 80,000
                                                                              30.0%
 60,000
                                                                              20.0%
 40,000
 20,000                                                                       10.0%

         0                                                                    0.0%

              2004   2005       2006       2007       2008       Jan - June
                                                                   2009

                            LP S, Applied Analytics


                                 Minnesota

80,000                                                                        50.0%
70,000                                   Residential S ales
                                                                              40.0%
60,000                                   S hare o f REO S ales
50,000                                                                        30.0%
40,000
30,000                                                                        20.0%

20,000
                                                                              10.0%
10,000
     0                                                                        0.0%

             2004    2005      2006       2007        2008       Jan - June
                                                                   2009

                            LP S, Applied Analytics
North Carolina

160,000                                                                       16.0%
140,000                                 Residential S ales                    14.0%
120,000                                 S hare o f REO S ales                 12.0%
100,000                                                                       10.0%
 80,000                                                                       8.0%
 60,000                                                                       6.0%
 40,000                                                                       4.0%
 20,000                                                                       2.0%
         0                                                                    0.0%

             2004   2005       2006      2007        2008       Jan - June
                                                                  2009

                           LP S, Applied Analytics


                                Nebraska

10,000                                                                        9.0%
                                        Residential S ales                    8.0%
 8,000                                                                        7.0%
                                        S hare o f REO S ales
                                                                              6.0%
 6,000
                                                                              5.0%
                                                                              4.0%
 4,000
                                                                              3.0%

 2,000                                                                        2.0%
                                                                              1.0%
     0                                                                        0.0%

             2004   2005      2006       2007        2008        Jan - June
                                                                   2009

                           LP S, Applied Analytics
New Hampshire

9,000                                                                          16.0%
8,000                                    Residential S ales                    14.0%
7,000                                    S hare o f REO S ales                 12.0%
6,000
                                                                               10.0%
5,000
                                                                               8.0%
4,000
                                                                               6.0%
3,000
2,000                                                                          4.0%

1,000                                                                          2.0%
   0                                                                           0.0%

            2004    2005       2006       2007         2008       Jan - June
                                                                    2009

                            LP S, Applied Analytics


                                 New Jersey

180,000                                                                        12.0%
160,000                                   Residential S ales
                                                                               10.0%
140,000                                   S hare o f REO S ales
120,000                                                                        8.0%
100,000
                                                                               6.0%
 80,000
 60,000                                                                        4.0%
 40,000
                                                                               2.0%
 20,000
        0                                                                      0.0%

             2004    2005        2006      2007        2008       Jan - June
                                                                    2009

                             LP S, Applied Analytics
Nevada

120,000                                                                     70.0%
                                     Residential S ales
100,000                                                                     60.0%
                                     S hare o f REO S ales
                                                                            50.0%
 80,000
                                                                            40.0%
 60,000
                                                                            30.0%
 40,000
                                                                            20.0%
 20,000                                                                     10.0%

      0                                                                     0.0%

          2004   2005       2006      2007         2008       Jan - June
                                                                2009

                        LP S, Applied Analytics


                             New York

160,000                                                                      8.0%
140,000                               Residential S ales                     7.0%
120,000                               S hare o f REO S ales                  6.0%
100,000                                                                      5.0%
 80,000                                                                      4.0%
 60,000                                                                      3.0%
 40,000                                                                      2.0%
 20,000                                                                      1.0%
      0                                                                      0.0%

          2004   2005        2006      2007         2008       Jan - June
                                                                  2009

                         LP S, Applied Analytics
Ohio

200,000                                                                       40.0%
                                         Residential S ales                   35.0%
150,000                                  S hare o f REO S ales                30.0%
                                                                              25.0%
100,000                                                                       20.0%
                                                                              15.0%
 50,000                                                                       10.0%
                                                                              5.0%
         0                                                                    0.0%

              2004   2005       2006         2007     2008       Jan - June
                                                                   2009

                            LP S, Applied Analytics


                                 Oklahoma

25,000                                                                        16.0%
                                         Residential S ales                   14.0%
20,000
                                         S hare o f REO S ales                12.0%

15,000                                                                        10.0%
                                                                              8.0%
10,000                                                                        6.0%
                                                                              4.0%
 5,000
                                                                              2.0%
     0                                                                        0.0%

             2004    2005      2006          2007     2008       Jan - June
                                                                   2009

                            LP S, Applied Analytics
Oregon

80,000                                                                        25.0%
70,000                                   Residential S ales
                                                                              20.0%
60,000                                   S hare o f REO S ales
50,000                                                                        15.0%
40,000
30,000                                                                        10.0%

20,000
                                                                              5.0%
10,000
     0                                                                        0.0%

             2004    2005      2006       2007        2008       Jan - June
                                                                   2009

                            LP S, Applied Analytics


                               Pennsylvania

140,000                                                                       12.0%
                                         Residential S ales
120,000                                                                       10.0%
                                         S hare o f REO S ales
100,000
                                                                              8.0%
 80,000
                                                                              6.0%
 60,000
                                                                              4.0%
 40,000

 20,000                                                                       2.0%

         0                                                                    0.0%

              2004   2005       2006       2007       2008       Jan - June
                                                                   2009

                            LP S, Applied Analytics
Rhode Island

16,000                                                                    35.0%
14,000                              Residential S ales
                                                                          30.0%
12,000                              S hare o f REO S ales
                                                                          25.0%
10,000
                                                                          20.0%
 8,000
                                                                          15.0%
 6,000
                                                                          10.0%
 4,000
 2,000                                                                    5.0%

     0                                                                    0.0%

         2004   2005      2006       2007        2008        Jan - June
                                                               2009

                       LP S, Applied Analytics


                         South Carolina

90,000                                                                    25.0%
80,000                               Residential S ales
70,000                                                                    20.0%
                                     S hare o f REO S ales
60,000
                                                                          15.0%
50,000
40,000
                                                                          10.0%
30,000
20,000                                                                    5.0%
10,000
     0                                                                    0.0%

         2004   2005       2006       2007        2008       Jan - June
                                                               2009

                       LP S, Applied Analytics
Tennessee

120,000                                                                   30.0%
                                     Residential S ales
100,000                                                                   25.0%
                                     S hare o f REO S ales
 80,000                                                                   20.0%

 60,000                                                                   15.0%

 40,000                                                                   10.0%

 20,000                                                                   5.0%

      0                                                                   0.0%

          2004   2005       2006      2007        2008       Jan - June
                                                               2009

                        LP S, Applied Analytics


                              Virginia

140,000                                                                   30.0%
                                     Residential S ales
120,000                                                                   25.0%
                                     S hare o f REO S ales
100,000
                                                                          20.0%
 80,000
                                                                          15.0%
 60,000
                                                                          10.0%
 40,000

 20,000                                                                   5.0%

      0                                                                   0.0%

          2004   2005       2006      2007        2008       Jan - June
                                                               2009

                        LP S, Applied Analytics
Vermont

4,000                                                                            8.0%
3,500                                     Residential S ales                     7.0%
3,000                                     S hare o f REO S ales                  6.0%
2,500                                                                            5.0%
2,000                                                                            4.0%
1,500                                                                            3.0%
1,000                                                                            2.0%
 500                                                                             1.0%
   0                                                                             0.0%

            2004      2005      2006       2007          2008       Jan - June
                                                                      2009

                             LP S, Applied Analytics


                                  Washington

 140,000                                                                         18.0%
                                            Residential S ales                   16.0%
 120,000
                                            S hare o f REO S ales                14.0%
 100,000
                                                                                 12.0%
  80,000                                                                         10.0%
  60,000                                                                         8.0%
                                                                                 6.0%
  40,000
                                                                                 4.0%
  20,000                                                                         2.0%
        0                                                                        0.0%

               2004     2005       2006      2007         2008      Jan - June
                                                                       2009

                               LP S, Applied Analytics
Wisconsin

30,000                                                                   20.0%
                                    Residential S ales
25,000
                                    S hare o f REO S ales                15.0%
20,000

15,000                                                                   10.0%

10,000
                                                                         5.0%
 5,000

     0                                                                   0.0%

         2004   2005      2006       2007        2008       Jan - June
                                                              2009

                       LP S, Applied Analytics

More Related Content

What's hot

09 06 16 Web 2.0 Weekly
09 06 16 Web 2.0 Weekly09 06 16 Web 2.0 Weekly
09 06 16 Web 2.0 Weekly
David Shore
 
Three Charts
Three ChartsThree Charts
Three Charts
Jonathan Smith
 
Martin Barden – The audience centre stage | congres podiumkunsten 2012
Martin Barden – The audience centre stage | congres podiumkunsten 2012Martin Barden – The audience centre stage | congres podiumkunsten 2012
Martin Barden – The audience centre stage | congres podiumkunsten 2012
Promotie Podiumkunsten
 
CR2 Apresentação - 3Q11
CR2   Apresentação - 3Q11CR2   Apresentação - 3Q11
CR2 Apresentação - 3Q11
CR2
 
Tele2 AB - Fourth Quarter 2011
Tele2 AB - Fourth Quarter 2011Tele2 AB - Fourth Quarter 2011
Tele2 AB - Fourth Quarter 2011
Tele2
 
Snapshot on the French Oncology Market March 2010
Snapshot on the French Oncology Market  March 2010Snapshot on the French Oncology Market  March 2010
Snapshot on the French Oncology Market March 2010
thomasmartinelli94
 
Building Human Capital: The New Face of Poverty
Building Human Capital: The New Face of PovertyBuilding Human Capital: The New Face of Poverty
Building Human Capital: The New Face of Poverty
North Carolina Association of County Commissioners
 
09 08 11 Web 2.0 Weekly
09 08 11 Web 2.0 Weekly09 08 11 Web 2.0 Weekly
09 08 11 Web 2.0 Weekly
David Shore
 
Media landscape updater vi 2012
Media landscape updater vi 2012Media landscape updater vi 2012
Media landscape updater vi 2012
MediaDirectionOMD
 
Model Based Benchmarking (MBBC) for Transportation
Model Based Benchmarking (MBBC) for TransportationModel Based Benchmarking (MBBC) for Transportation
Model Based Benchmarking (MBBC) for Transportation
njain37
 
Christoph Riess: Ukraine editors meeting
Christoph Riess: Ukraine editors meetingChristoph Riess: Ukraine editors meeting
Christoph Riess: Ukraine editors meeting
Dariya
 
5 Dan Berman USDA Perspectiva Agricola entre Estados Unidos y México
5 Dan Berman USDA Perspectiva Agricola entre Estados Unidos y México5 Dan Berman USDA Perspectiva Agricola entre Estados Unidos y México
5 Dan Berman USDA Perspectiva Agricola entre Estados Unidos y México
Consejo MexicanodelaCarne
 
Housing Phoenix Market April 2009
Housing Phoenix Market April 2009Housing Phoenix Market April 2009
Housing Phoenix Market April 2009
Kendall Matthews
 
09 08 18 Web 2.0 Weekly
09 08 18 Web 2.0 Weekly09 08 18 Web 2.0 Weekly
09 08 18 Web 2.0 Weekly
David Shore
 
Cea
CeaCea
2012-01-12 - American Marketing Association Toronto Chapter Multicultural Rou...
2012-01-12 - American Marketing Association Toronto Chapter Multicultural Rou...2012-01-12 - American Marketing Association Toronto Chapter Multicultural Rou...
2012-01-12 - American Marketing Association Toronto Chapter Multicultural Rou...
AMA Toronto
 
Tele2 AB - Presentation on Citigroup TMT conference 20120320
Tele2 AB - Presentation on Citigroup TMT conference 20120320Tele2 AB - Presentation on Citigroup TMT conference 20120320
Tele2 AB - Presentation on Citigroup TMT conference 20120320
Tele2
 
Us Drugstore Chains Research Report June 09
Us Drugstore Chains Research Report June 09Us Drugstore Chains Research Report June 09
Us Drugstore Chains Research Report June 09
Raj Bhatt
 
Media landscape updater v 2012
Media landscape updater v 2012Media landscape updater v 2012
Media landscape updater v 2012
MediaDirectionOMD
 

What's hot (19)

09 06 16 Web 2.0 Weekly
09 06 16 Web 2.0 Weekly09 06 16 Web 2.0 Weekly
09 06 16 Web 2.0 Weekly
 
Three Charts
Three ChartsThree Charts
Three Charts
 
Martin Barden – The audience centre stage | congres podiumkunsten 2012
Martin Barden – The audience centre stage | congres podiumkunsten 2012Martin Barden – The audience centre stage | congres podiumkunsten 2012
Martin Barden – The audience centre stage | congres podiumkunsten 2012
 
CR2 Apresentação - 3Q11
CR2   Apresentação - 3Q11CR2   Apresentação - 3Q11
CR2 Apresentação - 3Q11
 
Tele2 AB - Fourth Quarter 2011
Tele2 AB - Fourth Quarter 2011Tele2 AB - Fourth Quarter 2011
Tele2 AB - Fourth Quarter 2011
 
Snapshot on the French Oncology Market March 2010
Snapshot on the French Oncology Market  March 2010Snapshot on the French Oncology Market  March 2010
Snapshot on the French Oncology Market March 2010
 
Building Human Capital: The New Face of Poverty
Building Human Capital: The New Face of PovertyBuilding Human Capital: The New Face of Poverty
Building Human Capital: The New Face of Poverty
 
09 08 11 Web 2.0 Weekly
09 08 11 Web 2.0 Weekly09 08 11 Web 2.0 Weekly
09 08 11 Web 2.0 Weekly
 
Media landscape updater vi 2012
Media landscape updater vi 2012Media landscape updater vi 2012
Media landscape updater vi 2012
 
Model Based Benchmarking (MBBC) for Transportation
Model Based Benchmarking (MBBC) for TransportationModel Based Benchmarking (MBBC) for Transportation
Model Based Benchmarking (MBBC) for Transportation
 
Christoph Riess: Ukraine editors meeting
Christoph Riess: Ukraine editors meetingChristoph Riess: Ukraine editors meeting
Christoph Riess: Ukraine editors meeting
 
5 Dan Berman USDA Perspectiva Agricola entre Estados Unidos y México
5 Dan Berman USDA Perspectiva Agricola entre Estados Unidos y México5 Dan Berman USDA Perspectiva Agricola entre Estados Unidos y México
5 Dan Berman USDA Perspectiva Agricola entre Estados Unidos y México
 
Housing Phoenix Market April 2009
Housing Phoenix Market April 2009Housing Phoenix Market April 2009
Housing Phoenix Market April 2009
 
09 08 18 Web 2.0 Weekly
09 08 18 Web 2.0 Weekly09 08 18 Web 2.0 Weekly
09 08 18 Web 2.0 Weekly
 
Cea
CeaCea
Cea
 
2012-01-12 - American Marketing Association Toronto Chapter Multicultural Rou...
2012-01-12 - American Marketing Association Toronto Chapter Multicultural Rou...2012-01-12 - American Marketing Association Toronto Chapter Multicultural Rou...
2012-01-12 - American Marketing Association Toronto Chapter Multicultural Rou...
 
Tele2 AB - Presentation on Citigroup TMT conference 20120320
Tele2 AB - Presentation on Citigroup TMT conference 20120320Tele2 AB - Presentation on Citigroup TMT conference 20120320
Tele2 AB - Presentation on Citigroup TMT conference 20120320
 
Us Drugstore Chains Research Report June 09
Us Drugstore Chains Research Report June 09Us Drugstore Chains Research Report June 09
Us Drugstore Chains Research Report June 09
 
Media landscape updater v 2012
Media landscape updater v 2012Media landscape updater v 2012
Media landscape updater v 2012
 

Viewers also liked

School Community Gardens: School Ground Greening
School Community Gardens: School Ground GreeningSchool Community Gardens: School Ground Greening
School Community Gardens: School Ground Greening
School Vegetable Gardening - Victory Gardens
 
Garden Tour Power Point test
Garden Tour Power Point testGarden Tour Power Point test
Garden Tour Power Point test
carlahaight
 
Garden power point
Garden power pointGarden power point
Garden power point
zoekatleman
 
GA: Schoolyard Wildlife Habitat Planning Guide
GA: Schoolyard Wildlife Habitat Planning GuideGA: Schoolyard Wildlife Habitat Planning Guide
GA: Schoolyard Wildlife Habitat Planning Guide
Sotirakou964
 
Dan Whitehead Arbor Day Flyer
Dan Whitehead Arbor Day FlyerDan Whitehead Arbor Day Flyer
Dan Whitehead Arbor Day Flyer
carlahaight
 
Price Decline By States
Price Decline By StatesPrice Decline By States
Price Decline By States
carlahaight
 
2009 Sfe Awards Presentation
2009 Sfe Awards Presentation2009 Sfe Awards Presentation
2009 Sfe Awards Presentation
Monica David
 

Viewers also liked (7)

School Community Gardens: School Ground Greening
School Community Gardens: School Ground GreeningSchool Community Gardens: School Ground Greening
School Community Gardens: School Ground Greening
 
Garden Tour Power Point test
Garden Tour Power Point testGarden Tour Power Point test
Garden Tour Power Point test
 
Garden power point
Garden power pointGarden power point
Garden power point
 
GA: Schoolyard Wildlife Habitat Planning Guide
GA: Schoolyard Wildlife Habitat Planning GuideGA: Schoolyard Wildlife Habitat Planning Guide
GA: Schoolyard Wildlife Habitat Planning Guide
 
Dan Whitehead Arbor Day Flyer
Dan Whitehead Arbor Day FlyerDan Whitehead Arbor Day Flyer
Dan Whitehead Arbor Day Flyer
 
Price Decline By States
Price Decline By StatesPrice Decline By States
Price Decline By States
 
2009 Sfe Awards Presentation
2009 Sfe Awards Presentation2009 Sfe Awards Presentation
2009 Sfe Awards Presentation
 

Similar to Impact Of Foreclosures On Home Prices

Microsoft - CTO Cloud Strategy - Rob Fraser
Microsoft - CTO Cloud Strategy - Rob FraserMicrosoft - CTO Cloud Strategy - Rob Fraser
Microsoft - CTO Cloud Strategy - Rob Fraser
Digital Leaders
 
Hot Summer case study Online Meet Up
Hot Summer case study Online Meet UpHot Summer case study Online Meet Up
Hot Summer case study Online Meet Up
Orange Online Meetup
 
Greece Broadband Plan
Greece Broadband PlanGreece Broadband Plan
Greece Broadband Plan
littlehigh
 
We are alive! Now what? by Kārlis Cērbulis
We are alive! Now what? by Kārlis CērbulisWe are alive! Now what? by Kārlis Cērbulis
We are alive! Now what? by Kārlis Cērbulis
Roberts Zīle
 
Tele2 Second quarter 2012
Tele2 Second quarter 2012Tele2 Second quarter 2012
Tele2 Second quarter 2012
Tele2
 
U ti investorday2011-freightforwarding
U ti investorday2011-freightforwardingU ti investorday2011-freightforwarding
U ti investorday2011-freightforwarding
Frankie Coki
 
CV Industry & Market Share in India - Oct'2012
CV Industry & Market Share in India - Oct'2012CV Industry & Market Share in India - Oct'2012
CV Industry & Market Share in India - Oct'2012
Vivek Bhati
 
Strix Applications Case Studies
Strix  Applications  Case StudiesStrix  Applications  Case Studies
Strix Applications Case Studies
tritv
 
Utah Adult Education Report Card (2008-2009)
Utah Adult Education Report Card (2008-2009)Utah Adult Education Report Card (2008-2009)
Utah Adult Education Report Card (2008-2009)
State of Utah, Salt Lake City
 
Investor Pain Index 11302007 Thru 07072009
Investor Pain Index 11302007 Thru 07072009Investor Pain Index 11302007 Thru 07072009
Investor Pain Index 11302007 Thru 07072009
Jonathan Smith
 
Beltu irrigation dam
Beltu irrigation damBeltu irrigation dam
Beltu irrigation dam
stradling
 
Web 2.0 Solutions For One High-end Hotel Brand in Beijing
Web 2.0 Solutions For One High-end Hotel Brand in BeijingWeb 2.0 Solutions For One High-end Hotel Brand in Beijing
Web 2.0 Solutions For One High-end Hotel Brand in Beijing
Lara Young
 
Mobclix Sfmobile
Mobclix SfmobileMobclix Sfmobile
Mobclix Sfmobile
Vishal Gurbuxani
 
Manufacturing Economic Update
Manufacturing Economic UpdateManufacturing Economic Update
Manufacturing Economic Update
Council of Manufacturing Associations
 
Hn & Hcm Market Presentation Q4 2009 Final En
Hn & Hcm  Market Presentation Q4 2009 Final   EnHn & Hcm  Market Presentation Q4 2009 Final   En
Hn & Hcm Market Presentation Q4 2009 Final En
savillsvietnam
 
Singapore taxation-2011-factsheet
Singapore taxation-2011-factsheetSingapore taxation-2011-factsheet
Singapore taxation-2011-factsheet
Maverick Tan
 
Singapore taxation 2011 fact sheet standard
Singapore taxation 2011 fact sheet standardSingapore taxation 2011 fact sheet standard
Singapore taxation 2011 fact sheet standard
Maverick Tan
 
Apresentação resultado eng final
Apresentação   resultado eng finalApresentação   resultado eng final
Apresentação resultado eng final
JBS RI
 
Mobile2012 L2 Think Tank
Mobile2012 L2 Think TankMobile2012 L2 Think Tank
Mobile2012 L2 Think Tank
Henri Kaufman
 
2012 dk patronage slides
2012 dk patronage slides2012 dk patronage slides
2012 dk patronage slides
Michelle Gjerde
 

Similar to Impact Of Foreclosures On Home Prices (20)

Microsoft - CTO Cloud Strategy - Rob Fraser
Microsoft - CTO Cloud Strategy - Rob FraserMicrosoft - CTO Cloud Strategy - Rob Fraser
Microsoft - CTO Cloud Strategy - Rob Fraser
 
Hot Summer case study Online Meet Up
Hot Summer case study Online Meet UpHot Summer case study Online Meet Up
Hot Summer case study Online Meet Up
 
Greece Broadband Plan
Greece Broadband PlanGreece Broadband Plan
Greece Broadband Plan
 
We are alive! Now what? by Kārlis Cērbulis
We are alive! Now what? by Kārlis CērbulisWe are alive! Now what? by Kārlis Cērbulis
We are alive! Now what? by Kārlis Cērbulis
 
Tele2 Second quarter 2012
Tele2 Second quarter 2012Tele2 Second quarter 2012
Tele2 Second quarter 2012
 
U ti investorday2011-freightforwarding
U ti investorday2011-freightforwardingU ti investorday2011-freightforwarding
U ti investorday2011-freightforwarding
 
CV Industry & Market Share in India - Oct'2012
CV Industry & Market Share in India - Oct'2012CV Industry & Market Share in India - Oct'2012
CV Industry & Market Share in India - Oct'2012
 
Strix Applications Case Studies
Strix  Applications  Case StudiesStrix  Applications  Case Studies
Strix Applications Case Studies
 
Utah Adult Education Report Card (2008-2009)
Utah Adult Education Report Card (2008-2009)Utah Adult Education Report Card (2008-2009)
Utah Adult Education Report Card (2008-2009)
 
Investor Pain Index 11302007 Thru 07072009
Investor Pain Index 11302007 Thru 07072009Investor Pain Index 11302007 Thru 07072009
Investor Pain Index 11302007 Thru 07072009
 
Beltu irrigation dam
Beltu irrigation damBeltu irrigation dam
Beltu irrigation dam
 
Web 2.0 Solutions For One High-end Hotel Brand in Beijing
Web 2.0 Solutions For One High-end Hotel Brand in BeijingWeb 2.0 Solutions For One High-end Hotel Brand in Beijing
Web 2.0 Solutions For One High-end Hotel Brand in Beijing
 
Mobclix Sfmobile
Mobclix SfmobileMobclix Sfmobile
Mobclix Sfmobile
 
Manufacturing Economic Update
Manufacturing Economic UpdateManufacturing Economic Update
Manufacturing Economic Update
 
Hn & Hcm Market Presentation Q4 2009 Final En
Hn & Hcm  Market Presentation Q4 2009 Final   EnHn & Hcm  Market Presentation Q4 2009 Final   En
Hn & Hcm Market Presentation Q4 2009 Final En
 
Singapore taxation-2011-factsheet
Singapore taxation-2011-factsheetSingapore taxation-2011-factsheet
Singapore taxation-2011-factsheet
 
Singapore taxation 2011 fact sheet standard
Singapore taxation 2011 fact sheet standardSingapore taxation 2011 fact sheet standard
Singapore taxation 2011 fact sheet standard
 
Apresentação resultado eng final
Apresentação   resultado eng finalApresentação   resultado eng final
Apresentação resultado eng final
 
Mobile2012 L2 Think Tank
Mobile2012 L2 Think TankMobile2012 L2 Think Tank
Mobile2012 L2 Think Tank
 
2012 dk patronage slides
2012 dk patronage slides2012 dk patronage slides
2012 dk patronage slides
 

Recently uploaded

Registered-Establishment-List-in-Uttarakhand-pdf.pdf
Registered-Establishment-List-in-Uttarakhand-pdf.pdfRegistered-Establishment-List-in-Uttarakhand-pdf.pdf
Registered-Establishment-List-in-Uttarakhand-pdf.pdf
dazzjoker
 
Satta Matka Dpboss Kalyan Matka Results Kalyan Chart
Satta Matka Dpboss Kalyan Matka Results Kalyan ChartSatta Matka Dpboss Kalyan Matka Results Kalyan Chart
Satta Matka Dpboss Kalyan Matka Results Kalyan Chart
Satta Matka Dpboss Kalyan Matka Results
 
DearbornMusic-KatherineJasperFullSailUni
DearbornMusic-KatherineJasperFullSailUniDearbornMusic-KatherineJasperFullSailUni
DearbornMusic-KatherineJasperFullSailUni
katiejasper96
 
Call 8867766396 Dpboss Matka Guessing Satta Matta Matka Kalyan Chart Indian M...
Call 8867766396 Dpboss Matka Guessing Satta Matta Matka Kalyan Chart Indian M...Call 8867766396 Dpboss Matka Guessing Satta Matta Matka Kalyan Chart Indian M...
Call 8867766396 Dpboss Matka Guessing Satta Matta Matka Kalyan Chart Indian M...
dpbossdpboss69
 
Pro Tips for Effortless Contract Management
Pro Tips for Effortless Contract ManagementPro Tips for Effortless Contract Management
Pro Tips for Effortless Contract Management
Eternity Paralegal Services
 
1 Circular 003_2023 ISO 27001_2022 Transition Arrangments v3.pdf
1 Circular 003_2023 ISO 27001_2022 Transition Arrangments v3.pdf1 Circular 003_2023 ISO 27001_2022 Transition Arrangments v3.pdf
1 Circular 003_2023 ISO 27001_2022 Transition Arrangments v3.pdf
ISONIKELtd
 
Kirill Klip GEM Royalty TNR Gold Lithium Presentation
Kirill Klip GEM Royalty TNR Gold Lithium PresentationKirill Klip GEM Royalty TNR Gold Lithium Presentation
Kirill Klip GEM Royalty TNR Gold Lithium Presentation
Kirill Klip
 
8328958814KALYAN MATKA | MATKA RESULT | KALYAN
8328958814KALYAN MATKA | MATKA RESULT | KALYAN8328958814KALYAN MATKA | MATKA RESULT | KALYAN
8328958814KALYAN MATKA | MATKA RESULT | KALYAN
➑➌➋➑➒➎➑➑➊➍
 
Satta Matka Dpboss Kalyan Matka Results Kalyan Chart
Satta Matka Dpboss Kalyan Matka Results Kalyan ChartSatta Matka Dpboss Kalyan Matka Results Kalyan Chart
Satta Matka Dpboss Kalyan Matka Results Kalyan Chart
Satta Matka Dpboss Kalyan Matka Results
 
Efficient PHP Development Solutions for Dynamic Web Applications
Efficient PHP Development Solutions for Dynamic Web ApplicationsEfficient PHP Development Solutions for Dynamic Web Applications
Efficient PHP Development Solutions for Dynamic Web Applications
Harwinder Singh
 
The latest Heat Pump Manual from Newentide
The latest Heat Pump Manual from NewentideThe latest Heat Pump Manual from Newentide
The latest Heat Pump Manual from Newentide
JoeYangGreatMachiner
 
Kirill Klip GEM Royalty TNR Gold Copper Presentation
Kirill Klip GEM Royalty TNR Gold Copper PresentationKirill Klip GEM Royalty TNR Gold Copper Presentation
Kirill Klip GEM Royalty TNR Gold Copper Presentation
Kirill Klip
 
Lukas Rycek - GreenChemForCE - project structure.pptx
Lukas Rycek - GreenChemForCE - project structure.pptxLukas Rycek - GreenChemForCE - project structure.pptx
Lukas Rycek - GreenChemForCE - project structure.pptx
pavelborek
 
Prescriptive analytics BA4206 Anna University PPT
Prescriptive analytics BA4206 Anna University PPTPrescriptive analytics BA4206 Anna University PPT
Prescriptive analytics BA4206 Anna University PPT
Freelance
 
一比一原版(QMUE毕业证书)英国爱丁堡玛格丽特女王大学毕业证文凭如何办理
一比一原版(QMUE毕业证书)英国爱丁堡玛格丽特女王大学毕业证文凭如何办理一比一原版(QMUE毕业证书)英国爱丁堡玛格丽特女王大学毕业证文凭如何办理
一比一原版(QMUE毕业证书)英国爱丁堡玛格丽特女王大学毕业证文凭如何办理
taqyea
 
The Steadfast and Reliable Bull: Taurus Zodiac Sign
The Steadfast and Reliable Bull: Taurus Zodiac SignThe Steadfast and Reliable Bull: Taurus Zodiac Sign
The Steadfast and Reliable Bull: Taurus Zodiac Sign
my Pandit
 
Discover the Beauty and Functionality of The Expert Remodeling Service
Discover the Beauty and Functionality of The Expert Remodeling ServiceDiscover the Beauty and Functionality of The Expert Remodeling Service
Discover the Beauty and Functionality of The Expert Remodeling Service
obriengroupinc04
 
Satta Matka Dpboss Kalyan Matka Results Kalyan Chart
Satta Matka Dpboss Kalyan Matka Results Kalyan ChartSatta Matka Dpboss Kalyan Matka Results Kalyan Chart
Satta Matka Dpboss Kalyan Matka Results Kalyan Chart
Satta Matka Dpboss Kalyan Matka Results
 
Unlocking WhatsApp Marketing with HubSpot: Integrating Messaging into Your Ma...
Unlocking WhatsApp Marketing with HubSpot: Integrating Messaging into Your Ma...Unlocking WhatsApp Marketing with HubSpot: Integrating Messaging into Your Ma...
Unlocking WhatsApp Marketing with HubSpot: Integrating Messaging into Your Ma...
Niswey
 
AI Transformation Playbook: Thinking AI-First for Your Business
AI Transformation Playbook: Thinking AI-First for Your BusinessAI Transformation Playbook: Thinking AI-First for Your Business
AI Transformation Playbook: Thinking AI-First for Your Business
Arijit Dutta
 

Recently uploaded (20)

Registered-Establishment-List-in-Uttarakhand-pdf.pdf
Registered-Establishment-List-in-Uttarakhand-pdf.pdfRegistered-Establishment-List-in-Uttarakhand-pdf.pdf
Registered-Establishment-List-in-Uttarakhand-pdf.pdf
 
Satta Matka Dpboss Kalyan Matka Results Kalyan Chart
Satta Matka Dpboss Kalyan Matka Results Kalyan ChartSatta Matka Dpboss Kalyan Matka Results Kalyan Chart
Satta Matka Dpboss Kalyan Matka Results Kalyan Chart
 
DearbornMusic-KatherineJasperFullSailUni
DearbornMusic-KatherineJasperFullSailUniDearbornMusic-KatherineJasperFullSailUni
DearbornMusic-KatherineJasperFullSailUni
 
Call 8867766396 Dpboss Matka Guessing Satta Matta Matka Kalyan Chart Indian M...
Call 8867766396 Dpboss Matka Guessing Satta Matta Matka Kalyan Chart Indian M...Call 8867766396 Dpboss Matka Guessing Satta Matta Matka Kalyan Chart Indian M...
Call 8867766396 Dpboss Matka Guessing Satta Matta Matka Kalyan Chart Indian M...
 
Pro Tips for Effortless Contract Management
Pro Tips for Effortless Contract ManagementPro Tips for Effortless Contract Management
Pro Tips for Effortless Contract Management
 
1 Circular 003_2023 ISO 27001_2022 Transition Arrangments v3.pdf
1 Circular 003_2023 ISO 27001_2022 Transition Arrangments v3.pdf1 Circular 003_2023 ISO 27001_2022 Transition Arrangments v3.pdf
1 Circular 003_2023 ISO 27001_2022 Transition Arrangments v3.pdf
 
Kirill Klip GEM Royalty TNR Gold Lithium Presentation
Kirill Klip GEM Royalty TNR Gold Lithium PresentationKirill Klip GEM Royalty TNR Gold Lithium Presentation
Kirill Klip GEM Royalty TNR Gold Lithium Presentation
 
8328958814KALYAN MATKA | MATKA RESULT | KALYAN
8328958814KALYAN MATKA | MATKA RESULT | KALYAN8328958814KALYAN MATKA | MATKA RESULT | KALYAN
8328958814KALYAN MATKA | MATKA RESULT | KALYAN
 
Satta Matka Dpboss Kalyan Matka Results Kalyan Chart
Satta Matka Dpboss Kalyan Matka Results Kalyan ChartSatta Matka Dpboss Kalyan Matka Results Kalyan Chart
Satta Matka Dpboss Kalyan Matka Results Kalyan Chart
 
Efficient PHP Development Solutions for Dynamic Web Applications
Efficient PHP Development Solutions for Dynamic Web ApplicationsEfficient PHP Development Solutions for Dynamic Web Applications
Efficient PHP Development Solutions for Dynamic Web Applications
 
The latest Heat Pump Manual from Newentide
The latest Heat Pump Manual from NewentideThe latest Heat Pump Manual from Newentide
The latest Heat Pump Manual from Newentide
 
Kirill Klip GEM Royalty TNR Gold Copper Presentation
Kirill Klip GEM Royalty TNR Gold Copper PresentationKirill Klip GEM Royalty TNR Gold Copper Presentation
Kirill Klip GEM Royalty TNR Gold Copper Presentation
 
Lukas Rycek - GreenChemForCE - project structure.pptx
Lukas Rycek - GreenChemForCE - project structure.pptxLukas Rycek - GreenChemForCE - project structure.pptx
Lukas Rycek - GreenChemForCE - project structure.pptx
 
Prescriptive analytics BA4206 Anna University PPT
Prescriptive analytics BA4206 Anna University PPTPrescriptive analytics BA4206 Anna University PPT
Prescriptive analytics BA4206 Anna University PPT
 
一比一原版(QMUE毕业证书)英国爱丁堡玛格丽特女王大学毕业证文凭如何办理
一比一原版(QMUE毕业证书)英国爱丁堡玛格丽特女王大学毕业证文凭如何办理一比一原版(QMUE毕业证书)英国爱丁堡玛格丽特女王大学毕业证文凭如何办理
一比一原版(QMUE毕业证书)英国爱丁堡玛格丽特女王大学毕业证文凭如何办理
 
The Steadfast and Reliable Bull: Taurus Zodiac Sign
The Steadfast and Reliable Bull: Taurus Zodiac SignThe Steadfast and Reliable Bull: Taurus Zodiac Sign
The Steadfast and Reliable Bull: Taurus Zodiac Sign
 
Discover the Beauty and Functionality of The Expert Remodeling Service
Discover the Beauty and Functionality of The Expert Remodeling ServiceDiscover the Beauty and Functionality of The Expert Remodeling Service
Discover the Beauty and Functionality of The Expert Remodeling Service
 
Satta Matka Dpboss Kalyan Matka Results Kalyan Chart
Satta Matka Dpboss Kalyan Matka Results Kalyan ChartSatta Matka Dpboss Kalyan Matka Results Kalyan Chart
Satta Matka Dpboss Kalyan Matka Results Kalyan Chart
 
Unlocking WhatsApp Marketing with HubSpot: Integrating Messaging into Your Ma...
Unlocking WhatsApp Marketing with HubSpot: Integrating Messaging into Your Ma...Unlocking WhatsApp Marketing with HubSpot: Integrating Messaging into Your Ma...
Unlocking WhatsApp Marketing with HubSpot: Integrating Messaging into Your Ma...
 
AI Transformation Playbook: Thinking AI-First for Your Business
AI Transformation Playbook: Thinking AI-First for Your BusinessAI Transformation Playbook: Thinking AI-First for Your Business
AI Transformation Playbook: Thinking AI-First for Your Business
 

Impact Of Foreclosures On Home Prices

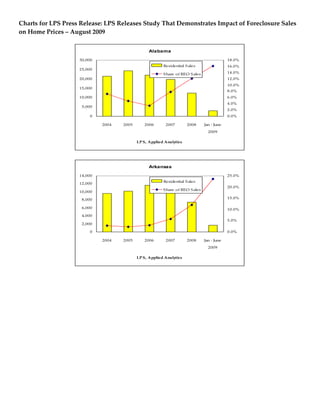
  • 1. Charts for LPS Press Release: LPS Releases Study That Demonstrates Impact of Foreclosure Sales on Home Prices – August 2009 Alabama 30,000 18.0% Residential S ales 16.0% 25,000 S hare o f REO S ales 14.0% 20,000 12.0% 10.0% 15,000 8.0% 10,000 6.0% 4.0% 5,000 2.0% 0 0.0% 2004 2005 2006 2007 2008 Jan - June 2009 LP S, Applied Analytics Arkansas 14,000 25.0% Residential S ales 12,000 20.0% S hare o f REO S ales 10,000 8,000 15.0% 6,000 10.0% 4,000 5.0% 2,000 0 0.0% 2004 2005 2006 2007 2008 Jan - June 2009 LP S, Applied Analytics
  • 2. Arizona 250,000 60.0% Residential S ales 50.0% 200,000 S hare o f REO S ales 40.0% 150,000 30.0% 100,000 20.0% 50,000 10.0% 0 0.0% 2004 2005 2006 2007 2008 Jan - June 2009 LP S, Applied Analytics California 800,000 60.0% 700,000 Residential S ales 50.0% 600,000 S hare o f REO S ales 40.0% 500,000 400,000 30.0% 300,000 20.0% 200,000 10.0% 100,000 0 0.0% 2004 2005 2006 2007 2008 Jan - June 2009 LP S, Applied Analytics
  • 3. District of Columbia 8,000 20.0% 7,000 Residential S ales 6,000 S hare o f REO S ales 15.0% 5,000 4,000 10.0% 3,000 2,000 5.0% 1,000 0 0.0% 2004 2005 2006 2007 2008 Jan - June 2009 LP S, Applied Analytics Connecticut 60,000 16.0% Residential S ales 14.0% 50,000 S hare o f REO S ales 12.0% 40,000 10.0% 30,000 8.0% 6.0% 20,000 4.0% 10,000 2.0% 0 0.0% 2004 2005 2006 2007 2008 Jan - June 2009 LP S, Applied Analytics
  • 4. Colorado 140,000 35.0% Residential S ales 120,000 30.0% S hare o f REO S ales 100,000 25.0% 80,000 20.0% 60,000 15.0% 40,000 10.0% 20,000 5.0% 0 0.0% 2004 2005 2006 2007 2008 Jan - June 2009 LP S, Applied Analytics Delaware 14,000 12.0% Residential S ales 12,000 10.0% S hare o f REO S ales 10,000 8.0% 8,000 6.0% 6,000 4.0% 4,000 2,000 2.0% 0 0.0% 2004 2005 2006 2007 2008 Jan - June 2009 LP S, Applied Analytics
  • 5. Georgia 160,000 25.0% 140,000 Residential S ales 20.0% 120,000 S hare o f REO S ales 100,000 15.0% 80,000 60,000 10.0% 40,000 5.0% 20,000 0 0.0% 2004 2005 2006 2007 2008 Jan - June 2009 LP S, Applied Analytics Florida 700,000 40.0% Residential S ales 35.0% 600,000 S hare o f REO S ales 30.0% 500,000 25.0% 400,000 20.0% 300,000 15.0% 200,000 10.0% 100,000 5.0% 0 0.0% 2004 2005 2006 2007 2008 Jan - June 2009 LP S, Applied Analytics
  • 6. Hawaii 30,000 10.0% Residential S ales 25,000 8.0% S hare o f REO S ales 20,000 6.0% 15,000 4.0% 10,000 2.0% 5,000 0 0.0% 2004 2005 2006 2007 2008 Jan - June 2009 LP S, Applied Analytics Iowa 16,000 9.0% 14,000 Residential S ales 8.0% 12,000 S hare o f REO S ales 7.0% 6.0% 10,000 5.0% 8,000 4.0% 6,000 3.0% 4,000 2.0% 2,000 1.0% 0 0.0% 2004 2005 2006 2007 2008 Jan - June 2009 LP S, Applied Analytics
  • 7. Illinois 200,000 35.0% Residential S ales 30.0% 150,000 S hare o f REO S ales 25.0% 20.0% 100,000 15.0% 10.0% 50,000 5.0% 0 0.0% 2004 2005 2006 2007 2008 Jan - June 2009 LP S, Applied Analytics Kentucky 20,000 35.0% Residential S ales 30.0% 15,000 S hare o f REO S ales 25.0% 20.0% 10,000 15.0% 10.0% 5,000 5.0% 0 0.0% 2004 2005 2006 2007 2008 Jan - June 2009 LP S, Applied Analytics
  • 8. Massachusetts 100,000 16.0% Residential S ales 14.0% 80,000 S hare o f REO S ales 12.0% 60,000 10.0% 8.0% 40,000 6.0% 4.0% 20,000 2.0% 0 0.0% 2004 2005 2006 2007 2008 Jan - June 2009 LP S, Applied Analytics Maryland 180,000 16.0% 160,000 Residential S ales 14.0% 140,000 S hare o f REO S ales 12.0% 120,000 10.0% 100,000 8.0% 80,000 6.0% 60,000 40,000 4.0% 20,000 2.0% 0 0.0% 2004 2005 2006 2007 2008 Jan - June 2009 LP S, Applied Analytics
  • 9. Michigan 160,000 70.0% 140,000 Residential S ales 60.0% 120,000 S hare o f REO S ales 50.0% 100,000 40.0% 80,000 30.0% 60,000 20.0% 40,000 20,000 10.0% 0 0.0% 2004 2005 2006 2007 2008 Jan - June 2009 LP S, Applied Analytics Minnesota 80,000 50.0% 70,000 Residential S ales 40.0% 60,000 S hare o f REO S ales 50,000 30.0% 40,000 30,000 20.0% 20,000 10.0% 10,000 0 0.0% 2004 2005 2006 2007 2008 Jan - June 2009 LP S, Applied Analytics
  • 10. North Carolina 160,000 16.0% 140,000 Residential S ales 14.0% 120,000 S hare o f REO S ales 12.0% 100,000 10.0% 80,000 8.0% 60,000 6.0% 40,000 4.0% 20,000 2.0% 0 0.0% 2004 2005 2006 2007 2008 Jan - June 2009 LP S, Applied Analytics Nebraska 10,000 9.0% Residential S ales 8.0% 8,000 7.0% S hare o f REO S ales 6.0% 6,000 5.0% 4.0% 4,000 3.0% 2,000 2.0% 1.0% 0 0.0% 2004 2005 2006 2007 2008 Jan - June 2009 LP S, Applied Analytics
  • 11. New Hampshire 9,000 16.0% 8,000 Residential S ales 14.0% 7,000 S hare o f REO S ales 12.0% 6,000 10.0% 5,000 8.0% 4,000 6.0% 3,000 2,000 4.0% 1,000 2.0% 0 0.0% 2004 2005 2006 2007 2008 Jan - June 2009 LP S, Applied Analytics New Jersey 180,000 12.0% 160,000 Residential S ales 10.0% 140,000 S hare o f REO S ales 120,000 8.0% 100,000 6.0% 80,000 60,000 4.0% 40,000 2.0% 20,000 0 0.0% 2004 2005 2006 2007 2008 Jan - June 2009 LP S, Applied Analytics
  • 12. Nevada 120,000 70.0% Residential S ales 100,000 60.0% S hare o f REO S ales 50.0% 80,000 40.0% 60,000 30.0% 40,000 20.0% 20,000 10.0% 0 0.0% 2004 2005 2006 2007 2008 Jan - June 2009 LP S, Applied Analytics New York 160,000 8.0% 140,000 Residential S ales 7.0% 120,000 S hare o f REO S ales 6.0% 100,000 5.0% 80,000 4.0% 60,000 3.0% 40,000 2.0% 20,000 1.0% 0 0.0% 2004 2005 2006 2007 2008 Jan - June 2009 LP S, Applied Analytics
  • 13. Ohio 200,000 40.0% Residential S ales 35.0% 150,000 S hare o f REO S ales 30.0% 25.0% 100,000 20.0% 15.0% 50,000 10.0% 5.0% 0 0.0% 2004 2005 2006 2007 2008 Jan - June 2009 LP S, Applied Analytics Oklahoma 25,000 16.0% Residential S ales 14.0% 20,000 S hare o f REO S ales 12.0% 15,000 10.0% 8.0% 10,000 6.0% 4.0% 5,000 2.0% 0 0.0% 2004 2005 2006 2007 2008 Jan - June 2009 LP S, Applied Analytics
  • 14. Oregon 80,000 25.0% 70,000 Residential S ales 20.0% 60,000 S hare o f REO S ales 50,000 15.0% 40,000 30,000 10.0% 20,000 5.0% 10,000 0 0.0% 2004 2005 2006 2007 2008 Jan - June 2009 LP S, Applied Analytics Pennsylvania 140,000 12.0% Residential S ales 120,000 10.0% S hare o f REO S ales 100,000 8.0% 80,000 6.0% 60,000 4.0% 40,000 20,000 2.0% 0 0.0% 2004 2005 2006 2007 2008 Jan - June 2009 LP S, Applied Analytics
  • 15. Rhode Island 16,000 35.0% 14,000 Residential S ales 30.0% 12,000 S hare o f REO S ales 25.0% 10,000 20.0% 8,000 15.0% 6,000 10.0% 4,000 2,000 5.0% 0 0.0% 2004 2005 2006 2007 2008 Jan - June 2009 LP S, Applied Analytics South Carolina 90,000 25.0% 80,000 Residential S ales 70,000 20.0% S hare o f REO S ales 60,000 15.0% 50,000 40,000 10.0% 30,000 20,000 5.0% 10,000 0 0.0% 2004 2005 2006 2007 2008 Jan - June 2009 LP S, Applied Analytics
  • 16. Tennessee 120,000 30.0% Residential S ales 100,000 25.0% S hare o f REO S ales 80,000 20.0% 60,000 15.0% 40,000 10.0% 20,000 5.0% 0 0.0% 2004 2005 2006 2007 2008 Jan - June 2009 LP S, Applied Analytics Virginia 140,000 30.0% Residential S ales 120,000 25.0% S hare o f REO S ales 100,000 20.0% 80,000 15.0% 60,000 10.0% 40,000 20,000 5.0% 0 0.0% 2004 2005 2006 2007 2008 Jan - June 2009 LP S, Applied Analytics
  • 17. Vermont 4,000 8.0% 3,500 Residential S ales 7.0% 3,000 S hare o f REO S ales 6.0% 2,500 5.0% 2,000 4.0% 1,500 3.0% 1,000 2.0% 500 1.0% 0 0.0% 2004 2005 2006 2007 2008 Jan - June 2009 LP S, Applied Analytics Washington 140,000 18.0% Residential S ales 16.0% 120,000 S hare o f REO S ales 14.0% 100,000 12.0% 80,000 10.0% 60,000 8.0% 6.0% 40,000 4.0% 20,000 2.0% 0 0.0% 2004 2005 2006 2007 2008 Jan - June 2009 LP S, Applied Analytics
  • 18. Wisconsin 30,000 20.0% Residential S ales 25,000 S hare o f REO S ales 15.0% 20,000 15,000 10.0% 10,000 5.0% 5,000 0 0.0% 2004 2005 2006 2007 2008 Jan - June 2009 LP S, Applied Analytics