04 notes from working period
•
0 likes•161 views
The document instructs students to break into groups of 3. Each group will choose 5 challenging questions from pages 18-19, including 3 parts of each question. Groups will then give their selected questions to another group to answer.
Report
Share
Report
Share
Download to read offline

Recommended
Module one
There are three types of multiple choice questions on the NES Writing test: 1) Questions that require reviewing a passage and selecting answers about the passage, 2) Questions that require selecting one correct answer from multiple choices, and 3) Questions that require selecting multiple correct answers from multiple choices. The presentation discusses these three question types and encourages reviewing sample questions in the NES profile to familiarize yourself with the formats.
01 intro
Graphs are visual representations of data that allow for patterns and relationships to be more easily identified and understood. They can be used to display data trends over time, compare values across categories, or organize information in a spatial relationship. Graphs help people comprehend complex data by transforming numbers and statistics into an intuitive visual format.
08 calc and nonlinear
1. The document provides instructions for performing statistical plots, regression equations, and exponential graphs on a graphing calculator.
2. It explains how to create lists of data, turn on stat plots, choose appropriate window settings, and select different types of regression analyses.
3. Examples are given for linear, quadratic, cubic, and exponential regression equations and how to graph the generated equations. Students are directed to practice examples in their textbook in preparation for a similar quiz tomorrow.
06 surface area of cubes and rectangles
The document discusses calculating the surface areas of various 3D shapes like cubes, rectangular prisms, and groups of rectangular prisms. It provides examples of adding the surface areas and subtracting overlapping areas. There is also homework assigned that includes mid-unit review problems on finding square roots and decimals with square roots between given numbers.
03linepyth
1. The class outline discusses different number ranges for facts tests, suggesting levels of practice needed based on scores, and reviews homework questions and material from previous lessons.
2. Two new topics are introduced: the Pythagorean theorem and square roots/number lines.
3. Students will work in groups, generating math questions for other groups and completing a journal entry reflecting on square roots.
01 intro, stories, perfect square and approximates
The document discusses perfect squares and their approximations using fractions. It provides examples of perfect squares up to 7 x 7 = 49 and asks what perfect square is between 36 and 49. It also asks whether fractions can represent perfect squares.
06 non-misleading graphs
This short document discusses stacking numbers and questions why certain things are okay. It contains 4 short paragraphs with questions about stacking numbers, and questioning why some things are acceptable without providing any other context.
04 notes from working period
The document instructs students to break into groups of 3. Each group will choose 5 challenging questions from pages 18-19, including 3 parts of each question. Groups will then give their selected questions to another group to answer.
10 quadratics
This document contains information about quadratic functions and graphs. It defines the key characteristics of quadratic functions, including that their graphs are parabolas that can open up or down depending on the sign of the leading coefficient. It explains that parabolas can have 0, 1, or 2 x-intercepts, and discusses how to find the vertex and axis of symmetry for a quadratic function. The document provides examples and illustrations to explain these concepts.
C:\fakepath-2 1.1 part 2 squares and perfect squares
There are no perfect squares between 36 and 49. The square root of 42.25 is 6.5, which is a terminating decimal, not a perfect square. This document discusses memorizing math facts, the inverse relationship between squaring and square root, and provides tips for simplifying fractions containing square roots, such as dividing the top and bottom by common factors.
07 intro to calc and nonlinear
This document contains instructions for an assignment that is due on September 28th. It includes directions on how to set window settings and graph different equations using a calculator to create scatter plots from tables of x and y values. The document distinguishes between linear and non-linear equations and discusses using cut and graph to identify different types of relationships represented by discrete and continuous data. It concludes by reminding the reader of the due date and noting that tomorrow's class will include working on the assignment.
05 review of 1 and 2
The document discusses properties of squares, including that the area of a square is defined as the length of one side multiplied by itself. It notes that every number has a square and square root, and explores perfect squares versus non-perfect squares. Examples are provided of finding the square of numbers and taking the square root of numbers.
04time
The document outlines a class on math facts and provides guidance for students scoring below certain thresholds on fact tests to work on difficult areas like division, multiplication and subtraction using practice files with motivators like parental notification, prizes, or deadlines. It also reviews blog content, digital ethics, and asks homework questions about graphing, discrete vs continuous variables, and choosing assignment questions due on Wednesday.
03 types of graphs and homework
This document contains information about building things and different types of graphs. It discusses the need to memorize math facts, population pyramids, stacked bar graphs showing different musical instruments, line graphs, and assigning homework questions from a textbook. Students are also asked to discuss questions in groups and one will be chosen to report back to the class.
05 misleading graphs
Here are three potential misleading graphs based on made-up statistics:
1. Bar graph of average Rubik's Cube solving times:
- The y-axis only goes from 20-30 seconds to make my time of 25 seconds look significantly better than my friend's time of 28 seconds.
2. Line graph of number of Justin Bieber concerts attended:
- It only shows the years I attended concerts (3 times) and leaves out the other years my friend attended more (makes it look like I'm the bigger fan).
3. Pie chart of marks in different classes:
- It combines the marks for all my core classes into one slice so it looks like the biggest part of my grades, hiding that I
2013.12.01 sermon only
The document discusses passages from the Bible about Jesus and his role in bringing good news and salvation to humanity. It contrasts waiting and proclaiming the message alone versus doing so together. In the end, it states that for Advent, we will wait for and proclaim the miracle of Jesus together rather than alone.
C:\Fakepath-7 Surface Area 2
Put your name, date, and "Squares Quiz" in the specified locations on a piece of paper. The document provides instructions for two quizzes on surface area of rectangular prisms, including adding and subtracting overlapping areas of different views. Students have 5 minutes to work on each quiz and must show their work. Tomorrow's class will involve working on questions from section 1.3 of the textbook, with one question due on Wednesday.
09 amazing race
This activity aimed to challenge all students by having them calculate surface areas, where common mistakes could be made in the calculations. The teacher reminds that the goal was for everyone to feel challenged at some point, and not everyone was expected to get all the answers correct. Students were asked to reflect on what the most likely mistake is in surface area calculations and their thoughts on the activity.
09 exponential
This document summarizes a story about three boys named Kyle, Randy and Skyler who released 200 ants into their school's football team locker room in an attempt to disrupt their performance in an upcoming game. It provides exercises to calculate the growth of the ant population over time based on the information given that the ant population triples every 10 days. It asks the reader to create a table showing the population after certain time intervals, find the exponential growth equation relating population to time, and use that to determine if there will be enough ants 48 days later to successfully "throw off" the team, where the threshold for that is 3000 ants. It then provides instructions for homework due on a specified date that students need to complete problems from certain pages
04b interpolation and extrapolation
This short document discusses two statistical techniques but provides no examples or details about them. Interpolation is mentioned but not described, while extrapolation is mentioned but given no explanatory text. In just two lines and without any context or examples, the document does not provide enough information to form a concise 3-sentence summary.
02 types of graphs
A bar graph displays categorical data using rectangular bars of varying heights, while a line graph uses points connected by lines to show how a variable changes over a continuous independent variable like time. A histogram is similar to a bar graph but depicts a continuous variable's frequency distribution by dividing its range into bins of equal size, with the height of each bar corresponding to the number of observations in that bin's range.
Facts speeddrillmaster
Math Facts Speed Drill - works for Addition, Subtraction and Multiplication (not Division)
The History of Stoke Newington Street Names
Presented at the Stoke Newington Literary Festival on 9th June 2024
www.StokeNewingtonHistory.com
Advanced Java[Extra Concepts, Not Difficult].docx
This is part 2 of my Java Learning Journey. This contains Hashing, ArrayList, LinkedList, Date and Time Classes, Calendar Class and more.
Executive Directors Chat Leveraging AI for Diversity, Equity, and Inclusion
Let’s explore the intersection of technology and equity in the final session of our DEI series. Discover how AI tools, like ChatGPT, can be used to support and enhance your nonprofit's DEI initiatives. Participants will gain insights into practical AI applications and get tips for leveraging technology to advance their DEI goals.
More Related Content
Viewers also liked
04 notes from working period
The document instructs students to break into groups of 3. Each group will choose 5 challenging questions from pages 18-19, including 3 parts of each question. Groups will then give their selected questions to another group to answer.
10 quadratics
This document contains information about quadratic functions and graphs. It defines the key characteristics of quadratic functions, including that their graphs are parabolas that can open up or down depending on the sign of the leading coefficient. It explains that parabolas can have 0, 1, or 2 x-intercepts, and discusses how to find the vertex and axis of symmetry for a quadratic function. The document provides examples and illustrations to explain these concepts.
C:\fakepath-2 1.1 part 2 squares and perfect squares
There are no perfect squares between 36 and 49. The square root of 42.25 is 6.5, which is a terminating decimal, not a perfect square. This document discusses memorizing math facts, the inverse relationship between squaring and square root, and provides tips for simplifying fractions containing square roots, such as dividing the top and bottom by common factors.
07 intro to calc and nonlinear
This document contains instructions for an assignment that is due on September 28th. It includes directions on how to set window settings and graph different equations using a calculator to create scatter plots from tables of x and y values. The document distinguishes between linear and non-linear equations and discusses using cut and graph to identify different types of relationships represented by discrete and continuous data. It concludes by reminding the reader of the due date and noting that tomorrow's class will include working on the assignment.
05 review of 1 and 2
The document discusses properties of squares, including that the area of a square is defined as the length of one side multiplied by itself. It notes that every number has a square and square root, and explores perfect squares versus non-perfect squares. Examples are provided of finding the square of numbers and taking the square root of numbers.
04time
The document outlines a class on math facts and provides guidance for students scoring below certain thresholds on fact tests to work on difficult areas like division, multiplication and subtraction using practice files with motivators like parental notification, prizes, or deadlines. It also reviews blog content, digital ethics, and asks homework questions about graphing, discrete vs continuous variables, and choosing assignment questions due on Wednesday.
03 types of graphs and homework
This document contains information about building things and different types of graphs. It discusses the need to memorize math facts, population pyramids, stacked bar graphs showing different musical instruments, line graphs, and assigning homework questions from a textbook. Students are also asked to discuss questions in groups and one will be chosen to report back to the class.
05 misleading graphs
Here are three potential misleading graphs based on made-up statistics:
1. Bar graph of average Rubik's Cube solving times:
- The y-axis only goes from 20-30 seconds to make my time of 25 seconds look significantly better than my friend's time of 28 seconds.
2. Line graph of number of Justin Bieber concerts attended:
- It only shows the years I attended concerts (3 times) and leaves out the other years my friend attended more (makes it look like I'm the bigger fan).
3. Pie chart of marks in different classes:
- It combines the marks for all my core classes into one slice so it looks like the biggest part of my grades, hiding that I
2013.12.01 sermon only
The document discusses passages from the Bible about Jesus and his role in bringing good news and salvation to humanity. It contrasts waiting and proclaiming the message alone versus doing so together. In the end, it states that for Advent, we will wait for and proclaim the miracle of Jesus together rather than alone.
C:\Fakepath-7 Surface Area 2
Put your name, date, and "Squares Quiz" in the specified locations on a piece of paper. The document provides instructions for two quizzes on surface area of rectangular prisms, including adding and subtracting overlapping areas of different views. Students have 5 minutes to work on each quiz and must show their work. Tomorrow's class will involve working on questions from section 1.3 of the textbook, with one question due on Wednesday.
09 amazing race
This activity aimed to challenge all students by having them calculate surface areas, where common mistakes could be made in the calculations. The teacher reminds that the goal was for everyone to feel challenged at some point, and not everyone was expected to get all the answers correct. Students were asked to reflect on what the most likely mistake is in surface area calculations and their thoughts on the activity.
Viewers also liked (11)
C:\fakepath-2 1.1 part 2 squares and perfect squares
C:\fakepath-2 1.1 part 2 squares and perfect squares
More from bplett
09 exponential
This document summarizes a story about three boys named Kyle, Randy and Skyler who released 200 ants into their school's football team locker room in an attempt to disrupt their performance in an upcoming game. It provides exercises to calculate the growth of the ant population over time based on the information given that the ant population triples every 10 days. It asks the reader to create a table showing the population after certain time intervals, find the exponential growth equation relating population to time, and use that to determine if there will be enough ants 48 days later to successfully "throw off" the team, where the threshold for that is 3000 ants. It then provides instructions for homework due on a specified date that students need to complete problems from certain pages
04b interpolation and extrapolation
This short document discusses two statistical techniques but provides no examples or details about them. Interpolation is mentioned but not described, while extrapolation is mentioned but given no explanatory text. In just two lines and without any context or examples, the document does not provide enough information to form a concise 3-sentence summary.
02 types of graphs
A bar graph displays categorical data using rectangular bars of varying heights, while a line graph uses points connected by lines to show how a variable changes over a continuous independent variable like time. A histogram is similar to a bar graph but depicts a continuous variable's frequency distribution by dividing its range into bins of equal size, with the height of each bar corresponding to the number of observations in that bin's range.
Facts speeddrillmaster
Math Facts Speed Drill - works for Addition, Subtraction and Multiplication (not Division)
More from bplett (8)
Recently uploaded
The History of Stoke Newington Street Names
Presented at the Stoke Newington Literary Festival on 9th June 2024
www.StokeNewingtonHistory.com
Advanced Java[Extra Concepts, Not Difficult].docx
This is part 2 of my Java Learning Journey. This contains Hashing, ArrayList, LinkedList, Date and Time Classes, Calendar Class and more.
Executive Directors Chat Leveraging AI for Diversity, Equity, and Inclusion
Let’s explore the intersection of technology and equity in the final session of our DEI series. Discover how AI tools, like ChatGPT, can be used to support and enhance your nonprofit's DEI initiatives. Participants will gain insights into practical AI applications and get tips for leveraging technology to advance their DEI goals.
Pollock and Snow "DEIA in the Scholarly Landscape, Session One: Setting Expec...
Pollock and Snow "DEIA in the Scholarly Landscape, Session One: Setting Expec...National Information Standards Organization (NISO)
This presentation was provided by Steph Pollock of The American Psychological Association’s Journals Program, and Damita Snow, of The American Society of Civil Engineers (ASCE), for the initial session of NISO's 2024 Training Series "DEIA in the Scholarly Landscape." Session One: 'Setting Expectations: a DEIA Primer,' was held June 6, 2024.The Diamonds of 2023-2024 in the IGRA collection
A review of the growth of the Israel Genealogy Research Association Database Collection for the last 12 months. Our collection is now passed the 3 million mark and still growing. See which archives have contributed the most. See the different types of records we have, and which years have had records added. You can also see what we have for the future.
Hindi varnamala | hindi alphabet PPT.pdf
हिंदी वर्णमाला पीपीटी, hindi alphabet PPT presentation, hindi varnamala PPT, Hindi Varnamala pdf, हिंदी स्वर, हिंदी व्यंजन, sikhiye hindi varnmala, dr. mulla adam ali, hindi language and literature, hindi alphabet with drawing, hindi alphabet pdf, hindi varnamala for childrens, hindi language, hindi varnamala practice for kids, https://www.drmullaadamali.com
How to Fix the Import Error in the Odoo 17
An import error occurs when a program fails to import a module or library, disrupting its execution. In languages like Python, this issue arises when the specified module cannot be found or accessed, hindering the program's functionality. Resolving import errors is crucial for maintaining smooth software operation and uninterrupted development processes.
BÀI TẬP BỔ TRỢ TIẾNG ANH 8 CẢ NĂM - GLOBAL SUCCESS - NĂM HỌC 2023-2024 (CÓ FI...
BÀI TẬP BỔ TRỢ TIẾNG ANH 8 CẢ NĂM - GLOBAL SUCCESS - NĂM HỌC 2023-2024 (CÓ FI...Nguyen Thanh Tu Collection
https://app.box.com/s/y977uz6bpd3af4qsebv7r9b7s21935vdPCOS corelations and management through Ayurveda.
This presentation includes basic of PCOS their pathology and treatment and also Ayurveda correlation of PCOS and Ayurvedic line of treatment mentioned in classics.
BBR 2024 Summer Sessions Interview Training
Qualitative research interview training by Professor Katrina Pritchard and Dr Helen Williams
How to Manage Your Lost Opportunities in Odoo 17 CRM
Odoo 17 CRM allows us to track why we lose sales opportunities with "Lost Reasons." This helps analyze our sales process and identify areas for improvement. Here's how to configure lost reasons in Odoo 17 CRM
What is Digital Literacy? A guest blog from Andy McLaughlin, University of Ab...
What is Digital Literacy? A guest blog from Andy McLaughlin, University of Aberdeen
Azure Interview Questions and Answers PDF By ScholarHat
Azure Interview Questions and Answers PDF By ScholarHat
Recently uploaded (20)
Executive Directors Chat Leveraging AI for Diversity, Equity, and Inclusion
Executive Directors Chat Leveraging AI for Diversity, Equity, and Inclusion
Pollock and Snow "DEIA in the Scholarly Landscape, Session One: Setting Expec...
Pollock and Snow "DEIA in the Scholarly Landscape, Session One: Setting Expec...
Film vocab for eal 3 students: Australia the movie
Film vocab for eal 3 students: Australia the movie
Pride Month Slides 2024 David Douglas School District
Pride Month Slides 2024 David Douglas School District
BÀI TẬP BỔ TRỢ TIẾNG ANH 8 CẢ NĂM - GLOBAL SUCCESS - NĂM HỌC 2023-2024 (CÓ FI...
BÀI TẬP BỔ TRỢ TIẾNG ANH 8 CẢ NĂM - GLOBAL SUCCESS - NĂM HỌC 2023-2024 (CÓ FI...
How to Manage Your Lost Opportunities in Odoo 17 CRM
How to Manage Your Lost Opportunities in Odoo 17 CRM
What is Digital Literacy? A guest blog from Andy McLaughlin, University of Ab...
What is Digital Literacy? A guest blog from Andy McLaughlin, University of Ab...
Azure Interview Questions and Answers PDF By ScholarHat
Azure Interview Questions and Answers PDF By ScholarHat
04 notes from working period
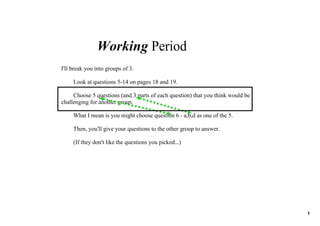
- 1. Working Period I'll break you into groups of 3. Look at questions 514 on pages 18 and 19. Choose 5 questions (and 3 parts of each question) that you think would be challenging for another group. What I mean is you might choose question 6 a,b,d as one of the 5. Then, you'll give your questions to the other group to answer. (If they don't like the questions you picked...) 1
- 2. 2
- 3. 3
- 4. 4
- 5. 5
- 6. 6