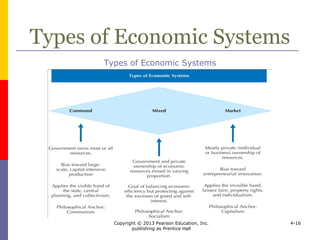
Copyright © 2013 Pearson Education, Inc.
publishing as Prentice Hall
4-1
Chapter 4
The Economic
Environments Facing
Business
Copyright © 2013 Pearson Education, Inc.
publishing as Prentice Hall
4-2
Learning Objectives
 To communicate the importance of
economic analysis
 To discuss the idea of economic freedom
 To profile the characteristics of the types
of economic systems
 To introduce the notion of state capitalism
 To profile indicators of economic
development, performance, and potential
Copyright © 2013 Pearson Education, Inc.
publishing as Prentice Hall
4-3
Introduction
Learning Objective 1:
To communicate the importance of
economic analysis
Copyright © 2013 Pearson Education, Inc.
publishing as Prentice Hall
4-4
Introduction
 Managers assess a country’s economic
environment knowing
 Countries differ in different ways
 Economic and political changes alter market
circumstances
 It is important to understand connections,
change, and consequences
 The challenges of the comeback
 Choices of citizens, policymakers, and
institutions
Copyright © 2013 Pearson Education, Inc.
publishing as Prentice Hall
4-5
International
Economic Analysis
 A universal assessment of economic
environments is difficult because
 it is difficult to stipulate a definitive set of
indicators to estimate the performance and
potential of a country’s economy
 today’s set of perfect measures may prove
imperfect tomorrow
 interdependencies complicate interpreting the
relationship among elements of the economic
environment
Copyright © 2013 Pearson Education, Inc.
publishing as Prentice Hall
4-6
International
Economic Analysis
Economic Factors Affecting International Business Operations
Copyright © 2013 Pearson Education, Inc.
publishing as Prentice Hall
4-7
Economic Freedom
Learning Objective 2:
To discuss the idea of economic freedom
Copyright © 2013 Pearson Education, Inc.
publishing as Prentice Hall
4-8
Economic Freedom
 Economic freedom – people have the
right to work, produce, consume, save,
and invest the way they prefer
 measured across business freedom, monetary
freedom, fiscal freedom, investment freedom,
freedom from corruption, property rights, trade
freedom, government size, financial freedom,
and labor freedom
Copyright © 2013 Pearson Education, Inc.
publishing as Prentice Hall
4-9
Economic Freedom
Economic Freedom by Region, with Population
Copyright © 2013 Pearson Education, Inc.
publishing as Prentice Hall
4-10
Economic Freedom
Global Distribution of Economic Freedom
Copyright © 2013 Pearson Education, Inc.
publishing as Prentice Hall
4-11
Value of Economic Freedom
 Economic freedom affects
 Growth rates
 Productivity
 Income levels
 Inflation
 Employment
 Life expectancy
 Literacy
 Political openness
 Environmental sustainability
Copyright © 2013 Pearson Education, Inc.
publishing as Prentice Hall
4-12
Trends in Economic Freedom
 The trend toward increased economic
freedom is no longer certain
 Questions about the legitimacy of free markets
 The benefits of more state control
Copyright © 2013 Pearson Education, Inc.
publishing as Prentice Hall
4-13
Types of Economic Systems
Learning Objective 3:
To profile the characteristics of the types
of economic systems
Copyright © 2013 Pearson Education, Inc.
publishing as Prentice Hall
4-14
Types of Economic Systems
 An economic system refers to the
mechanism that deals with the production,
distribution, and consumption of goods
and services
 Types
 Market economy
 Command economy
 Mixed economy
Copyright © 2013 Pearson Education, Inc.
publishing as Prentice Hall
4-15
Types of Economic Systems
Copyright © 2013 Pearson Education, Inc.
publishing as Prentice Hall
4-16
Market Economy
 In a market economy individuals rather
than governments make most economic
decisions
 Capitalism
 private ownership of capital
 Laissez-faire
 governmental noninterference in economic
affairs
Copyright © 2013 Pearson Education, Inc.
publishing as Prentice Hall
4-17
Command Economy
Learning Objective 4:
To introduce the notion of state
capitalism
Copyright © 2013 Pearson Education, Inc.
publishing as Prentice Hall
4-18
Command Economy
 In a command economy the visible hand
of the state supersedes the invisible hand
of individuals
 Government
 owns and controls resources
 determines prices
 Communism
Copyright © 2013 Pearson Education, Inc.
publishing as Prentice Hall
4-19
Mixed Economy
 Most economies are mixed economies
 fall between market and command economies
 Socialism
 regulate economic activity with a focus on
social equality and a fair distribution of wealth
Copyright © 2013 Pearson Education, Inc.
publishing as Prentice Hall
4-20
State Capitalism:
Detour or Destination?
 State capitalism refers to a system in
which the government explicitly
manipulates market outcomes for political
purposes
 promote certain industries to encourage
economic development
 develop national companies into global leaders
 foreign companies restricted from strategic
industries
Copyright © 2013 Pearson Education, Inc.
publishing as Prentice Hall
4-21
Economic Development,
Performance, and Potential
Learning Objective 5:
To profile indicators of economic
development, performance, and potential
Copyright © 2013 Pearson Education, Inc.
publishing as Prentice Hall
4-22
Economic Development,
Performance, and Potential
 Broad classes of countries include
 developing countries
 largest number of countries
 low per capita income
 emerging economies
 fast growing, relatively prosperous
 BRICs – Brazil, Russia, India, and China
 developed countries
 high per capita income and standard of
living
 like the U.S., Japan, France, Australia
Copyright © 2013 Pearson Education, Inc.
publishing as Prentice Hall
4-23
Gross National Income
 Gross national income (GNI)
 the broadest measure of economic activity for
a country
 Gross national product (GDP)
 the total value of all final goods and services
produced within a nation in a particular year
 Gross domestic product (GDP)
 the total market value of goods and services
produced by workers and capital within a
nation’s borders
Copyright © 2013 Pearson Education, Inc.
publishing as Prentice Hall
4-24
Improving Analysis
 GNI data should be adjusted for
 the growth rate of the economy
 the number of people in a country
 the local cost of living
Copyright © 2013 Pearson Education, Inc.
publishing as Prentice Hall
4-25
Improving Analysis
GNI per capita, 2009
Copyright © 2013 Pearson Education, Inc.
publishing as Prentice Hall
4-26
Improving Analysis
GNI per capita adjusted for Purchasing Power Parity
Copyright © 2013 Pearson Education, Inc.
publishing as Prentice Hall
4-27
Broader Conceptions of
Performance and Potential
 Green economics
 gauge economic performance in terms of the
effect of current choices on long-term
sustainability
 Sustainable development
 meet the needs of the present without
compromising the ability of future generations
to meet their own needs
 Happynomics
 importance of emotional prosperity in addition
to financial prosperity
Copyright © 2013 Pearson Education, Inc.
publishing as Prentice Hall
4-28
Features of an Economy
 Managers should also consider
 Inflation
 Unemployment
 Debt
 Income distribution
 Poverty
 Balance of payments
Copyright © 2013 Pearson Education, Inc.
publishing as Prentice Hall
4-29
Inflation
 Inflation
 a measure of the increase in the cost of living
 Deflation
 when prices for products go down not up
 Reflation
 increase the money supply and reduce taxes to
accelerate economic activity
Copyright © 2013 Pearson Education, Inc.
publishing as Prentice Hall
4-30
Unemployment
 Unemployment rate
 share of unemployed workers seeking
employment for pay relative to the total civilian
labor force
 Misery index
 the sum of a country’s inflation and
unemployment rates
Copyright © 2013 Pearson Education, Inc.
publishing as Prentice Hall
4-31
Debt
 Debt
 the total of a government’s financial
obligations
 internal debt
 external debt
 Growing public debt signals
 tax increases
 reduced growth
 rising inflation
 increasing austerity
Copyright © 2013 Pearson Education, Inc.
publishing as Prentice Hall
4-32
Income Distribution
 Income distribution
 estimates the proportion of the population that
earns various levels of income
 Gini coefficient
 measures the extent to which the distribution
of resources deviates from a perfectly equal
distribution
Copyright © 2013 Pearson Education, Inc.
publishing as Prentice Hall
4-33
Poverty
 Poverty the state of having little or no
money and few or no material possessions
 extreme poverty
 less than $1.25 per day
 moderate poverty
 less than $2.00 per day
 Today the world population is 80% poor,
10% middle income, and 10% rich
 Base of the Pyramid
 Frugal engineering
Copyright © 2013 Pearson Education, Inc.
publishing as Prentice Hall
4-34
Balance of Payments
 Balance of payments
 reports a country’s trade and financial
transactions with the rest of the world
 Current account
 tracks merchandise trade
 Capital account
 tracks loans given to foreigners and loans
received by citizens
Copyright © 2013 Pearson Education, Inc.
publishing as Prentice Hall
4-35
Balance of Payments
Components of a Country’s Balance of Payments
Copyright © 2013 Pearson Education, Inc.
publishing as Prentice Hall
4-36
Balance of Payments
Current Account Balances: The Top and Bottom Five
Copyright © 2013 Pearson Education, Inc.
publishing as Prentice Hall
4-37
All rights reserved. No part of this publication may be reproduced, stored in
a retrieval system, or transmitted, in any form or by any means, electronic,
mechanical, photocopying, recording, or otherwise, without the prior
written permission of the publisher. Printed in the United States of America.

04 The Economic Environments Facing Business

  • 1.
    Copyright © 2013Pearson Education, Inc. publishing as Prentice Hall 4-1 Chapter 4 The Economic Environments Facing Business
  • 2.
    Copyright © 2013Pearson Education, Inc. publishing as Prentice Hall 4-2 Learning Objectives  To communicate the importance of economic analysis  To discuss the idea of economic freedom  To profile the characteristics of the types of economic systems  To introduce the notion of state capitalism  To profile indicators of economic development, performance, and potential
  • 3.
    Copyright © 2013Pearson Education, Inc. publishing as Prentice Hall 4-3 Introduction Learning Objective 1: To communicate the importance of economic analysis
  • 4.
    Copyright © 2013Pearson Education, Inc. publishing as Prentice Hall 4-4 Introduction  Managers assess a country’s economic environment knowing  Countries differ in different ways  Economic and political changes alter market circumstances  It is important to understand connections, change, and consequences  The challenges of the comeback  Choices of citizens, policymakers, and institutions
  • 5.
    Copyright © 2013Pearson Education, Inc. publishing as Prentice Hall 4-5 International Economic Analysis  A universal assessment of economic environments is difficult because  it is difficult to stipulate a definitive set of indicators to estimate the performance and potential of a country’s economy  today’s set of perfect measures may prove imperfect tomorrow  interdependencies complicate interpreting the relationship among elements of the economic environment
  • 6.
    Copyright © 2013Pearson Education, Inc. publishing as Prentice Hall 4-6 International Economic Analysis Economic Factors Affecting International Business Operations
  • 7.
    Copyright © 2013Pearson Education, Inc. publishing as Prentice Hall 4-7 Economic Freedom Learning Objective 2: To discuss the idea of economic freedom
  • 8.
    Copyright © 2013Pearson Education, Inc. publishing as Prentice Hall 4-8 Economic Freedom  Economic freedom – people have the right to work, produce, consume, save, and invest the way they prefer  measured across business freedom, monetary freedom, fiscal freedom, investment freedom, freedom from corruption, property rights, trade freedom, government size, financial freedom, and labor freedom
  • 9.
    Copyright © 2013Pearson Education, Inc. publishing as Prentice Hall 4-9 Economic Freedom Economic Freedom by Region, with Population
  • 10.
    Copyright © 2013Pearson Education, Inc. publishing as Prentice Hall 4-10 Economic Freedom Global Distribution of Economic Freedom
  • 11.
    Copyright © 2013Pearson Education, Inc. publishing as Prentice Hall 4-11 Value of Economic Freedom  Economic freedom affects  Growth rates  Productivity  Income levels  Inflation  Employment  Life expectancy  Literacy  Political openness  Environmental sustainability
  • 12.
    Copyright © 2013Pearson Education, Inc. publishing as Prentice Hall 4-12 Trends in Economic Freedom  The trend toward increased economic freedom is no longer certain  Questions about the legitimacy of free markets  The benefits of more state control
  • 13.
    Copyright © 2013Pearson Education, Inc. publishing as Prentice Hall 4-13 Types of Economic Systems Learning Objective 3: To profile the characteristics of the types of economic systems
  • 14.
    Copyright © 2013Pearson Education, Inc. publishing as Prentice Hall 4-14 Types of Economic Systems  An economic system refers to the mechanism that deals with the production, distribution, and consumption of goods and services  Types  Market economy  Command economy  Mixed economy
  • 15.
    Copyright © 2013Pearson Education, Inc. publishing as Prentice Hall 4-15 Types of Economic Systems Types of Economic Systems
  • 16.
    Copyright © 2013Pearson Education, Inc. publishing as Prentice Hall 4-16 Market Economy  In a market economy individuals rather than governments make most economic decisions  Capitalism  private ownership of capital  Laissez-faire  governmental noninterference in economic affairs
  • 17.
    Copyright © 2013Pearson Education, Inc. publishing as Prentice Hall 4-17 Command Economy Learning Objective 4: To introduce the notion of state capitalism
  • 18.
    Copyright © 2013Pearson Education, Inc. publishing as Prentice Hall 4-18 Command Economy  In a command economy the visible hand of the state supersedes the invisible hand of individuals  Government  owns and controls resources  determines prices  Communism
  • 19.
    Copyright © 2013Pearson Education, Inc. publishing as Prentice Hall 4-19 Mixed Economy  Most economies are mixed economies  fall between market and command economies  Socialism  regulate economic activity with a focus on social equality and a fair distribution of wealth
  • 20.
    Copyright © 2013Pearson Education, Inc. publishing as Prentice Hall 4-20 State Capitalism: Detour or Destination?  State capitalism refers to a system in which the government explicitly manipulates market outcomes for political purposes  promote certain industries to encourage economic development  develop national companies into global leaders  foreign companies restricted from strategic industries
  • 21.
    Copyright © 2013Pearson Education, Inc. publishing as Prentice Hall 4-21 Economic Development, Performance, and Potential Learning Objective 5: To profile indicators of economic development, performance, and potential
  • 22.
    Copyright © 2013Pearson Education, Inc. publishing as Prentice Hall 4-22 Economic Development, Performance, and Potential  Broad classes of countries include  developing countries  largest number of countries  low per capita income  emerging economies  fast growing, relatively prosperous  BRICs – Brazil, Russia, India, and China  developed countries  high per capita income and standard of living  like the U.S., Japan, France, Australia
  • 23.
    Copyright © 2013Pearson Education, Inc. publishing as Prentice Hall 4-23 Gross National Income  Gross national income (GNI)  the broadest measure of economic activity for a country  Gross national product (GDP)  the total value of all final goods and services produced within a nation in a particular year  Gross domestic product (GDP)  the total market value of goods and services produced by workers and capital within a nation’s borders
  • 24.
    Copyright © 2013Pearson Education, Inc. publishing as Prentice Hall 4-24 Improving Analysis  GNI data should be adjusted for  the growth rate of the economy  the number of people in a country  the local cost of living
  • 25.
    Copyright © 2013Pearson Education, Inc. publishing as Prentice Hall 4-25 Improving Analysis GNI per capita, 2009
  • 26.
    Copyright © 2013Pearson Education, Inc. publishing as Prentice Hall 4-26 Improving Analysis GNI per capita adjusted for Purchasing Power Parity
  • 27.
    Copyright © 2013Pearson Education, Inc. publishing as Prentice Hall 4-27 Broader Conceptions of Performance and Potential  Green economics  gauge economic performance in terms of the effect of current choices on long-term sustainability  Sustainable development  meet the needs of the present without compromising the ability of future generations to meet their own needs  Happynomics  importance of emotional prosperity in addition to financial prosperity
  • 28.
    Copyright © 2013Pearson Education, Inc. publishing as Prentice Hall 4-28 Features of an Economy  Managers should also consider  Inflation  Unemployment  Debt  Income distribution  Poverty  Balance of payments
  • 29.
    Copyright © 2013Pearson Education, Inc. publishing as Prentice Hall 4-29 Inflation  Inflation  a measure of the increase in the cost of living  Deflation  when prices for products go down not up  Reflation  increase the money supply and reduce taxes to accelerate economic activity
  • 30.
    Copyright © 2013Pearson Education, Inc. publishing as Prentice Hall 4-30 Unemployment  Unemployment rate  share of unemployed workers seeking employment for pay relative to the total civilian labor force  Misery index  the sum of a country’s inflation and unemployment rates
  • 31.
    Copyright © 2013Pearson Education, Inc. publishing as Prentice Hall 4-31 Debt  Debt  the total of a government’s financial obligations  internal debt  external debt  Growing public debt signals  tax increases  reduced growth  rising inflation  increasing austerity
  • 32.
    Copyright © 2013Pearson Education, Inc. publishing as Prentice Hall 4-32 Income Distribution  Income distribution  estimates the proportion of the population that earns various levels of income  Gini coefficient  measures the extent to which the distribution of resources deviates from a perfectly equal distribution
  • 33.
    Copyright © 2013Pearson Education, Inc. publishing as Prentice Hall 4-33 Poverty  Poverty the state of having little or no money and few or no material possessions  extreme poverty  less than $1.25 per day  moderate poverty  less than $2.00 per day  Today the world population is 80% poor, 10% middle income, and 10% rich  Base of the Pyramid  Frugal engineering
  • 34.
    Copyright © 2013Pearson Education, Inc. publishing as Prentice Hall 4-34 Balance of Payments  Balance of payments  reports a country’s trade and financial transactions with the rest of the world  Current account  tracks merchandise trade  Capital account  tracks loans given to foreigners and loans received by citizens
  • 35.
    Copyright © 2013Pearson Education, Inc. publishing as Prentice Hall 4-35 Balance of Payments Components of a Country’s Balance of Payments
  • 36.
    Copyright © 2013Pearson Education, Inc. publishing as Prentice Hall 4-36 Balance of Payments Current Account Balances: The Top and Bottom Five
  • 37.
    Copyright © 2013Pearson Education, Inc. publishing as Prentice Hall 4-37 All rights reserved. No part of this publication may be reproduced, stored in a retrieval system, or transmitted, in any form or by any means, electronic, mechanical, photocopying, recording, or otherwise, without the prior written permission of the publisher. Printed in the United States of America.

Editor's Notes

  • #2 Chapter 4: The Economic Environments Facing Business
  • #3 The learning objectives for this chapter are To communicate the importance of economic analysis To discuss the idea of economic freedom To profile the characteristics of the types of economic systems To introduce the notion of state capitalism To profile indicators of economic development, performance, and potential
  • #4 Learning Objective 1: To communicate the importance of economic analysis.
  • #5 Managers study economic environments to estimate how market trends and government policy influence the performance of their companies. A country’s economic policies are a leading indicator of a government’s goals and its planned use of economic tools and market reforms. Managers should study a country’s economic environment to assess its development, explain its performance, and estimate its potential. Managers do this knowing countries differ in different ways, economic and political changes alter market circumstances, that it’s critical to make connections between events and predict the consequences of changes, the challenges of the comeback, and choices of citizens, policymakers, and institutions.
  • #6 Determining which countries warrant investment is not easy. It’s very difficult to assess the potential of a country because any type of assessment relies on behavioral assumptions as well as more scientific principles. There are some 208 discrete economic environments in the world today. Managers need to narrow them down and identify exactly which countries offer the greatest potential return for the least risk.
  • #7 This Figure shows the economic factors affecting international business environments. The Figure highlights the importance of applying a systems perspective - linkages among elements mean that change in one element in the economy affects other parts.
  • #8 Learning Objective 2: To discuss the idea of economic freedom.
  • #9 So, it’s important for managers to monitor a range of economic issues, but perhaps most important is an assessment of economic freedom, or what a manager has the freedom to do. Economic freedom reflects the absence of government coercion or constraint on the production, distribution, or consumption of goods and services beyond the extent necessary for citizens to protect and maintain liberty. In some countries these freedoms are taken for granted, while in others they are rare. Economic freedom advanced in 2011. As you might expect, it tends to be higher in Western countries and lower in Eastern countries.
  • #10 This Figure shows economic freedom by region. Notice that most people in the world live in countries with lower degrees of economic freedom.
  • #11 This Map profiles economic freedom around the world. Notice that the most free countries include Hong Kong, Singapore, Australia, and Canada. The United States is only considered mostly free because of increased government spending, debt, and regulations. North Korea, Cuba, and Venezuela are among the least free economies.
  • #12 Why is economic freedom important? Countries with economic freedom typically have higher per capita income, standards of living, and social stability as compared to less free countries.
  • #13 For the last few decades, managers generally assumed that economic freedom would increase. However, the recent global financial crisis combined with a resurgence of government intervention has made this assumption questionable. The notion of free markets is losing support in some countries. Governments are now intervening in markets to implement safeguards to protect against a repeat of the recent financial crisis. This intervention of course then limits economic freedom.
  • #14 Learning Objective 3: To profile the characteristics of the types of economic systems.
  • #15 Managers can explore a country’s economic system to understand how the host government regulates the economy, protects property rights, sets fiscal and monetary policies, and enforces antitrust regulation. There are three main types of economic systems: market, command, and mixed economies.
  • #16 This Figure shows the different types of economic systems.
  • #17 In market economies private interests own resources, and prices determine supply and demand. While there is generally an attitude of laissez-faire the invisible hand does become more visible at times because of the need to provide public goods and protect society. Market economies maximize economic freedom.
  • #18 Learning Objective 4: To introduce the notion of state capitalism.
  • #19 In a command economy, governments plan what goods and services will be produced, the quantity in which they are produced, and the price at which they are sold. Command economies constrain economic freedom.
  • #20 In a mixed economy, both government and private enterprise influence production, consumption, and savings. This type of economy supports socialism and the notion that the partly visible hand of the government commands and controls some factors of production. Therefore, economic freedom in a mixed economy is regulated.
  • #21 Will free markets prevail or will governments be in control? Many countries today are allowing greater state control. The adoption of state capitalism allows governments to decide how, when, and where assets are valued and resources are allocated. China has been supporting the ideals of state capitalism, and many other countries now see it as an attractive option.
  • #22 Learning Objective 5: To profile indicators of economic development, performance, and potential.
  • #23 Managers need to assess a country’s level of economic development, performance, and potential. Countries can be classified as developing countries, emerging economies, and developed countries.
  • #24 One way managers can assess markets is by looking at gross national income or GNI which measures the value of all production in the domestic economy together with the income the country receives from other countries, less similar payments it has made to other countries. Managers can also look at gross national product or GNP. Conceptually, world GNI and world GNP are the same. Gross domestic product or GDP allows managers to assess countries in which the output of multinationals represents a significant share of activity.
  • #25 It’s important to be careful when using GNI data because it can be misleading. To improve the usefulness of GNI managers should adjust for the growth rate of the economy, the number of people in a country, and the local cost of living.
  • #26 This Map shows GNI figures for 2009. Notice that high income countries are clustered in just a few regions.
  • #27 This Map shows GNI per capita adjusted for purchasing power parity or PPP. PPP provides a method of measuring the relative purchasing power of different countries’ currencies for the same basket of goods and services.
  • #28 In addition to looking at GNI, GNP, and GDP, managers also need to consider sustainability and stability. Green economics allows managers to consider the social and ecological costs of their decisions. The goal should be to create an enabling environment for people to enjoy long, healthy, and happy lives. There is growing criticism of traditional GNI figures as a measure of performance. Research shows that people in rich countries are not significantly happier than people in poor countries. Happynomics focuses on the importance of emotional happiness as a measure of a country’s performance and potential.
  • #29 Managers can also study other features of an economy including inflation, unemployment, debt, income distribution, poverty, and its balance of payments.
  • #30 Chronic inflation usually plagues countries where prices have been rising for prolonged periods of time. Deflation occurs when the general price level of goods and services falls. It’s often caused by a reduction in the money supply or a reduction in credit.
  • #31 The unemployment rate measures the number of workers who want to work but do not have jobs. High unemployment is a warning sign for managers because it symbolizes a government’s ineptitude in managing domestic affairs. Underemployment occurs when people work fewer hours per day than they would prefer or when they work below the level for which they have been trained.
  • #32 Managers can look at a country’s debt to gauge how much a country borrows from its citizens, foreign organizations, foreign governments, and international institutions. When total debt is high the more uncertain an economy’s performance and potential.
  • #33 Managers should also look at income distribution to better understand a market’s performance and potential. One trend that is affecting markets across the globe is the growing gap between rich and poor. Managers can estimate inequalities in income distribution using a Gini coefficient. A score of one indicates that one person has all the income. Most countries range between 25 and 60 percent.
  • #34 Poverty shapes economic environments. While the number of people in extreme poverty in the world has fallen, this figure is misleading because much of the drop has been in a single country, China. Poverty continues to be a problem with as many as 1.2 billion people in poverty. The growth of business and economic progress is dependent on ending poverty. Keep in mind though, that despite being poor, there may still be a market for goods. Some 80 percent of Indians live on less than $2 per day for example, yet there are 700 million cell phone subscribers in the country. The Base of the Pyramid is the largest, but poorest, socioeconomic group in the world who live on less than $2.50 per day. This group may in fact be the future of the global economy prompting the development of frugal engineering which focuses on the needs of poor consumers as a starting point for developing functional, economic products.
  • #35 A country’s balance of payments is a system of monitoring all of a country’s economic transactions with the rest of the world. It reports the country’s trade and financial transactions with the rest of the world. A current account surplus occurs when exports exceed imports, while a current account deficit occurs when imports exceed exports.
  • #36 This Table shows the various components of each account in the balance of payments.
  • #37 This Table shows the countries with the largest current account surpluses and those with the largest current account deficits.