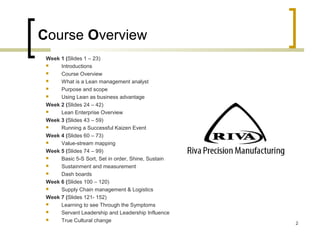
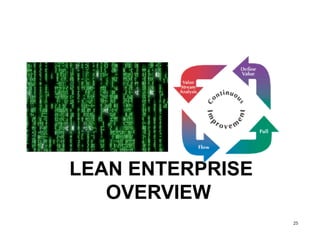
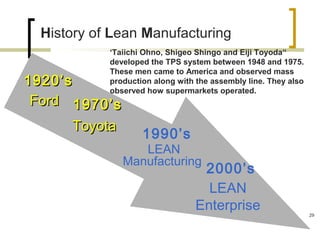
SlideShare a Scribd company logo
Presented by Joe Perillo
RIVA Lean Enterprise Overview
1
Course Overview
Week 1 (Slides 1 – 23)
 Introductions
 Course Overview
 What is a Lean management analyst
 Purpose and scope
 Using Lean as business advantage
Week 2 (Slides 24 – 42)
 Lean Enterprise Overview
Week 3 (Slides 43 – 59)
 Running a Successful Kaizen Event
Week 4 (Slides 60 – 73)
 Value-stream mapping
Week 5 (Slides 74 – 99)
 Basic 5-S Sort, Set in order, Shine, Sustain
 Sustainment and measurement
 Dash boards
Week 6 (Slides 100 – 120)
 Supply Chain management & Logistics
Week 7 (Slides 121- 152)
 Learning to see Through the Symptoms
 Servant Leadership and Leadership Influence
 True Cultural change 2
Recommended
Reading
 Lean Thinking, by Jim Womack
 Becoming Lean, by Jeffrey Liker
 The Machine That Changed the World, by Jim Womack and Daniel T. Jones
 The Goal, by Eli Goldratt
 World Class Manufacturing: The Next Decade, by Richard Schonberger
 All I Need To Know about Manufacturing I learned in Joe’s Garage by William B. Miller Vicki L.
Schenk.
 Good to Great by Jim Collins
 Leadership & the One Minute Manager by Ken Blanchard
 The 21 Irrefutable laws of Leadership By John C. Maxwell
 The 17 Indisputable Laws of Teamwork By John C. Maxwell
 The Servant, a simple story about the true essence of Leadership By James C. Hunter
3
What is a lean Management?
 lean management is
the facilitation of lean
principles by analyzing
a company’s
procedures to increase
safety, capacity and
quality thus improving
profitability through the
elimination of waste.
4
The Lean Thinker
5
Purpose & Scope
 Lean principles offer tangible solutions to
drastically cut waste, thereby improving quality,
productivity and profitability.
 The fundamentals of Lean embrace the
identification and elimination of waste throughout
the entire supply chain, ultimately resulting in a
more efficient business environment.
 This program teaches the fundamentals and
techniques of Lean management, and facilitates
the follow-up skills necessary to achieve successful
results from the shop floor to the top floor.
6
The Value of This Training
 Knowing how to eliminate waste
that will ultimately increase capacity
and reduce cost is a valued skill that
will make an organization stand out
from the crowd!
 You will learn a skill that can be
used in any area of the business.
 You will master the tools needed to
market yourself as a “problem
finder”. Be the person that can
break through company “silos” and
see the big picture!
7
Applying lean principles can achieve the following:
 Increase product or service availability “Capacity”
 Reduce customer turnaround time
 Process simplification
 Cost reduction
 Improve safety
 Improve quality
 Reduce inventory levels
 Reduce logistics costs
 Reduce space
 Reduce lead Time
 Improve supplier performance and accountability
 Improve customer satisfaction and customer
relationships
8
Using Lean Principle
to Achieve a Competitive
Business
Advantage
9
Competitive advantage happens when
an organization adopts methods that
allow it to outperform its competitors.
Dramatic Difference
Lean is Market Driven
Every morning in Africa, a gazelle wakes up. It knows it
must run faster than the fastest lion or it will be killed.
Every morning a lion wakes up. It knows it must outrun
the slowest gazelle or it will starve to death.
It doesn’t matter whether
you are a lion or a
gazelle—when the sun
comes up, you had better
be running.
10
The Challenge
 Both internal and external
Customers Want:
 Lower cost
 On time delivery
 Improved quality
 Stakeholders Want:
 Improved margins
 Job security
 Long term contracts
11
• How do you feel when customers and
stakeholders keep demanding more
from you, day after day?
• What strategies are you adopting to
meet these competitive challenges?
• Do you have the necessary skills and
resources to turn opportunities into
reality?
12
Stairway to Success
Leaders need to build
a Bridge to the future
Paradigm
Shift
13
Why do Lean companies view customer demands as opportunities?
Lean Growth
(leverage)
Lower cost
Better quality
On time delivery
Increase margins
Job security
Long term contract
Better
Than
Competitors
=
14
Turning Opportunity into Reality
Increased
Profits $
Minimum Increase to:
•Direct labor
•Inventory
•Overhead
•Investment
What is Lean Growth?
Lean Growth
(leverage)
=
What is the result?
15
What Is Leverage?
Current Cost Leverage Cost Leverage
Opportunity
Direct Labor &
Material
$1.00 $0.75 $0.25
Fixed O/H $1.00 $0.75 $0.25
Var O/H $1.00 $0.75 $0.25
Sales/General &
Administration
$1.00 $0.75 $0.25
Profit $1.00 $1.00
Total $5.00 $4.00 $1.00
You can keep the
savings or use it as
price leverage 16
 Create and communicate a vision that inspires
 Develop strategies that attain your vision
 Set measurable objectives that support your strategy
 Cascade the deployment of actions
 Implement lean tactics that activate your objectives
How do we Turn Opportunities into Reality?
“If it’s not lead it will not be followed”
17
Stairway to Success
Paradigm
Shift
Develop Vision &
Strategies that turn
opportunities into
reality
Take actions that
achieve results
Implement
Vision
Leaders need to build a
Bridge to the future
18
 Value Stream Mapping (VSM)
 Measures for success (PDCA)
 Quick changeover (SMED)
 Cellular manufacturing
 Standardized work
 Cross training employees
 Total Productive Maintenance (TPM)
 Office Kaizen
 Kanban (Signal Pull Systems)
What are Lean Tactics?
19
Change the culture within your area by training and
developing skills that support:
How do we Sustain the Gains?
•Changing roles & responsibilities
•Buy-in and dedication to vision
•Working in teams
•Being non-blaming & judgmental
•Communicate
•Establishing measures, setting objectives
•Instill accountability
•Allocating resources to achieve objectives
•Empowering others
"If you always do what
you always did, you
always get what you
always got." (Anon)
Definition of Insanity:
“Doing the same thing over
and over again and
expecting different results”.
(Albert Einstein)
20
Stairway to Success
Leadership needs to
build a Bridge to the
Future
Paradigm
Shift
Develop Vision &
Strategies that turn
opportunities into
realities
Vision
Take actions that
achieve results
Implement
Change your culture
Sustain Gains
21
Strategic Growth
22
1. Overt Benefit
Specifically, obviously,
directly- What’s in it for the
customer?
2. Real Reason to Believe
Why should the customer
believe you will deliver on
the promise of Overt
Benefit.
3. Dramatic Difference
How revolutionary and new-
to-the-world is your
benefit/reason to believe?
“The Awakening” The Death of TIM P. WOOD
23
Week 2
•Lean Enterprise Overview
24
LEAN ENTERPRISE
OVERVIEW
25
CLC
Continuous Improvement
 Lean Principles
 Six Sigma
 TPS Toyota Production
System
Leadership through Influence
 Servant leadership
Cultural Change
 Sustainment of
improvements
 Continuous improvement
Culture
 Servant leadership culture
26
5 Principles of lean
 The five-step thought process for guiding the implementation of lean
techniques is easy to remember, but not always easy to achieve:
1. Specify value from the standpoint of the end customer by product
family.
2. Identify all the steps in the value stream for each product family,
eliminating whenever possible those steps that do not create value.
3. Make the value-creating steps occur in tight sequence so the product
will flow smoothly toward the customer.
4. As flow is introduced, let customers pull value from the next upstream
activity.
5. As value is specified, value streams are identified, wasted steps are
removed, and flow and pull are introduced, begin the process again and
continue it until a state of perfection is reached in which perfect value is
created with no waste.
27
Lean Enterprise
Flow
Flexible to Customer Demand
Balanced Work Flow
Demand Flow
Just-in-Time
Toyota Production System
28
History of Lean Manufacturing
1920’s1920’s
FordFord
1970’s1970’s
1920’s1920’s
FordFord 1970’s1970’s
ToyotaToyota
1990’s
LEAN
Manufacturing
2000’s
LEAN
Enterprise
‘Taiichi Ohno, Shigeo Shingo and Eiji Toyoda“
developed the TPS system between 1948 and 1975.
These men came to America and observed mass
production along with the assembly line. They also
observed how supermarkets operated.
29
Shortening the Production Cycle
“The longer an article is in the process of
manufacture and the more it is moved about,
the greater is its ultimate cost.”
Henry Ford, 1926
Henry Ford developed the
assembly line that
revolutionized mass production.
30
Defining Lean
“A systematic approach to identifying and Eliminating Waste (non-
value-added activities) through continuous improvement by flowing the
product at the pull of the customer in pursuit of perfection.”
The MEP (Manufacturing Extension Partnership)
Lean Network
“An organized war on waste.”
Lean has been defined in many different
ways.
31
Definition of Value Added
Value Added
Any activity that increases the market form or function of the product or
service. (These are things the customer is willing to pay for.)
Non-Value Added
Any activity that does not add market form or function or is not
necessary. (These activities should be eliminated, simplified, reduced,
or integrated.)
32
Internal vs. External Customer
 Internal Customer
 Anyone within an organization who at any
time is dependent on work that you do
within the organization
 External Customer
 The consumer of the product or service
outside of your organization
33
Establish Takt Time
Takt Time = Demand Rate
Takt Time =
Work Time Available
GOAL: Produce to Demand
2700 Seconds
120 Widgets
= 1 Widget every 22.5 SecTakt Time =
Cycle Time
Takt Time
= Minimum # of People
Number of Units Sold
34
Value Added Work
35
Examples of Waste
 Redundant Inspection
 Multiple Systems
 Excess Forms and Supplies
 Batching
 Downtime (Equipment breakdown)
 Searching for Paperwork (30s rule)
 Waiting for Instruction (Missing details)
 Excessive Transactions
When walking
through your
organizations what
do you see. 36
Leadership
Operational
Excellence
Strategy
Culture
Four Keys to the Lean Enterprise
The Relentless
Pursuit
of Perfection
• Model the Way
• Focus on the Future
• Empower Employees
• Vision is Set and
Continuously Shared
•Tactics Roll Up and Down
Through the organization
• Data Drives Decision Making
• Do What is Best for the Organization
• Accountability is Expected
Just like a table
needs four legs to
stand, lean requires
the four keys to be
effective and be
sustainable.
37
Lean Tools – Operational Excellence
 Continuous Improvement Events (Kaizen)
 Standard Work
 Visual Controls & Workplace Organization
 Value Stream Mapping
 5 Why’s – Root Cause Analysis
 Setup and Lot Size Reduction
 Production driven by TAKT time
 One Piece Flow
 Pull/Kanban Material Replenishment System
 Cellular Manufacturing 38
Kaizen
Kaizen is a Japanese philosophy of action which signifies change for the better.
• The word ‘Kai’ means to take apart and make new, while
• the word ‘Zen’ means to think about so as to help others
Kaizen is driven by two imperatives:
• Solve problems
• Eliminate waste (‘Muda’)
We apply Kaizen principles repeatedly to continually improve
the processes used everyday. Therefore:
Kaizen = Thoughtful Acts of Continuous Improvement 39
Document
Reality
Current State (VSM)
Plan
Countermeasures
Future State (VSM)
Identify
Waste
(Non value Added)
Reality
Check
Make Changes Verify Change
Measure
Results
Make this
the Standard
Celebrate
Do It
Again
In a week or less
Made a way of life
Kaizen Steps
40
Lean = Eliminating the Wastes
Value Added
Typically 95% of all lead time is non-value added
• Transportation
• Inventory
• Motion
• People (Underutilized)
• Waiting
• Overproduction
• Over-processing
• Defects
Non-Value Added
TIM P. WOOD
41
Lead Time Reduction
Productivity Increase
WIP Reduction
Quality Improvement
Space Utilization
0 25 50 75 100
Percentage of Benefits Achieved
Benefits of Lean
42
Week 3
•Kaizen Planning
43
Plan to Succeed
Passion Drives Success
Running a Successful Kaizen Event
44
Planning Represents Success
 Organizational
 Strategic
 Training
 Tactical
Enterprise
Event
25%
25%
25%
25%
100%
Every exclusion reduces chances of great Kaizen
45
Organizational
 Must answer the question
“WHY?”
 Prepare to answer “W.I.F.M?”
 Tie to Business Issues
 Develop Executive Buy-in
 Participates fully in Prep and
activity
46
Strategic
 Senior Management adopts
Kaizen philosophy
 Endorses “All hands on deck”
Support
 Delivers “W.I.F.M.?” and “WHY?”
answers.
 Participates actively in all phases
of Prep and activity
47
Training for the War on Waste
 No substitute for Hands On
 Allows team to focus on goals
rather than mechanics of
Kaizen
 Nuts & Bolts training of Roles
and Responsibilities
 Establish Kaizen Office and/or
methods
 Learning Kaizen process is as
critical as successes of first
Kaizen
48
Tactical Planning
 Where? How? When? Who?
 Eliminates barriers
 Creates Objectives, Targets, Metrics
 Construct Physical support and “Air
Cover”
 Structure supported: Kick off
meeting, Daily leaders meetings,
Final Presentation.
 Silo support: Maintenance,
Production etc.
49
Kaizen Timeline
KaizenEvent
Organization Prep
Strategic Prep
Training Prep
Tactical Prep
Follow up
50
Kaizen Event
 Life Cycle of the Event
 Kaizen Forms
 Event Structure
 Kaizen Fundamentals
51
Life Cycle of an Event
 Create Excitement
 Resolve Conflict
 Implement Resolution
 Celebrate Victory
52
Forms
 Profile, Target, Newspaper are Mainstay
 Permanent record
 Encourage compliance then creativity
 Guiding Documents
53
Kaizen Event Area Profile
Team # :
Event Description: Event Dates:
Preliminary Objectives: Team:
Production Requirements (Takt Time):
Facilitator:
Consultant:
Process Information: Current Situation and Problems
54
KAIZEN EVENT TARGET SHEET
Department Number: Team No.:
Department Name: Date:
Start Target 1st Day 2nd Day 3rd Day 4th Day
Space (Sq. Ft.)
Inventory (pcs)
Walking Distance (ft)
Parts Transport Distance
Throughput Time
Cycletime
Volume Per Day
Full-time Equivalent Crew
Productivity
Changeover (Total)
Schedule Attainment
Safety Improvements
Quality Improvements
Remarks:
55
56
Structure
 Leader has Accountability and is
responsible for event progress
 Management participates
 Cross functional contribution
 Kickoff Meeting, Daily meeting, Final
Presentation
 Event closeout
57
Fundamentals
 Bias towards Action
 Focus on Gemba “shop floor, place of event
etc…”
 Drive Objectives, Park others
 Ask “WHY?” 5 times
 Try-storm, not brainstorm:
1. It is not important to create perfect solutions.
2. Be action-oriented.
3. Keep solutions simple.
 Leave very few Newspaper Items
58
Important
 Create and implement structure to
support Follow up
 Make MUDA “waste” the enemy
 Debrief the event
 Build on successes
59
Week 4
•Value Stream Mapping
60
Value-Stream Mapping
61
What is a Value Stream
A Value Stream is the set of all actions (both
value added and non value added) required to
bring a specific product or service from raw
material through to the customer.
• “Whenever there is a product
(or service) for a customer,
• there is a value stream. The
challenge lies in seeing it.”
62
“The purpose of a Value Stream Map is to identify
What’s going on and where it’s going wrong”
Joe Perillo
63
Value Stream Map
 One of the most important tools of a
lean management analyst is the
process of value stream mapping.
 A value stream map outlines in detail
every step of the process in its current
state by documenting material and
information flows.
 This allows the team to visually see
the non value added waste within the
process.
 Once the waste has been identified,
action plans are established to reduce
or eliminate the waste thus improving
the efficiency of the process.
64
Value Stream Mapping Process
 Follow a “product” or “service” from
beginning to end, and draw a visual
representation of every process in the
material & information flow.
 Then, draw (using icons) a “future
state” map of how value should flow.
65
Using Value Stream Mapping
Visual representation of how
material and information
flows in the business today
Product family
Current state
drawing
Future state
drawing
Plan &
Implementation
Drawn using lean principles
Current State -
Invoice Payment
Future State –
Coax Line
66
Levels of a Value Stream
Process Level
Single Location
(door to door)
Multiple Facilities
Across Companies
Start Here
67
Types of Value Stream Maps
 A typical value stream
map will outline every
step in the process
from customer order to
delivery of a product or
service.
7:35
68
Current State Mapping
 Completed in 1-3 days depending on the complexity of the
process being mapped
 Performed by a cross functional team of individuals that
perform steps within the process being evaluated
 Resulting in a picture along with team observations of
what we “see” when following the product or service
69
Future State Mapping
 Completed in 1-3 days with the same team
 Focused on:
 Creating a flexible, reactive system that
quickly adapts to changing customer needs
 Eliminating and reducing waste
 Creating flow
 Producing and delivering on demand
70
Value Stream Managers
“A.K.A. Lean Management Analyst”
Each Value Stream needs a Value Stream Manager
The conductor of implementation:
•Focused on system wins
•Reports to the top dog
Process 1 Process 2 Process 3
“Customer”
The Value
Stream Manager
Kaizen
71
Don’t Wait!
You need a plan!
• Tie it to your business objectives.
• Make a VS Plan: What to do by when.
• Establish an appropriate review frequency.
• Conduct VS Reviews walking the flow.
Planning and Implementing
72
The Five Step Value Stream Process Review
1. Specify value from the standpoint of the end
customer.
2. Identify all the steps in the value stream and
eliminate whenever possible those steps that do
not create value.
3. Make the value-creating steps occur in tight
sequence so the product or service will flow
smoothly toward the customer.
4. As flow is introduced, let customers pull value
from the next upstream activity.
5. As value is specified, value streams are
identified, wasted steps are removed, and flow
and pull are introduced, begin the process
again and continue it until a state of perfection
is reached in which perfect value is created with
no waste.
73
Week 5
•Basic 5-S
1.Sort, 2.Set in order, 3.Shine, 4.Standardize & 5.Sustain
•Sustainment and measurement
•Dash boards
74
BASIC 5-S SORT, SET IN ORDER, SHINE,
STANDARDIZE & SUSTAIN
75
Definition
• Sort out necessary and unnecessary items.
• Store items used frequently at the work area, infrequently
used items store away from the work area, and dispose of items
that are not needed.
Why
• Gain Space
•Easier to visualize the process
• Safer work area
•Remove waste “Muda”
Remember
• Sort though all items in one area.
• Red tag items which can not be removed right away.
• Make sure everyone in the area agrees that an item should be
removed.
• Make sure reasons for keeping items are viable.
Examples
• Many documents in the work area are never
used. Remove them.
• Crowded offices often have blocked aisles,
making the space feel confined. Open up the
aisles. Are the items needed?
• Extra furniture contributes to the clutter.
Remove unused furniture.
SORT (Decide on what is needed)
76
SET IN ORDER
Definition
• Arrange all necessary items.
• Designate areas for all items.
• A place for everything and everything in its place.
Why
• Eliminate searching for items.
• Visually show what is out of place.
• Make it easier to do the work required.
Remember
• Use labels, signs, tape, & shadows to make it easy to locate
items.
• Items which are used together, should be kept together.
• Locate sharable items in a central location.
• It should be easy to find everything.
Examples
• Label filing cabinets to make it easier to find
files.
• Items have good visual controls.
• Keep only the amount you need at the work
station.
(Arrange needed items for ease of use)
77
Set in Order –
Shadow board used for those frequently used tools
78
Results of Sort and Set In Order:
After:Before:
No organization leads to
missing tools and
equipment. Time to search
for correct tool is pure
waste.
Tools are now
organized and
labeled for quick
retrieval. Each tool
has a designated
area for storage.
79
SHINE (Cleanliness)
Definition
• To keep the area clean on a continuing basis.
Why
• To keep area from getting dirty in the first
place, so we don’t have to clean it up
afterwards.
• A clean workplace is nicer to work in.
• A clean workplace is indicative of a quality
product and process.
• Dust and dirt cause potential health problems
and many people have allergies to them.
Remember
• Clean all areas, including cabinet top and insides.
• Vacuum / Dust / Mop / Paint
Examples
• Equipment and furniture should look “like
new”
• All documents should look like they were
just posted or printed.
80
Shine – Clean and inspect. Team members cleaning target areas.
81
STANDARDIZE (Maintain the first 3S’s)
Definition
• To maintain guidelines - Sort, Set In Order, Shine
Why
• Prevents regression back to an unclean /
disorganized environment.
• Eliminates the need for “Special Clean-up
Efforts”
Remember
• Develop schedules and checklist.
• Evaluate the areas using the 5S ratings.
• Continually improve neatness
Examples
• Maintain furniture and equipment by using
schedules.
• 5S Ratings posted and continually updated.
82
The 3 Elements of Standardized Work
1. Takt time, which is the rate at which
products must be made in a process to
meet customer demand
2. The precise work sequence in which
an operator performs tasks within Takt
time
3. The standard inventory, including units
in machines, required to keep the
process operating smoothly 83
Standard Work
A picture is worth a thousand words 84
SUSTAIN (Disciplined Culture)
Definition
• To maintain discipline, we need to practice and repeat until it
becomes a way of life.
• Always look for ways to improve your area.
Why
• To build ‘housekeeping” into the everyday
process.
• To keep from falling back to the unclean /
unorganized area that use to exist.
Remember
• Training everyone is vital.
• Involvement from all is necessary.
• Commitment and discipline toward 5S is essential in taking
the first step to being World Class
Examples
• Everyone keeps their furniture, equipment,
supplies organized and spotless daily.
• Always look for ways to do things easier and
more efficiently.
85
Sustainment and Measurement
86
Business Evaluation
 Are you measuring your business
 What are you measuring
 How are you measuring
 When are you measuring (before, during or after
it happens).
 What are you doing with the
information
87
What Are You Measuring
 Voice of the customer
 Customer satisfaction
 On time delivery (Perfect Order)
 Scrap or salvage
 Daily Unit Orders/Back Log
 Fill Rate or Availability
 Revenue
 Cost
 Profit
 Productivity
 Quality
 Inventory turns and value
 Standard work
 Visual controls
 Preventive and predictive maintenance
 Lead times
88
Definition of the Perfect Order
1. The Right Product
2. In the Right Quantity
3. From the Right Source
4. To the Right Destination
5. In the Right Condition
6. At the Right Time
7. With the Right Documentation
8. For the Right Cost. 89
Four Elements that Effect Overall Business Performance
1. Financial burdens, shortcomings, overhead,
costs and revenue.
2. Customer satisfaction (perfect order index)
3. Understanding business educational needs
and keeping up on the technology
surrounding your business
4. Continuous improvement, maintaining
optimum efficiency and the elimination of
waste or non value added activities
90
Measuring Your Business
 Implement lean tactics that achieve the objectives by prioritizing the lean
efforts for the greatest gains.
 Establish metrics that incorporate lean initiatives that drive the
organization to achieve the objectives.
 Work in effectively in cross functional teams
 Governance—establishing organizational structures that will accelerate
the rate of decision-making within your company.
 Roles and responsibilities—defining divisions of responsibilities to
intelligently balance resources for organizational change with capabilities
and knowledge.
 Performance management and incentives—implementing effective new
systems of organizational change measurement, feedback, and
compensation to identify and reward the true drivers of performance at the
individual, functional, and corporate level.
 Organizational structure—streamlining reporting and management
structures and ensuring they are suitable for your decision-making
processes and targeted measures of success.
91
“Dashboards”
92
Maximizing Results Via Metrics
 To maximize the effectiveness of the organization’s
efforts,
it is necessary to have:
 Clear, high-level goals,
 The means to make those goals meaningful to
persons throughout the organization, and
 A system to review and modify goals at all levels as
the situation evolves.
 The basis for this system is the metric.
Show me how a person or organization is measured,
and I’ll tell you how the person/organization is behaving.
93
Dashboards Definition
 “Dashboards” are a compilation of standardized performance
measures. These measurements are designed to:
 Facilitate achieving objectives
 Provide feedback
 Enable learning
 Dashboard measurements should accomplish each of the above at
all levels of the company.
 They should be clearly defined, simple to produce, and easily
understood by users.
 Dashboards are the tactical tool used to measure and track project
performance.
94
Management of Goals:
 Dashboards – Used to measure and track performance to meet
operational goals.
 Determine key performance indicators in four areas which cover
the past, present and future of the firm:
 Financial – Share price, sales, profits, return on investment.
 External – Customer satisfaction “On Time Delivery”, warranty
returns, repeat orders, market share.
 Internal – Business process performance, operational efficiency,
scrap rates, R&D cycle times, employee turnover.
 Learning and Growth – Staff training, suggestions made and
implemented, percentage of work hours working in teams.
95
Dashboards Should...
 Be well integrated, ensuring that every level
of the organization has metrics that support
the goals and strategies of the entire
enterprise
 Drive accountability for achieving goals
throughout the organization
 Be well-balanced – measuring improvement
in multiple, balanced metrics to ensure
driving the right behavior
96
Dashboard Measurements
 Characteristics of a Good Measurement:
 Specific
 Measurable
 Achievable and Verifiable
 Realistic
 Timely
97
Dashboards need to meet your
business requirements
Develop dashboard metrics that will meet the
business requirements depending on the complexity
or simplicity of your organization.
98
Dashboards communicate symptoms.
If goals are not being met, you need to find the
cause and resolve it!
99
Week 6
•Supply Chain Management
100
Supply Chain Management & Logistics
Opportunities for
Continuous Improvement
101
SSupplyupply CChainhain MManagementanagement
 Supply Chain (SC): the sequence of
organizations - their facilities, functions, and
activities - that are involved in producing
and delivering a product or service
 Facilities include warehouses, factories,
processing centers, distribution centers,
retail outlets, and offices
Sometimes referred to as value chains
102
The goal of every firm should be to maximize the
financial and service performance of the company.
In order to do that, you need to make sure you’re focusing in on your
customers with the right strategies in a specific sequence.
Focus on the customer through the service strategy, this means supporting
the current and perspective customers.
 Maximizes the service objectives that meet the financial goals of the firm.
 Make sure you have the right inventory strategy- and that strategy lines
up with the Customer Service Strategy.
 The Production Strategy utilizing lean principles that also incorporate the
cultural impact on the people within the organization.
 The Procurement Strategy that supports the production strategy.
 The Logistics Strategy that supports the internal and external customer.
 The Distribution Strategy that supports the external customer.
All these strategies prioritized in that order must align with the financial and service objectives of the
company that will meet the perfect order metric. There is an order to going about addressing each one so
they line up making sure the performance measurements provide feedback in making sure these strategies
line up. 103
Is the firm meeting the perfect order metric?
 The Right Product in the
 Right Quantity to the
 Right Destination in the
 Right Condition at the
 Right Time with the
 Right Documentation for the
 Right Cost.
Most companies only focus on one and then try to optimize that area
alone, forgetting that they must all fit and be aligned. 104
Leaders need to ask themselves these
questions.
 Is the customer satisfied with the level of
service they are receiving?
 What improvements have we made to
improve the area that does not meet the
customer’s level of service requirements
or the financial goals of the firm?
105
TTypicalypical SSupplyupply CChainshains
Purchasing
Receiving Storage Operations Storage
Production Distribution
106
TTypicalypical SCSC for afor a MManufactureranufacturer
Supplier
Supplier
Supplier
Storage
}
Mfg. Storage Dist. Retailer Customer
107
Supplier
Supplier
}Storage Service Customer
TTypicalypical SCSC for afor a SServiceervice
108
1. Improve operations
2. Increasing transportation costs, globalization,
and increasing levels of outsourcing
3. Competitive pressures
4. Increasing importance of e-commerce
5. Manage inventories: Bullwhip effect
NNeed foreed for SCSC MManagementanagement
109
 Buying goods or services instead of
producing or providing them in-house
 Benefits – better, cheaper, or more efficient
materials, parts, or services; expertise and
knowledge; added flexibility
 Risks – loss of control; greater dependency;
loss of the ability to perform in-house
OOutsourcingutsourcing
110
GGloballobal SSupplyupply CChainshains
 Increasing more complex
 Language
 Culture
 Currency fluctuations
 Political
 Transportation costs
 Local capabilities
 Finance and economics
 Environmental
111
EElements oflements of SCSC MManagementanagement
Deciding how to best move and store materialsLogistics
Determining location of facilitiesLocation
Monitoring supplier quality, delivery, and relationsSuppliers
Evaluating suppliers and supporting operationsPurchasing
Meeting demand while managing inventory costsInventory
Controlling quality, scheduling workProcessing
Incorporating customer wants, mfg., and timeDesign
Predicting quantity and timing of demandForecasting
Determining what customers wantCustomers
Typical IssuesElement
112
 Movement of materials, services, cash, and
information in a SC. Major issues:
 Movement within a facility
 Incoming and outgoing shipments
 Traffic management
 Distribution requirements planning (DRP)
 A system for inventory management and
distribution planning
 Third-party logistics (3-PL)
 The outsourcing of logistics management
 Reverse logistics
LLogisticsogistics
113
MMovementovement WWithin aithin a FFacilityacilityRECEIVING
Storage
Work
center
Work center
Work center
Storage
Work
center
Storage
Shipping
114
EEffectiveffective SSupplyupply CChainhain
 Requires linking the market, distribution channels
processes, and suppliers
 Supply chain should enable all participants in the
chain to achieve significant gains:
 Share forecasts
 Determine the status of orders in real time
 Access inventory data of partners
 E-procurement is becoming increasingly common
115
SSuccessfuluccessful SSupplyupply CChainhain
 Trust among trading partners
 Effective communications
 Supply chain visibility
 Event-management capability
 The ability to detect and respond to
unplanned events
 Performance metrics
 The SCOR model reflects an effort to
standardize measurement of supply chain
performance 116
SSupplyupply CChainhain MMetricsetrics
Perspective Metrics
Reliability On-time delivery
Order fulfillment lead time
Fill rate (fraction of demand met from stock)
Perfect order fulfillment
Flexibility Supply chain response time
Upside production flexibility
Expenses Supply chain management costs
Warranty cost as a percent of revenue
Value added per employee
Assets/utilization Total inventory days of supply
Cash-to-cash cycle time
Net asset turns
117
CPFRCPFR
 Collaborative Planning, Forecasting, and
Replenishment (CPFR): A supply chain initiative that
focuses on information sharing among supply chain
trading partners
 For purposes of planning, forecasting, and
inventory replenishment
 Incorporates key information such as promoting
timing and supply constraints
 Forecasts can be frozen and then converted into a
shipping plan, eliminating typical order processing
118
1. Develop strategic objectives and tactics
2. Integrate and coordinate activities in the
internal supply chain
3. Coordinate activities with suppliers with
customers and planning and execution
across the supply chain
4. Form strategic partnerships: Two or more
business organizations that have
complementary outputs join so that each
may realize a strategic benefit
SSteps inteps in CCreating anreating an EEffectiveffective SCSC
119
SSupplyupply CChainhain PPerformanceerformance DDriversrivers
 Quality
 Cost
 Flexibility
 Velocity
 Inventory velocity: The rate at which inventory
(material) goes through the supply chain
 Information velocity: The rate at which
information is communicated in a supply chain
 Customer service
120
Week 7
•Learning to See Through the
Symptoms
•Leadership Through Influence
•Cultural Change
121
Learning to See Through the
Symptoms
“Find the Root Cause”
122
5 Whys
 Often, just like a doctor, we see
symptoms (fever, nausea).
 To get to the underlying cause (the
disease) or the “root cause”, we need
to ask the question “Why” 5 times.
123
5 Whys Example
Problem Statement:
You are on your way home from work and your
car stops in the middle of the road
What are some solutions to this problem?
124
5 Whys Example
Problem Statement:
You are on your way home from work and your car stops in the
middle of the road
1. Why1. Why did your car stop?did your car stop?
- Because it ran out of gas.- Because it ran out of gas.
2. Why2. Why did it run out of gas?did it run out of gas?
- Because I didn't buy any gas on my way to work.- Because I didn't buy any gas on my way to work.
3. Why3. Why didn't you buy any gas this morning?didn't you buy any gas this morning?
- Because I didn't have any money.- Because I didn't have any money.
4. Why4. Why didn't you have any money?didn't you have any money?
- Because I lost it all last night in a poker game.- Because I lost it all last night in a poker game.
5. Why5. Why did you lose your money in last night's poker game?did you lose your money in last night's poker game?
- Because I'm not very good at "bluffing" when I don't have a good hand.- Because I'm not very good at "bluffing" when I don't have a good hand.
125
Follow the Symptoms to the Root Cause
 A woman meets with her
Doctor to address a pain
in her shoulder.
 The Dr attributes it to
normal aches and pains
and prescribes a pain
reliever.
Question:
 Did the Dr treat the
symptom or the cause? 126
Follow the Symptoms to the Root Cause
 By seeing through
the symptoms the
Dr could have
asked several
questions that
would have lead to
the cause of the
pain.
127
Root Cause Analysis
Why do sales drop off at a specific time of year?
 A grocery store located in the upper Midwest could
not understand why at a certain time every winter
sales plummeted. They studied their product line and
interviewed customers. They did everything possible
to uncover the mystery. Finally, someone made a
remarkable discovery that changed everything.
128
Follow the Symptoms to the Root Cause
 It seemed that whenever it was really cold outside, the
manager raised the temperature in the store. When
customers came into the store it was too warm for
them, so they removed their coats and placed them in
their shopping carts. This meant less room for food and
resulted in reduced sales overall. They lowered the
temperature of the store, and as a result, the sales
climbed back to the levels they were accustomed to.
Their adjustment resulted in restoring sales levels.
129
Be Patient
 As you walk through your plant, waiting room, service
area, purchasing department, accounting department
etc…
 Look through the symptoms of waste such as rejects,
waiting, unnecessary movement, long lead times,
poor customer satisfaction etc…
 These are opportunities for continuous improvement
but we will miss the chance to solve the root cause if
we stop short at only fixing the symptoms.
130
LEADERSHIP THROUGH
INFLUENCE
131
Servant Leadership
Servant- Leadership Defined
 Servant leadership is defined as an
approach to leadership development, which
emphasizes the leader’s role as steward of
the resources (human, financial and
otherwise) provided by the organization.
 It encourages leaders to serve others while
staying focused on achieving results in line
with the organization’s values and integrity.
Servant Leader
A servant leader serves constituents by
working on their behalf to help them achieve
their goals, not the leader’s own goals.
 Places service before self-interest
 Listens first to express confidence in others
 Inspires trust by being trustworthy
 Focuses on what is feasible to accomplish
 Lends a hand
 Provides tools
Servant Leadership
 Continuous improvement or lean tools are important foundational strategies,
but they can't deliver effective or sustainable results unless we establish an
organization that promotes a continuous learning environment.
 This requires leaders with a teachable spirit or leaders that want to create a
safe environment that promotes problem solving through experimentation.
 Creating this kind of environment in an organization changes the role of a
leader from boss to teacher, from manager to coach or as some would call,
a servant leader.
 If you review the role of a leader you can see that they serve the people
they lead by giving them the tools, resources, support, direction and vision
that ultimately reach the customer.
 This type of leadership creates an organization that is continually learning
along with developing and organization of problem solvers.
Ten Characteristics of Servant Leadership
Listening
Empathy
Healing
Awareness
Persuasion
Conceptualization
Foresight
Stewardship
Commitment to
growth of others
Building
Community
Larry Spears, director of the Robert K Greenleaf
Center for Servant Leadership, identified ten
characteristics.
Commitment to the Growth of Others
 Servant-leaders believe that people have
an intrinsic value beyond their tangible
contributions as workers.
 Servant-leaders are deeply committed to a
personal, professional, and spiritual growth
of all individuals in the organization.
 As we grow the organization, there is still a
need to build a sense of community.
“Leadership Through Influence Rather than Influence Through Leadership”
Joe Perillo
 There is a saying, “it is far
more impressive to see a
flock of sheep following a
lion rather than a lion
following a flock of sheep”.
137
The Law of Influence
 What platform have you built for
performance?
 What is your track record?
 What daily actions enhance your ability to
influence your organization?
 Leadership Lesson:
 “True leadership cannot be awarded,
appointed or assigned. It comes from
influence.”
“The True Measurement of Leadership Is Influence – Nothing More, Nothing Less”
138
Leadership Through Influence
 Leadership is a complex function, as a leader you are many things to many people with
different needs and abilities. Leading people with these challenges requires skills that
do not always come naturally and in some cases the skills you learned will not get you
to the next level of success.
 Your past success has gotten you to where you are. To get to the next level
requires learning new skills, mastering new things. And as a leader the way we
ultimately become successful is by getting greater results from those we lead.
 The same way a football coach can’t win a game by themselves we see clearly to be a
successful leader we must become great coaches of others.
 Zig Ziglar may have said it best: “You can get anything in life you want, if you are
willing to help enough other people get what they want.”
 Leadership and coaching go hand in hand when working with people to accomplish a
goal or task. As you develop others you help them get the job satisfaction, peace of
mind, security that comes with greater skills, and opportunities. As a leader and a
coach we must encourage, persuade and support.
 The leadership through influence philosophy blends the role of leader and coach as you
lead as a lean management analyst so you can be successful by helping others
become more effective and efficient. 139
“DON’T LET WHAT YOU KNOW GET IN
THE WAY OF YOUR GROWTH”
140
Joe Perillo
Manager vs. Leader
 For many people in business,
obtaining a master's degree
has been instrumental in their
career achievements.
 However, some masters degree
curriculums teach people how
to be managers, not how to be
leaders.
 The problem is that almost all
continuous-improvement efforts
require leaders, not managers.
141
Developing Lean Leaders
 It is the behavior of leaders that matters since they create the culture.
 Leaders develop and communicate the vision that shape the
environment of the organization and the way it operates.
 Developing leaders who will sustain, support and build a lean culture
involves training and developing leaders who have influence.
 The “Leadership through influence rather than influence through
leadership” model teaches that true cultural change can only happen
when people follow leaders who lead by example.
 Lean is more than just improving operations. It is every step between
the customer and order fulfillment.
 Often considerable value can be achieved by applying lean principles
but true cultural change comes from a coordinated leadership
approach to bring it all together.
142
Four Foundational Pillars
Leaders
 Model the Way
 Focus on the Future
 Empower Employees
Strategy
 Vision is Set and Continuously Shared
 Tactics Roll Up and Down Through the organization
Culture
 Data Drives Decision Making
 Do What is Best for the Organization
 Accountability is ExpectedOperational Excellence
 The relentless pursuit of perfection
1.Leadership (Model the way, Provide Support, Have a Servant Attitude)
2.Culture (Continuous improvement attitude)
3.Operational Excellence (Perfect order, on time delivery & inventory management)
4.Strategic Vision (Provide the vision, set the course, follow-up and follow Through)
143
The Importance of Culture
in a Lean Transformation
144
Cultural Change
 Achieving true cultural change one has to be
committed to being teachable and driven to create an
environment of continuous improvement.
 To implement lean or anything associated with
business process improvement requires leaders who
are honest with themselves and the people they lead
 In general people are comfortable with not changing,
they are happy with the “status quo” its easer not
having to confront or challenge current practice.
 Your challenge will be to influence cultural change
through your actions as a leader.
145
“Culture Shock”
 As a lean leader you will be challenged to lead
diverse groups that are either just starting out
with little experience or have many years of
experience.
 In each circumstance they bring their own
unique set of challenges one of which is a
cultural shock
146
Changing the Culture
 As you begin your lean journey you will encounter two realities when taking on lean
transformation.
1. The first involves the physical changes that help reduce waste.
2. The second involves the changing of the existing culture.
 Experienced lean practitioners understand that making physical changes in the
reduction of waste is much easier than changing the cultural landscape of an
organization.
 Sustainability is the key to long term effectiveness and the only way we can achieve
sustainability is by changing the culture.
 Creating a new standard of how people approach a challenge or a problem even how
they work. The change in culture also applies to how people approach each other and
how they communicate.
 Measuring organizational performance will change the focus from the individual to the
entire team.
 A continuous improvement culture requires more than just going through the motions of
a physical plant layout or process changes, it requires a change in how we approach
everything we do. 147
“Is There a Better Way”
 One of the eight wastes is the underutilization of people. In a
traditional operation the culture usually pushes the ideas from
management down to the front lines. In a lean culture the ideas are
coming from the experts who do the job every day.
 Management is responsible to create an environment that allows for
ideas to flow freely in a non threatening environment even when
mistakes are made.
 Management is responsible for creating a culture that drives the
entire organization to ask the question “Is there a better way”
 Once we begin asking the questions “Is there a better way” it is the
responsibility of management to create the vision and support all
efforts that will help the organization succeed.
148
Teachable Spirit
 At the heart of any change is the individual with
a teachable spirit, without it change will not
happen because the individual believes his or
her way is best.
 The basic principle of continuous improvement
is that perfection is pursued and not achieved.
 If perfection is achieved it is short lived due to
changes in technology, material and customer
requirements.
149
Breaking Records
 World records are
achievements of perfection
but records were meant to
be broken, history has
proven this time and time
again.
 Individuals who set out to
break these records,
challenged the status quo
by confronting the methods
of achieving a new world
record by becoming faster
and stronger.
150
“An organization that lacks leaders with a
teachable spirit cannot influence true
cultural change”
Joe Perillo
151
152

More Related Content

What's hot

Gold mining with kaizen blitz
Gold mining with kaizen blitzGold mining with kaizen blitz
Gold mining with kaizen blitz
Marino Associates, LLC
 
Continuous Improvement using the Toyota Way
Continuous Improvement using the Toyota WayContinuous Improvement using the Toyota Way
Continuous Improvement using the Toyota Way
Anita Rao
 
Kaizen basics
Kaizen basicsKaizen basics
Kaizen basics
Dinesh Kakkad
 
8D Problem Solving Approach
8D Problem Solving Approach8D Problem Solving Approach
8D Problem Solving Approach
Timothy Wooi
 
Value Stream Analysis
Value Stream AnalysisValue Stream Analysis
Value Stream Analysis
Margarito Tongco, Jr.
 
Implementation of kaizen in ashok leyland
Implementation of kaizen in ashok leylandImplementation of kaizen in ashok leyland
Implementation of kaizen in ashok leyland
Akila Priyadarshini Ganesh
 
Lean Startup - The Next Industrial Revolution - Day 1
Lean Startup - The Next Industrial Revolution - Day 1Lean Startup - The Next Industrial Revolution - Day 1
Lean Startup - The Next Industrial Revolution - Day 1
Ravi Yadav
 
Kaizen folder
Kaizen folderKaizen folder
Kaizen folder
rey0708
 
Continous process improvement
Continous process improvementContinous process improvement
Continous process improvement
Sarfraz Ashraf
 
Lean Six Sigma for companies
Lean Six Sigma for companiesLean Six Sigma for companies
Lean Six Sigma for companies
Imran Abbasi
 
Lean A3 Report for Planning Downtime Elimination
Lean A3 Report for Planning Downtime EliminationLean A3 Report for Planning Downtime Elimination
Lean A3 Report for Planning Downtime Elimination
Rodrigo André Marques
 
LEAN MANUFACTURING AND SIX SIGMA
LEAN MANUFACTURING AND SIX SIGMA LEAN MANUFACTURING AND SIX SIGMA
LEAN MANUFACTURING AND SIX SIGMA
Srinath Maharana
 
Kaizen & Small Group Activities
Kaizen & Small Group ActivitiesKaizen & Small Group Activities
Kaizen & Small Group Activities
DEEPAK SAHOO
 
Kaizen
KaizenKaizen
Lean Strategy Implementation Methodology.
Lean Strategy Implementation Methodology.Lean Strategy Implementation Methodology.
Lean Strategy Implementation Methodology.
Yadhu Gopinath
 
Six sigma vs kaizen
Six sigma vs kaizenSix sigma vs kaizen
Six sigma vs kaizen
Gopala P.
 
170 Fundamentals of Lean Thinking 2014 01
170 Fundamentals of Lean Thinking 2014 01170 Fundamentals of Lean Thinking 2014 01
170 Fundamentals of Lean Thinking 2014 01
Francisco Pulgar-Vidal, MBA, Lean Six Sigma MBB
 
Blue Belt Program Review
Blue Belt Program ReviewBlue Belt Program Review
Blue Belt Program Review
jah10632
 
Kaizen event
Kaizen eventKaizen event
Kaizen event
Kimberly O'Kelley
 

What's hot (19)

Gold mining with kaizen blitz
Gold mining with kaizen blitzGold mining with kaizen blitz
Gold mining with kaizen blitz
 
Continuous Improvement using the Toyota Way
Continuous Improvement using the Toyota WayContinuous Improvement using the Toyota Way
Continuous Improvement using the Toyota Way
 
Kaizen basics
Kaizen basicsKaizen basics
Kaizen basics
 
8D Problem Solving Approach
8D Problem Solving Approach8D Problem Solving Approach
8D Problem Solving Approach
 
Value Stream Analysis
Value Stream AnalysisValue Stream Analysis
Value Stream Analysis
 
Implementation of kaizen in ashok leyland
Implementation of kaizen in ashok leylandImplementation of kaizen in ashok leyland
Implementation of kaizen in ashok leyland
 
Lean Startup - The Next Industrial Revolution - Day 1
Lean Startup - The Next Industrial Revolution - Day 1Lean Startup - The Next Industrial Revolution - Day 1
Lean Startup - The Next Industrial Revolution - Day 1
 
Kaizen folder
Kaizen folderKaizen folder
Kaizen folder
 
Continous process improvement
Continous process improvementContinous process improvement
Continous process improvement
 
Lean Six Sigma for companies
Lean Six Sigma for companiesLean Six Sigma for companies
Lean Six Sigma for companies
 
Lean A3 Report for Planning Downtime Elimination
Lean A3 Report for Planning Downtime EliminationLean A3 Report for Planning Downtime Elimination
Lean A3 Report for Planning Downtime Elimination
 
LEAN MANUFACTURING AND SIX SIGMA
LEAN MANUFACTURING AND SIX SIGMA LEAN MANUFACTURING AND SIX SIGMA
LEAN MANUFACTURING AND SIX SIGMA
 
Kaizen & Small Group Activities
Kaizen & Small Group ActivitiesKaizen & Small Group Activities
Kaizen & Small Group Activities
 
Kaizen
KaizenKaizen
Kaizen
 
Lean Strategy Implementation Methodology.
Lean Strategy Implementation Methodology.Lean Strategy Implementation Methodology.
Lean Strategy Implementation Methodology.
 
Six sigma vs kaizen
Six sigma vs kaizenSix sigma vs kaizen
Six sigma vs kaizen
 
170 Fundamentals of Lean Thinking 2014 01
170 Fundamentals of Lean Thinking 2014 01170 Fundamentals of Lean Thinking 2014 01
170 Fundamentals of Lean Thinking 2014 01
 
Blue Belt Program Review
Blue Belt Program ReviewBlue Belt Program Review
Blue Belt Program Review
 
Kaizen event
Kaizen eventKaizen event
Kaizen event
 

Similar to 0 RIVA Lean Enterprise Overview 12.11.15

Principles of lean_six_sigma_2012
Principles of lean_six_sigma_2012Principles of lean_six_sigma_2012
Principles of lean_six_sigma_2012
Shahzad Danish
 
Digital agility 1172014
Digital agility 1172014Digital agility 1172014
Digital agility 1172014
Michael Bromley
 
Lean manufacturing concepts and tools and quality management1
Lean manufacturing concepts and tools and quality management1Lean manufacturing concepts and tools and quality management1
Lean manufacturing concepts and tools and quality management1
hgalinova
 
Lean Manufacturing PPT | Lean Management PPT
Lean Manufacturing PPT | Lean Management PPTLean Manufacturing PPT | Lean Management PPT
Lean Manufacturing PPT | Lean Management PPT
tannukumari2999
 
Joel Nickelsen “Growing Lean – The New Paradigm”
Joel Nickelsen  “Growing Lean – The New Paradigm”Joel Nickelsen  “Growing Lean – The New Paradigm”
Joel Nickelsen “Growing Lean – The New Paradigm”
Elemica
 
Productivity enhancement using lean
Productivity enhancement using leanProductivity enhancement using lean
Productivity enhancement using lean
Sherin El-Rashied
 
Lean Management explained to CEOs & Others
Lean Management explained to CEOs & OthersLean Management explained to CEOs & Others
Lean Management explained to CEOs & Others
Equable
 
Lean Journey At C1
Lean Journey At C1Lean Journey At C1
Lean Journey At C1
Beth Johnson
 
Lean presentation tier1 v2 053113
Lean presentation tier1 v2 053113Lean presentation tier1 v2 053113
Lean presentation tier1 v2 053113
OMCMEXICO
 
Organisational Agility
Organisational AgilityOrganisational Agility
Organisational Agility
Andy Smith
 
Seeing the Whole - Creating Lean Supply Chains
Seeing the Whole - Creating Lean Supply ChainsSeeing the Whole - Creating Lean Supply Chains
Seeing the Whole - Creating Lean Supply Chains
Lean Enterprise Academy
 
00 Why Change 22 Pgs
00 Why Change 22  Pgs00 Why Change 22  Pgs
00 Why Change 22 Pgs
freelean
 
Wealth creation through lean manufacturing concepts, tools and techniques
Wealth creation through  lean manufacturing  concepts, tools and techniquesWealth creation through  lean manufacturing  concepts, tools and techniques
Wealth creation through lean manufacturing concepts, tools and techniques
Winning Minds Solutions
 
Lean And Six Sigma
Lean And Six SigmaLean And Six Sigma
Lean And Six Sigma
Jessica Tanner
 
Vistage CEO Session
Vistage CEO SessionVistage CEO Session
Vistage CEO Session
Roshan Thiran
 
#Basics of Lean Six Sigma - By SN Panigrahi
#Basics of Lean Six Sigma - By SN Panigrahi#Basics of Lean Six Sigma - By SN Panigrahi
#Basics of Lean Six Sigma - By SN Panigrahi
SN Panigrahi, PMP
 
Lean thinking and the benifits of change
Lean thinking and the benifits of changeLean thinking and the benifits of change
Lean thinking and the benifits of change
daveskelton2
 
Six Sigma Green Belt Course Preview
Six Sigma Green Belt Course PreviewSix Sigma Green Belt Course Preview
Six Sigma Green Belt Course Preview
Invensis Learning
 
Innovation Experience 2007.10.23 PPT.ppt
Innovation Experience 2007.10.23 PPT.pptInnovation Experience 2007.10.23 PPT.ppt
Innovation Experience 2007.10.23 PPT.ppt
ssuser7d433d
 
Growing a Business in a Challenging Economy using Lean Practices
Growing a Business in a Challenging Economy using Lean PracticesGrowing a Business in a Challenging Economy using Lean Practices
Growing a Business in a Challenging Economy using Lean Practices
Ojiugo Ajunwa
 

Similar to 0 RIVA Lean Enterprise Overview 12.11.15 (20)

Principles of lean_six_sigma_2012
Principles of lean_six_sigma_2012Principles of lean_six_sigma_2012
Principles of lean_six_sigma_2012
 
Digital agility 1172014
Digital agility 1172014Digital agility 1172014
Digital agility 1172014
 
Lean manufacturing concepts and tools and quality management1
Lean manufacturing concepts and tools and quality management1Lean manufacturing concepts and tools and quality management1
Lean manufacturing concepts and tools and quality management1
 
Lean Manufacturing PPT | Lean Management PPT
Lean Manufacturing PPT | Lean Management PPTLean Manufacturing PPT | Lean Management PPT
Lean Manufacturing PPT | Lean Management PPT
 
Joel Nickelsen “Growing Lean – The New Paradigm”
Joel Nickelsen  “Growing Lean – The New Paradigm”Joel Nickelsen  “Growing Lean – The New Paradigm”
Joel Nickelsen “Growing Lean – The New Paradigm”
 
Productivity enhancement using lean
Productivity enhancement using leanProductivity enhancement using lean
Productivity enhancement using lean
 
Lean Management explained to CEOs & Others
Lean Management explained to CEOs & OthersLean Management explained to CEOs & Others
Lean Management explained to CEOs & Others
 
Lean Journey At C1
Lean Journey At C1Lean Journey At C1
Lean Journey At C1
 
Lean presentation tier1 v2 053113
Lean presentation tier1 v2 053113Lean presentation tier1 v2 053113
Lean presentation tier1 v2 053113
 
Organisational Agility
Organisational AgilityOrganisational Agility
Organisational Agility
 
Seeing the Whole - Creating Lean Supply Chains
Seeing the Whole - Creating Lean Supply ChainsSeeing the Whole - Creating Lean Supply Chains
Seeing the Whole - Creating Lean Supply Chains
 
00 Why Change 22 Pgs
00 Why Change 22  Pgs00 Why Change 22  Pgs
00 Why Change 22 Pgs
 
Wealth creation through lean manufacturing concepts, tools and techniques
Wealth creation through  lean manufacturing  concepts, tools and techniquesWealth creation through  lean manufacturing  concepts, tools and techniques
Wealth creation through lean manufacturing concepts, tools and techniques
 
Lean And Six Sigma
Lean And Six SigmaLean And Six Sigma
Lean And Six Sigma
 
Vistage CEO Session
Vistage CEO SessionVistage CEO Session
Vistage CEO Session
 
#Basics of Lean Six Sigma - By SN Panigrahi
#Basics of Lean Six Sigma - By SN Panigrahi#Basics of Lean Six Sigma - By SN Panigrahi
#Basics of Lean Six Sigma - By SN Panigrahi
 
Lean thinking and the benifits of change
Lean thinking and the benifits of changeLean thinking and the benifits of change
Lean thinking and the benifits of change
 
Six Sigma Green Belt Course Preview
Six Sigma Green Belt Course PreviewSix Sigma Green Belt Course Preview
Six Sigma Green Belt Course Preview
 
Innovation Experience 2007.10.23 PPT.ppt
Innovation Experience 2007.10.23 PPT.pptInnovation Experience 2007.10.23 PPT.ppt
Innovation Experience 2007.10.23 PPT.ppt
 
Growing a Business in a Challenging Economy using Lean Practices
Growing a Business in a Challenging Economy using Lean PracticesGrowing a Business in a Challenging Economy using Lean Practices
Growing a Business in a Challenging Economy using Lean Practices
 

0 RIVA Lean Enterprise Overview 12.11.15

  • 1. Presented by Joe Perillo RIVA Lean Enterprise Overview 1
  • 2. Course Overview Week 1 (Slides 1 – 23)  Introductions  Course Overview  What is a Lean management analyst  Purpose and scope  Using Lean as business advantage Week 2 (Slides 24 – 42)  Lean Enterprise Overview Week 3 (Slides 43 – 59)  Running a Successful Kaizen Event Week 4 (Slides 60 – 73)  Value-stream mapping Week 5 (Slides 74 – 99)  Basic 5-S Sort, Set in order, Shine, Sustain  Sustainment and measurement  Dash boards Week 6 (Slides 100 – 120)  Supply Chain management & Logistics Week 7 (Slides 121- 152)  Learning to see Through the Symptoms  Servant Leadership and Leadership Influence  True Cultural change 2
  • 3. Recommended Reading  Lean Thinking, by Jim Womack  Becoming Lean, by Jeffrey Liker  The Machine That Changed the World, by Jim Womack and Daniel T. Jones  The Goal, by Eli Goldratt  World Class Manufacturing: The Next Decade, by Richard Schonberger  All I Need To Know about Manufacturing I learned in Joe’s Garage by William B. Miller Vicki L. Schenk.  Good to Great by Jim Collins  Leadership & the One Minute Manager by Ken Blanchard  The 21 Irrefutable laws of Leadership By John C. Maxwell  The 17 Indisputable Laws of Teamwork By John C. Maxwell  The Servant, a simple story about the true essence of Leadership By James C. Hunter 3
  • 4. What is a lean Management?  lean management is the facilitation of lean principles by analyzing a company’s procedures to increase safety, capacity and quality thus improving profitability through the elimination of waste. 4
  • 6. Purpose & Scope  Lean principles offer tangible solutions to drastically cut waste, thereby improving quality, productivity and profitability.  The fundamentals of Lean embrace the identification and elimination of waste throughout the entire supply chain, ultimately resulting in a more efficient business environment.  This program teaches the fundamentals and techniques of Lean management, and facilitates the follow-up skills necessary to achieve successful results from the shop floor to the top floor. 6
  • 7. The Value of This Training  Knowing how to eliminate waste that will ultimately increase capacity and reduce cost is a valued skill that will make an organization stand out from the crowd!  You will learn a skill that can be used in any area of the business.  You will master the tools needed to market yourself as a “problem finder”. Be the person that can break through company “silos” and see the big picture! 7
  • 8. Applying lean principles can achieve the following:  Increase product or service availability “Capacity”  Reduce customer turnaround time  Process simplification  Cost reduction  Improve safety  Improve quality  Reduce inventory levels  Reduce logistics costs  Reduce space  Reduce lead Time  Improve supplier performance and accountability  Improve customer satisfaction and customer relationships 8
  • 9. Using Lean Principle to Achieve a Competitive Business Advantage 9 Competitive advantage happens when an organization adopts methods that allow it to outperform its competitors. Dramatic Difference
  • 10. Lean is Market Driven Every morning in Africa, a gazelle wakes up. It knows it must run faster than the fastest lion or it will be killed. Every morning a lion wakes up. It knows it must outrun the slowest gazelle or it will starve to death. It doesn’t matter whether you are a lion or a gazelle—when the sun comes up, you had better be running. 10
  • 11. The Challenge  Both internal and external Customers Want:  Lower cost  On time delivery  Improved quality  Stakeholders Want:  Improved margins  Job security  Long term contracts 11
  • 12. • How do you feel when customers and stakeholders keep demanding more from you, day after day? • What strategies are you adopting to meet these competitive challenges? • Do you have the necessary skills and resources to turn opportunities into reality? 12
  • 13. Stairway to Success Leaders need to build a Bridge to the future Paradigm Shift 13
  • 14. Why do Lean companies view customer demands as opportunities? Lean Growth (leverage) Lower cost Better quality On time delivery Increase margins Job security Long term contract Better Than Competitors = 14
  • 15. Turning Opportunity into Reality Increased Profits $ Minimum Increase to: •Direct labor •Inventory •Overhead •Investment What is Lean Growth? Lean Growth (leverage) = What is the result? 15
  • 16. What Is Leverage? Current Cost Leverage Cost Leverage Opportunity Direct Labor & Material $1.00 $0.75 $0.25 Fixed O/H $1.00 $0.75 $0.25 Var O/H $1.00 $0.75 $0.25 Sales/General & Administration $1.00 $0.75 $0.25 Profit $1.00 $1.00 Total $5.00 $4.00 $1.00 You can keep the savings or use it as price leverage 16
  • 17.  Create and communicate a vision that inspires  Develop strategies that attain your vision  Set measurable objectives that support your strategy  Cascade the deployment of actions  Implement lean tactics that activate your objectives How do we Turn Opportunities into Reality? “If it’s not lead it will not be followed” 17
  • 18. Stairway to Success Paradigm Shift Develop Vision & Strategies that turn opportunities into reality Take actions that achieve results Implement Vision Leaders need to build a Bridge to the future 18
  • 19.  Value Stream Mapping (VSM)  Measures for success (PDCA)  Quick changeover (SMED)  Cellular manufacturing  Standardized work  Cross training employees  Total Productive Maintenance (TPM)  Office Kaizen  Kanban (Signal Pull Systems) What are Lean Tactics? 19
  • 20. Change the culture within your area by training and developing skills that support: How do we Sustain the Gains? •Changing roles & responsibilities •Buy-in and dedication to vision •Working in teams •Being non-blaming & judgmental •Communicate •Establishing measures, setting objectives •Instill accountability •Allocating resources to achieve objectives •Empowering others "If you always do what you always did, you always get what you always got." (Anon) Definition of Insanity: “Doing the same thing over and over again and expecting different results”. (Albert Einstein) 20
  • 21. Stairway to Success Leadership needs to build a Bridge to the Future Paradigm Shift Develop Vision & Strategies that turn opportunities into realities Vision Take actions that achieve results Implement Change your culture Sustain Gains 21
  • 22. Strategic Growth 22 1. Overt Benefit Specifically, obviously, directly- What’s in it for the customer? 2. Real Reason to Believe Why should the customer believe you will deliver on the promise of Overt Benefit. 3. Dramatic Difference How revolutionary and new- to-the-world is your benefit/reason to believe?
  • 23. “The Awakening” The Death of TIM P. WOOD 23
  • 26. CLC Continuous Improvement  Lean Principles  Six Sigma  TPS Toyota Production System Leadership through Influence  Servant leadership Cultural Change  Sustainment of improvements  Continuous improvement Culture  Servant leadership culture 26
  • 27. 5 Principles of lean  The five-step thought process for guiding the implementation of lean techniques is easy to remember, but not always easy to achieve: 1. Specify value from the standpoint of the end customer by product family. 2. Identify all the steps in the value stream for each product family, eliminating whenever possible those steps that do not create value. 3. Make the value-creating steps occur in tight sequence so the product will flow smoothly toward the customer. 4. As flow is introduced, let customers pull value from the next upstream activity. 5. As value is specified, value streams are identified, wasted steps are removed, and flow and pull are introduced, begin the process again and continue it until a state of perfection is reached in which perfect value is created with no waste. 27
  • 28. Lean Enterprise Flow Flexible to Customer Demand Balanced Work Flow Demand Flow Just-in-Time Toyota Production System 28
  • 29. History of Lean Manufacturing 1920’s1920’s FordFord 1970’s1970’s 1920’s1920’s FordFord 1970’s1970’s ToyotaToyota 1990’s LEAN Manufacturing 2000’s LEAN Enterprise ‘Taiichi Ohno, Shigeo Shingo and Eiji Toyoda“ developed the TPS system between 1948 and 1975. These men came to America and observed mass production along with the assembly line. They also observed how supermarkets operated. 29
  • 30. Shortening the Production Cycle “The longer an article is in the process of manufacture and the more it is moved about, the greater is its ultimate cost.” Henry Ford, 1926 Henry Ford developed the assembly line that revolutionized mass production. 30
  • 31. Defining Lean “A systematic approach to identifying and Eliminating Waste (non- value-added activities) through continuous improvement by flowing the product at the pull of the customer in pursuit of perfection.” The MEP (Manufacturing Extension Partnership) Lean Network “An organized war on waste.” Lean has been defined in many different ways. 31
  • 32. Definition of Value Added Value Added Any activity that increases the market form or function of the product or service. (These are things the customer is willing to pay for.) Non-Value Added Any activity that does not add market form or function or is not necessary. (These activities should be eliminated, simplified, reduced, or integrated.) 32
  • 33. Internal vs. External Customer  Internal Customer  Anyone within an organization who at any time is dependent on work that you do within the organization  External Customer  The consumer of the product or service outside of your organization 33
  • 34. Establish Takt Time Takt Time = Demand Rate Takt Time = Work Time Available GOAL: Produce to Demand 2700 Seconds 120 Widgets = 1 Widget every 22.5 SecTakt Time = Cycle Time Takt Time = Minimum # of People Number of Units Sold 34
  • 36. Examples of Waste  Redundant Inspection  Multiple Systems  Excess Forms and Supplies  Batching  Downtime (Equipment breakdown)  Searching for Paperwork (30s rule)  Waiting for Instruction (Missing details)  Excessive Transactions When walking through your organizations what do you see. 36
  • 37. Leadership Operational Excellence Strategy Culture Four Keys to the Lean Enterprise The Relentless Pursuit of Perfection • Model the Way • Focus on the Future • Empower Employees • Vision is Set and Continuously Shared •Tactics Roll Up and Down Through the organization • Data Drives Decision Making • Do What is Best for the Organization • Accountability is Expected Just like a table needs four legs to stand, lean requires the four keys to be effective and be sustainable. 37
  • 38. Lean Tools – Operational Excellence  Continuous Improvement Events (Kaizen)  Standard Work  Visual Controls & Workplace Organization  Value Stream Mapping  5 Why’s – Root Cause Analysis  Setup and Lot Size Reduction  Production driven by TAKT time  One Piece Flow  Pull/Kanban Material Replenishment System  Cellular Manufacturing 38
  • 39. Kaizen Kaizen is a Japanese philosophy of action which signifies change for the better. • The word ‘Kai’ means to take apart and make new, while • the word ‘Zen’ means to think about so as to help others Kaizen is driven by two imperatives: • Solve problems • Eliminate waste (‘Muda’) We apply Kaizen principles repeatedly to continually improve the processes used everyday. Therefore: Kaizen = Thoughtful Acts of Continuous Improvement 39
  • 40. Document Reality Current State (VSM) Plan Countermeasures Future State (VSM) Identify Waste (Non value Added) Reality Check Make Changes Verify Change Measure Results Make this the Standard Celebrate Do It Again In a week or less Made a way of life Kaizen Steps 40
  • 41. Lean = Eliminating the Wastes Value Added Typically 95% of all lead time is non-value added • Transportation • Inventory • Motion • People (Underutilized) • Waiting • Overproduction • Over-processing • Defects Non-Value Added TIM P. WOOD 41
  • 42. Lead Time Reduction Productivity Increase WIP Reduction Quality Improvement Space Utilization 0 25 50 75 100 Percentage of Benefits Achieved Benefits of Lean 42
  • 44. Plan to Succeed Passion Drives Success Running a Successful Kaizen Event 44
  • 45. Planning Represents Success  Organizational  Strategic  Training  Tactical Enterprise Event 25% 25% 25% 25% 100% Every exclusion reduces chances of great Kaizen 45
  • 46. Organizational  Must answer the question “WHY?”  Prepare to answer “W.I.F.M?”  Tie to Business Issues  Develop Executive Buy-in  Participates fully in Prep and activity 46
  • 47. Strategic  Senior Management adopts Kaizen philosophy  Endorses “All hands on deck” Support  Delivers “W.I.F.M.?” and “WHY?” answers.  Participates actively in all phases of Prep and activity 47
  • 48. Training for the War on Waste  No substitute for Hands On  Allows team to focus on goals rather than mechanics of Kaizen  Nuts & Bolts training of Roles and Responsibilities  Establish Kaizen Office and/or methods  Learning Kaizen process is as critical as successes of first Kaizen 48
  • 49. Tactical Planning  Where? How? When? Who?  Eliminates barriers  Creates Objectives, Targets, Metrics  Construct Physical support and “Air Cover”  Structure supported: Kick off meeting, Daily leaders meetings, Final Presentation.  Silo support: Maintenance, Production etc. 49
  • 50. Kaizen Timeline KaizenEvent Organization Prep Strategic Prep Training Prep Tactical Prep Follow up 50
  • 51. Kaizen Event  Life Cycle of the Event  Kaizen Forms  Event Structure  Kaizen Fundamentals 51
  • 52. Life Cycle of an Event  Create Excitement  Resolve Conflict  Implement Resolution  Celebrate Victory 52
  • 53. Forms  Profile, Target, Newspaper are Mainstay  Permanent record  Encourage compliance then creativity  Guiding Documents 53
  • 54. Kaizen Event Area Profile Team # : Event Description: Event Dates: Preliminary Objectives: Team: Production Requirements (Takt Time): Facilitator: Consultant: Process Information: Current Situation and Problems 54
  • 55. KAIZEN EVENT TARGET SHEET Department Number: Team No.: Department Name: Date: Start Target 1st Day 2nd Day 3rd Day 4th Day Space (Sq. Ft.) Inventory (pcs) Walking Distance (ft) Parts Transport Distance Throughput Time Cycletime Volume Per Day Full-time Equivalent Crew Productivity Changeover (Total) Schedule Attainment Safety Improvements Quality Improvements Remarks: 55
  • 56. 56
  • 57. Structure  Leader has Accountability and is responsible for event progress  Management participates  Cross functional contribution  Kickoff Meeting, Daily meeting, Final Presentation  Event closeout 57
  • 58. Fundamentals  Bias towards Action  Focus on Gemba “shop floor, place of event etc…”  Drive Objectives, Park others  Ask “WHY?” 5 times  Try-storm, not brainstorm: 1. It is not important to create perfect solutions. 2. Be action-oriented. 3. Keep solutions simple.  Leave very few Newspaper Items 58
  • 59. Important  Create and implement structure to support Follow up  Make MUDA “waste” the enemy  Debrief the event  Build on successes 59
  • 62. What is a Value Stream A Value Stream is the set of all actions (both value added and non value added) required to bring a specific product or service from raw material through to the customer. • “Whenever there is a product (or service) for a customer, • there is a value stream. The challenge lies in seeing it.” 62
  • 63. “The purpose of a Value Stream Map is to identify What’s going on and where it’s going wrong” Joe Perillo 63
  • 64. Value Stream Map  One of the most important tools of a lean management analyst is the process of value stream mapping.  A value stream map outlines in detail every step of the process in its current state by documenting material and information flows.  This allows the team to visually see the non value added waste within the process.  Once the waste has been identified, action plans are established to reduce or eliminate the waste thus improving the efficiency of the process. 64
  • 65. Value Stream Mapping Process  Follow a “product” or “service” from beginning to end, and draw a visual representation of every process in the material & information flow.  Then, draw (using icons) a “future state” map of how value should flow. 65
  • 66. Using Value Stream Mapping Visual representation of how material and information flows in the business today Product family Current state drawing Future state drawing Plan & Implementation Drawn using lean principles Current State - Invoice Payment Future State – Coax Line 66
  • 67. Levels of a Value Stream Process Level Single Location (door to door) Multiple Facilities Across Companies Start Here 67
  • 68. Types of Value Stream Maps  A typical value stream map will outline every step in the process from customer order to delivery of a product or service. 7:35 68
  • 69. Current State Mapping  Completed in 1-3 days depending on the complexity of the process being mapped  Performed by a cross functional team of individuals that perform steps within the process being evaluated  Resulting in a picture along with team observations of what we “see” when following the product or service 69
  • 70. Future State Mapping  Completed in 1-3 days with the same team  Focused on:  Creating a flexible, reactive system that quickly adapts to changing customer needs  Eliminating and reducing waste  Creating flow  Producing and delivering on demand 70
  • 71. Value Stream Managers “A.K.A. Lean Management Analyst” Each Value Stream needs a Value Stream Manager The conductor of implementation: •Focused on system wins •Reports to the top dog Process 1 Process 2 Process 3 “Customer” The Value Stream Manager Kaizen 71
  • 72. Don’t Wait! You need a plan! • Tie it to your business objectives. • Make a VS Plan: What to do by when. • Establish an appropriate review frequency. • Conduct VS Reviews walking the flow. Planning and Implementing 72
  • 73. The Five Step Value Stream Process Review 1. Specify value from the standpoint of the end customer. 2. Identify all the steps in the value stream and eliminate whenever possible those steps that do not create value. 3. Make the value-creating steps occur in tight sequence so the product or service will flow smoothly toward the customer. 4. As flow is introduced, let customers pull value from the next upstream activity. 5. As value is specified, value streams are identified, wasted steps are removed, and flow and pull are introduced, begin the process again and continue it until a state of perfection is reached in which perfect value is created with no waste. 73
  • 74. Week 5 •Basic 5-S 1.Sort, 2.Set in order, 3.Shine, 4.Standardize & 5.Sustain •Sustainment and measurement •Dash boards 74
  • 75. BASIC 5-S SORT, SET IN ORDER, SHINE, STANDARDIZE & SUSTAIN 75
  • 76. Definition • Sort out necessary and unnecessary items. • Store items used frequently at the work area, infrequently used items store away from the work area, and dispose of items that are not needed. Why • Gain Space •Easier to visualize the process • Safer work area •Remove waste “Muda” Remember • Sort though all items in one area. • Red tag items which can not be removed right away. • Make sure everyone in the area agrees that an item should be removed. • Make sure reasons for keeping items are viable. Examples • Many documents in the work area are never used. Remove them. • Crowded offices often have blocked aisles, making the space feel confined. Open up the aisles. Are the items needed? • Extra furniture contributes to the clutter. Remove unused furniture. SORT (Decide on what is needed) 76
  • 77. SET IN ORDER Definition • Arrange all necessary items. • Designate areas for all items. • A place for everything and everything in its place. Why • Eliminate searching for items. • Visually show what is out of place. • Make it easier to do the work required. Remember • Use labels, signs, tape, & shadows to make it easy to locate items. • Items which are used together, should be kept together. • Locate sharable items in a central location. • It should be easy to find everything. Examples • Label filing cabinets to make it easier to find files. • Items have good visual controls. • Keep only the amount you need at the work station. (Arrange needed items for ease of use) 77
  • 78. Set in Order – Shadow board used for those frequently used tools 78
  • 79. Results of Sort and Set In Order: After:Before: No organization leads to missing tools and equipment. Time to search for correct tool is pure waste. Tools are now organized and labeled for quick retrieval. Each tool has a designated area for storage. 79
  • 80. SHINE (Cleanliness) Definition • To keep the area clean on a continuing basis. Why • To keep area from getting dirty in the first place, so we don’t have to clean it up afterwards. • A clean workplace is nicer to work in. • A clean workplace is indicative of a quality product and process. • Dust and dirt cause potential health problems and many people have allergies to them. Remember • Clean all areas, including cabinet top and insides. • Vacuum / Dust / Mop / Paint Examples • Equipment and furniture should look “like new” • All documents should look like they were just posted or printed. 80
  • 81. Shine – Clean and inspect. Team members cleaning target areas. 81
  • 82. STANDARDIZE (Maintain the first 3S’s) Definition • To maintain guidelines - Sort, Set In Order, Shine Why • Prevents regression back to an unclean / disorganized environment. • Eliminates the need for “Special Clean-up Efforts” Remember • Develop schedules and checklist. • Evaluate the areas using the 5S ratings. • Continually improve neatness Examples • Maintain furniture and equipment by using schedules. • 5S Ratings posted and continually updated. 82
  • 83. The 3 Elements of Standardized Work 1. Takt time, which is the rate at which products must be made in a process to meet customer demand 2. The precise work sequence in which an operator performs tasks within Takt time 3. The standard inventory, including units in machines, required to keep the process operating smoothly 83
  • 84. Standard Work A picture is worth a thousand words 84
  • 85. SUSTAIN (Disciplined Culture) Definition • To maintain discipline, we need to practice and repeat until it becomes a way of life. • Always look for ways to improve your area. Why • To build ‘housekeeping” into the everyday process. • To keep from falling back to the unclean / unorganized area that use to exist. Remember • Training everyone is vital. • Involvement from all is necessary. • Commitment and discipline toward 5S is essential in taking the first step to being World Class Examples • Everyone keeps their furniture, equipment, supplies organized and spotless daily. • Always look for ways to do things easier and more efficiently. 85
  • 87. Business Evaluation  Are you measuring your business  What are you measuring  How are you measuring  When are you measuring (before, during or after it happens).  What are you doing with the information 87
  • 88. What Are You Measuring  Voice of the customer  Customer satisfaction  On time delivery (Perfect Order)  Scrap or salvage  Daily Unit Orders/Back Log  Fill Rate or Availability  Revenue  Cost  Profit  Productivity  Quality  Inventory turns and value  Standard work  Visual controls  Preventive and predictive maintenance  Lead times 88
  • 89. Definition of the Perfect Order 1. The Right Product 2. In the Right Quantity 3. From the Right Source 4. To the Right Destination 5. In the Right Condition 6. At the Right Time 7. With the Right Documentation 8. For the Right Cost. 89
  • 90. Four Elements that Effect Overall Business Performance 1. Financial burdens, shortcomings, overhead, costs and revenue. 2. Customer satisfaction (perfect order index) 3. Understanding business educational needs and keeping up on the technology surrounding your business 4. Continuous improvement, maintaining optimum efficiency and the elimination of waste or non value added activities 90
  • 91. Measuring Your Business  Implement lean tactics that achieve the objectives by prioritizing the lean efforts for the greatest gains.  Establish metrics that incorporate lean initiatives that drive the organization to achieve the objectives.  Work in effectively in cross functional teams  Governance—establishing organizational structures that will accelerate the rate of decision-making within your company.  Roles and responsibilities—defining divisions of responsibilities to intelligently balance resources for organizational change with capabilities and knowledge.  Performance management and incentives—implementing effective new systems of organizational change measurement, feedback, and compensation to identify and reward the true drivers of performance at the individual, functional, and corporate level.  Organizational structure—streamlining reporting and management structures and ensuring they are suitable for your decision-making processes and targeted measures of success. 91
  • 93. Maximizing Results Via Metrics  To maximize the effectiveness of the organization’s efforts, it is necessary to have:  Clear, high-level goals,  The means to make those goals meaningful to persons throughout the organization, and  A system to review and modify goals at all levels as the situation evolves.  The basis for this system is the metric. Show me how a person or organization is measured, and I’ll tell you how the person/organization is behaving. 93
  • 94. Dashboards Definition  “Dashboards” are a compilation of standardized performance measures. These measurements are designed to:  Facilitate achieving objectives  Provide feedback  Enable learning  Dashboard measurements should accomplish each of the above at all levels of the company.  They should be clearly defined, simple to produce, and easily understood by users.  Dashboards are the tactical tool used to measure and track project performance. 94
  • 95. Management of Goals:  Dashboards – Used to measure and track performance to meet operational goals.  Determine key performance indicators in four areas which cover the past, present and future of the firm:  Financial – Share price, sales, profits, return on investment.  External – Customer satisfaction “On Time Delivery”, warranty returns, repeat orders, market share.  Internal – Business process performance, operational efficiency, scrap rates, R&D cycle times, employee turnover.  Learning and Growth – Staff training, suggestions made and implemented, percentage of work hours working in teams. 95
  • 96. Dashboards Should...  Be well integrated, ensuring that every level of the organization has metrics that support the goals and strategies of the entire enterprise  Drive accountability for achieving goals throughout the organization  Be well-balanced – measuring improvement in multiple, balanced metrics to ensure driving the right behavior 96
  • 97. Dashboard Measurements  Characteristics of a Good Measurement:  Specific  Measurable  Achievable and Verifiable  Realistic  Timely 97
  • 98. Dashboards need to meet your business requirements Develop dashboard metrics that will meet the business requirements depending on the complexity or simplicity of your organization. 98
  • 99. Dashboards communicate symptoms. If goals are not being met, you need to find the cause and resolve it! 99
  • 100. Week 6 •Supply Chain Management 100
  • 101. Supply Chain Management & Logistics Opportunities for Continuous Improvement 101
  • 102. SSupplyupply CChainhain MManagementanagement  Supply Chain (SC): the sequence of organizations - their facilities, functions, and activities - that are involved in producing and delivering a product or service  Facilities include warehouses, factories, processing centers, distribution centers, retail outlets, and offices Sometimes referred to as value chains 102
  • 103. The goal of every firm should be to maximize the financial and service performance of the company. In order to do that, you need to make sure you’re focusing in on your customers with the right strategies in a specific sequence. Focus on the customer through the service strategy, this means supporting the current and perspective customers.  Maximizes the service objectives that meet the financial goals of the firm.  Make sure you have the right inventory strategy- and that strategy lines up with the Customer Service Strategy.  The Production Strategy utilizing lean principles that also incorporate the cultural impact on the people within the organization.  The Procurement Strategy that supports the production strategy.  The Logistics Strategy that supports the internal and external customer.  The Distribution Strategy that supports the external customer. All these strategies prioritized in that order must align with the financial and service objectives of the company that will meet the perfect order metric. There is an order to going about addressing each one so they line up making sure the performance measurements provide feedback in making sure these strategies line up. 103
  • 104. Is the firm meeting the perfect order metric?  The Right Product in the  Right Quantity to the  Right Destination in the  Right Condition at the  Right Time with the  Right Documentation for the  Right Cost. Most companies only focus on one and then try to optimize that area alone, forgetting that they must all fit and be aligned. 104
  • 105. Leaders need to ask themselves these questions.  Is the customer satisfied with the level of service they are receiving?  What improvements have we made to improve the area that does not meet the customer’s level of service requirements or the financial goals of the firm? 105
  • 106. TTypicalypical SSupplyupply CChainshains Purchasing Receiving Storage Operations Storage Production Distribution 106
  • 107. TTypicalypical SCSC for afor a MManufactureranufacturer Supplier Supplier Supplier Storage } Mfg. Storage Dist. Retailer Customer 107
  • 108. Supplier Supplier }Storage Service Customer TTypicalypical SCSC for afor a SServiceervice 108
  • 109. 1. Improve operations 2. Increasing transportation costs, globalization, and increasing levels of outsourcing 3. Competitive pressures 4. Increasing importance of e-commerce 5. Manage inventories: Bullwhip effect NNeed foreed for SCSC MManagementanagement 109
  • 110.  Buying goods or services instead of producing or providing them in-house  Benefits – better, cheaper, or more efficient materials, parts, or services; expertise and knowledge; added flexibility  Risks – loss of control; greater dependency; loss of the ability to perform in-house OOutsourcingutsourcing 110
  • 111. GGloballobal SSupplyupply CChainshains  Increasing more complex  Language  Culture  Currency fluctuations  Political  Transportation costs  Local capabilities  Finance and economics  Environmental 111
  • 112. EElements oflements of SCSC MManagementanagement Deciding how to best move and store materialsLogistics Determining location of facilitiesLocation Monitoring supplier quality, delivery, and relationsSuppliers Evaluating suppliers and supporting operationsPurchasing Meeting demand while managing inventory costsInventory Controlling quality, scheduling workProcessing Incorporating customer wants, mfg., and timeDesign Predicting quantity and timing of demandForecasting Determining what customers wantCustomers Typical IssuesElement 112
  • 113.  Movement of materials, services, cash, and information in a SC. Major issues:  Movement within a facility  Incoming and outgoing shipments  Traffic management  Distribution requirements planning (DRP)  A system for inventory management and distribution planning  Third-party logistics (3-PL)  The outsourcing of logistics management  Reverse logistics LLogisticsogistics 113
  • 114. MMovementovement WWithin aithin a FFacilityacilityRECEIVING Storage Work center Work center Work center Storage Work center Storage Shipping 114
  • 115. EEffectiveffective SSupplyupply CChainhain  Requires linking the market, distribution channels processes, and suppliers  Supply chain should enable all participants in the chain to achieve significant gains:  Share forecasts  Determine the status of orders in real time  Access inventory data of partners  E-procurement is becoming increasingly common 115
  • 116. SSuccessfuluccessful SSupplyupply CChainhain  Trust among trading partners  Effective communications  Supply chain visibility  Event-management capability  The ability to detect and respond to unplanned events  Performance metrics  The SCOR model reflects an effort to standardize measurement of supply chain performance 116
  • 117. SSupplyupply CChainhain MMetricsetrics Perspective Metrics Reliability On-time delivery Order fulfillment lead time Fill rate (fraction of demand met from stock) Perfect order fulfillment Flexibility Supply chain response time Upside production flexibility Expenses Supply chain management costs Warranty cost as a percent of revenue Value added per employee Assets/utilization Total inventory days of supply Cash-to-cash cycle time Net asset turns 117
  • 118. CPFRCPFR  Collaborative Planning, Forecasting, and Replenishment (CPFR): A supply chain initiative that focuses on information sharing among supply chain trading partners  For purposes of planning, forecasting, and inventory replenishment  Incorporates key information such as promoting timing and supply constraints  Forecasts can be frozen and then converted into a shipping plan, eliminating typical order processing 118
  • 119. 1. Develop strategic objectives and tactics 2. Integrate and coordinate activities in the internal supply chain 3. Coordinate activities with suppliers with customers and planning and execution across the supply chain 4. Form strategic partnerships: Two or more business organizations that have complementary outputs join so that each may realize a strategic benefit SSteps inteps in CCreating anreating an EEffectiveffective SCSC 119
  • 120. SSupplyupply CChainhain PPerformanceerformance DDriversrivers  Quality  Cost  Flexibility  Velocity  Inventory velocity: The rate at which inventory (material) goes through the supply chain  Information velocity: The rate at which information is communicated in a supply chain  Customer service 120
  • 121. Week 7 •Learning to See Through the Symptoms •Leadership Through Influence •Cultural Change 121
  • 122. Learning to See Through the Symptoms “Find the Root Cause” 122
  • 123. 5 Whys  Often, just like a doctor, we see symptoms (fever, nausea).  To get to the underlying cause (the disease) or the “root cause”, we need to ask the question “Why” 5 times. 123
  • 124. 5 Whys Example Problem Statement: You are on your way home from work and your car stops in the middle of the road What are some solutions to this problem? 124
  • 125. 5 Whys Example Problem Statement: You are on your way home from work and your car stops in the middle of the road 1. Why1. Why did your car stop?did your car stop? - Because it ran out of gas.- Because it ran out of gas. 2. Why2. Why did it run out of gas?did it run out of gas? - Because I didn't buy any gas on my way to work.- Because I didn't buy any gas on my way to work. 3. Why3. Why didn't you buy any gas this morning?didn't you buy any gas this morning? - Because I didn't have any money.- Because I didn't have any money. 4. Why4. Why didn't you have any money?didn't you have any money? - Because I lost it all last night in a poker game.- Because I lost it all last night in a poker game. 5. Why5. Why did you lose your money in last night's poker game?did you lose your money in last night's poker game? - Because I'm not very good at "bluffing" when I don't have a good hand.- Because I'm not very good at "bluffing" when I don't have a good hand. 125
  • 126. Follow the Symptoms to the Root Cause  A woman meets with her Doctor to address a pain in her shoulder.  The Dr attributes it to normal aches and pains and prescribes a pain reliever. Question:  Did the Dr treat the symptom or the cause? 126
  • 127. Follow the Symptoms to the Root Cause  By seeing through the symptoms the Dr could have asked several questions that would have lead to the cause of the pain. 127
  • 128. Root Cause Analysis Why do sales drop off at a specific time of year?  A grocery store located in the upper Midwest could not understand why at a certain time every winter sales plummeted. They studied their product line and interviewed customers. They did everything possible to uncover the mystery. Finally, someone made a remarkable discovery that changed everything. 128
  • 129. Follow the Symptoms to the Root Cause  It seemed that whenever it was really cold outside, the manager raised the temperature in the store. When customers came into the store it was too warm for them, so they removed their coats and placed them in their shopping carts. This meant less room for food and resulted in reduced sales overall. They lowered the temperature of the store, and as a result, the sales climbed back to the levels they were accustomed to. Their adjustment resulted in restoring sales levels. 129
  • 130. Be Patient  As you walk through your plant, waiting room, service area, purchasing department, accounting department etc…  Look through the symptoms of waste such as rejects, waiting, unnecessary movement, long lead times, poor customer satisfaction etc…  These are opportunities for continuous improvement but we will miss the chance to solve the root cause if we stop short at only fixing the symptoms. 130
  • 132. Servant- Leadership Defined  Servant leadership is defined as an approach to leadership development, which emphasizes the leader’s role as steward of the resources (human, financial and otherwise) provided by the organization.  It encourages leaders to serve others while staying focused on achieving results in line with the organization’s values and integrity.
  • 133. Servant Leader A servant leader serves constituents by working on their behalf to help them achieve their goals, not the leader’s own goals.  Places service before self-interest  Listens first to express confidence in others  Inspires trust by being trustworthy  Focuses on what is feasible to accomplish  Lends a hand  Provides tools
  • 134. Servant Leadership  Continuous improvement or lean tools are important foundational strategies, but they can't deliver effective or sustainable results unless we establish an organization that promotes a continuous learning environment.  This requires leaders with a teachable spirit or leaders that want to create a safe environment that promotes problem solving through experimentation.  Creating this kind of environment in an organization changes the role of a leader from boss to teacher, from manager to coach or as some would call, a servant leader.  If you review the role of a leader you can see that they serve the people they lead by giving them the tools, resources, support, direction and vision that ultimately reach the customer.  This type of leadership creates an organization that is continually learning along with developing and organization of problem solvers.
  • 135. Ten Characteristics of Servant Leadership Listening Empathy Healing Awareness Persuasion Conceptualization Foresight Stewardship Commitment to growth of others Building Community Larry Spears, director of the Robert K Greenleaf Center for Servant Leadership, identified ten characteristics.
  • 136. Commitment to the Growth of Others  Servant-leaders believe that people have an intrinsic value beyond their tangible contributions as workers.  Servant-leaders are deeply committed to a personal, professional, and spiritual growth of all individuals in the organization.  As we grow the organization, there is still a need to build a sense of community.
  • 137. “Leadership Through Influence Rather than Influence Through Leadership” Joe Perillo  There is a saying, “it is far more impressive to see a flock of sheep following a lion rather than a lion following a flock of sheep”. 137
  • 138. The Law of Influence  What platform have you built for performance?  What is your track record?  What daily actions enhance your ability to influence your organization?  Leadership Lesson:  “True leadership cannot be awarded, appointed or assigned. It comes from influence.” “The True Measurement of Leadership Is Influence – Nothing More, Nothing Less” 138
  • 139. Leadership Through Influence  Leadership is a complex function, as a leader you are many things to many people with different needs and abilities. Leading people with these challenges requires skills that do not always come naturally and in some cases the skills you learned will not get you to the next level of success.  Your past success has gotten you to where you are. To get to the next level requires learning new skills, mastering new things. And as a leader the way we ultimately become successful is by getting greater results from those we lead.  The same way a football coach can’t win a game by themselves we see clearly to be a successful leader we must become great coaches of others.  Zig Ziglar may have said it best: “You can get anything in life you want, if you are willing to help enough other people get what they want.”  Leadership and coaching go hand in hand when working with people to accomplish a goal or task. As you develop others you help them get the job satisfaction, peace of mind, security that comes with greater skills, and opportunities. As a leader and a coach we must encourage, persuade and support.  The leadership through influence philosophy blends the role of leader and coach as you lead as a lean management analyst so you can be successful by helping others become more effective and efficient. 139
  • 140. “DON’T LET WHAT YOU KNOW GET IN THE WAY OF YOUR GROWTH” 140 Joe Perillo
  • 141. Manager vs. Leader  For many people in business, obtaining a master's degree has been instrumental in their career achievements.  However, some masters degree curriculums teach people how to be managers, not how to be leaders.  The problem is that almost all continuous-improvement efforts require leaders, not managers. 141
  • 142. Developing Lean Leaders  It is the behavior of leaders that matters since they create the culture.  Leaders develop and communicate the vision that shape the environment of the organization and the way it operates.  Developing leaders who will sustain, support and build a lean culture involves training and developing leaders who have influence.  The “Leadership through influence rather than influence through leadership” model teaches that true cultural change can only happen when people follow leaders who lead by example.  Lean is more than just improving operations. It is every step between the customer and order fulfillment.  Often considerable value can be achieved by applying lean principles but true cultural change comes from a coordinated leadership approach to bring it all together. 142
  • 143. Four Foundational Pillars Leaders  Model the Way  Focus on the Future  Empower Employees Strategy  Vision is Set and Continuously Shared  Tactics Roll Up and Down Through the organization Culture  Data Drives Decision Making  Do What is Best for the Organization  Accountability is ExpectedOperational Excellence  The relentless pursuit of perfection 1.Leadership (Model the way, Provide Support, Have a Servant Attitude) 2.Culture (Continuous improvement attitude) 3.Operational Excellence (Perfect order, on time delivery & inventory management) 4.Strategic Vision (Provide the vision, set the course, follow-up and follow Through) 143
  • 144. The Importance of Culture in a Lean Transformation 144
  • 145. Cultural Change  Achieving true cultural change one has to be committed to being teachable and driven to create an environment of continuous improvement.  To implement lean or anything associated with business process improvement requires leaders who are honest with themselves and the people they lead  In general people are comfortable with not changing, they are happy with the “status quo” its easer not having to confront or challenge current practice.  Your challenge will be to influence cultural change through your actions as a leader. 145
  • 146. “Culture Shock”  As a lean leader you will be challenged to lead diverse groups that are either just starting out with little experience or have many years of experience.  In each circumstance they bring their own unique set of challenges one of which is a cultural shock 146
  • 147. Changing the Culture  As you begin your lean journey you will encounter two realities when taking on lean transformation. 1. The first involves the physical changes that help reduce waste. 2. The second involves the changing of the existing culture.  Experienced lean practitioners understand that making physical changes in the reduction of waste is much easier than changing the cultural landscape of an organization.  Sustainability is the key to long term effectiveness and the only way we can achieve sustainability is by changing the culture.  Creating a new standard of how people approach a challenge or a problem even how they work. The change in culture also applies to how people approach each other and how they communicate.  Measuring organizational performance will change the focus from the individual to the entire team.  A continuous improvement culture requires more than just going through the motions of a physical plant layout or process changes, it requires a change in how we approach everything we do. 147
  • 148. “Is There a Better Way”  One of the eight wastes is the underutilization of people. In a traditional operation the culture usually pushes the ideas from management down to the front lines. In a lean culture the ideas are coming from the experts who do the job every day.  Management is responsible to create an environment that allows for ideas to flow freely in a non threatening environment even when mistakes are made.  Management is responsible for creating a culture that drives the entire organization to ask the question “Is there a better way”  Once we begin asking the questions “Is there a better way” it is the responsibility of management to create the vision and support all efforts that will help the organization succeed. 148
  • 149. Teachable Spirit  At the heart of any change is the individual with a teachable spirit, without it change will not happen because the individual believes his or her way is best.  The basic principle of continuous improvement is that perfection is pursued and not achieved.  If perfection is achieved it is short lived due to changes in technology, material and customer requirements. 149
  • 150. Breaking Records  World records are achievements of perfection but records were meant to be broken, history has proven this time and time again.  Individuals who set out to break these records, challenged the status quo by confronting the methods of achieving a new world record by becoming faster and stronger. 150
  • 151. “An organization that lacks leaders with a teachable spirit cannot influence true cultural change” Joe Perillo 151
  • 152. 152

Editor's Notes

  1. The scene represents an awakening from our inability to see waste in our value stream. Waste is limiting our ability to increase our competitive advantage. The awakening represents an individual that truly understands and utilizes lean principles which allows them to eliminate or reduce waste in any process thus creating the leverage opportunity needed to gain both a competitive advantage and the ability to deliver additional value to the customer.