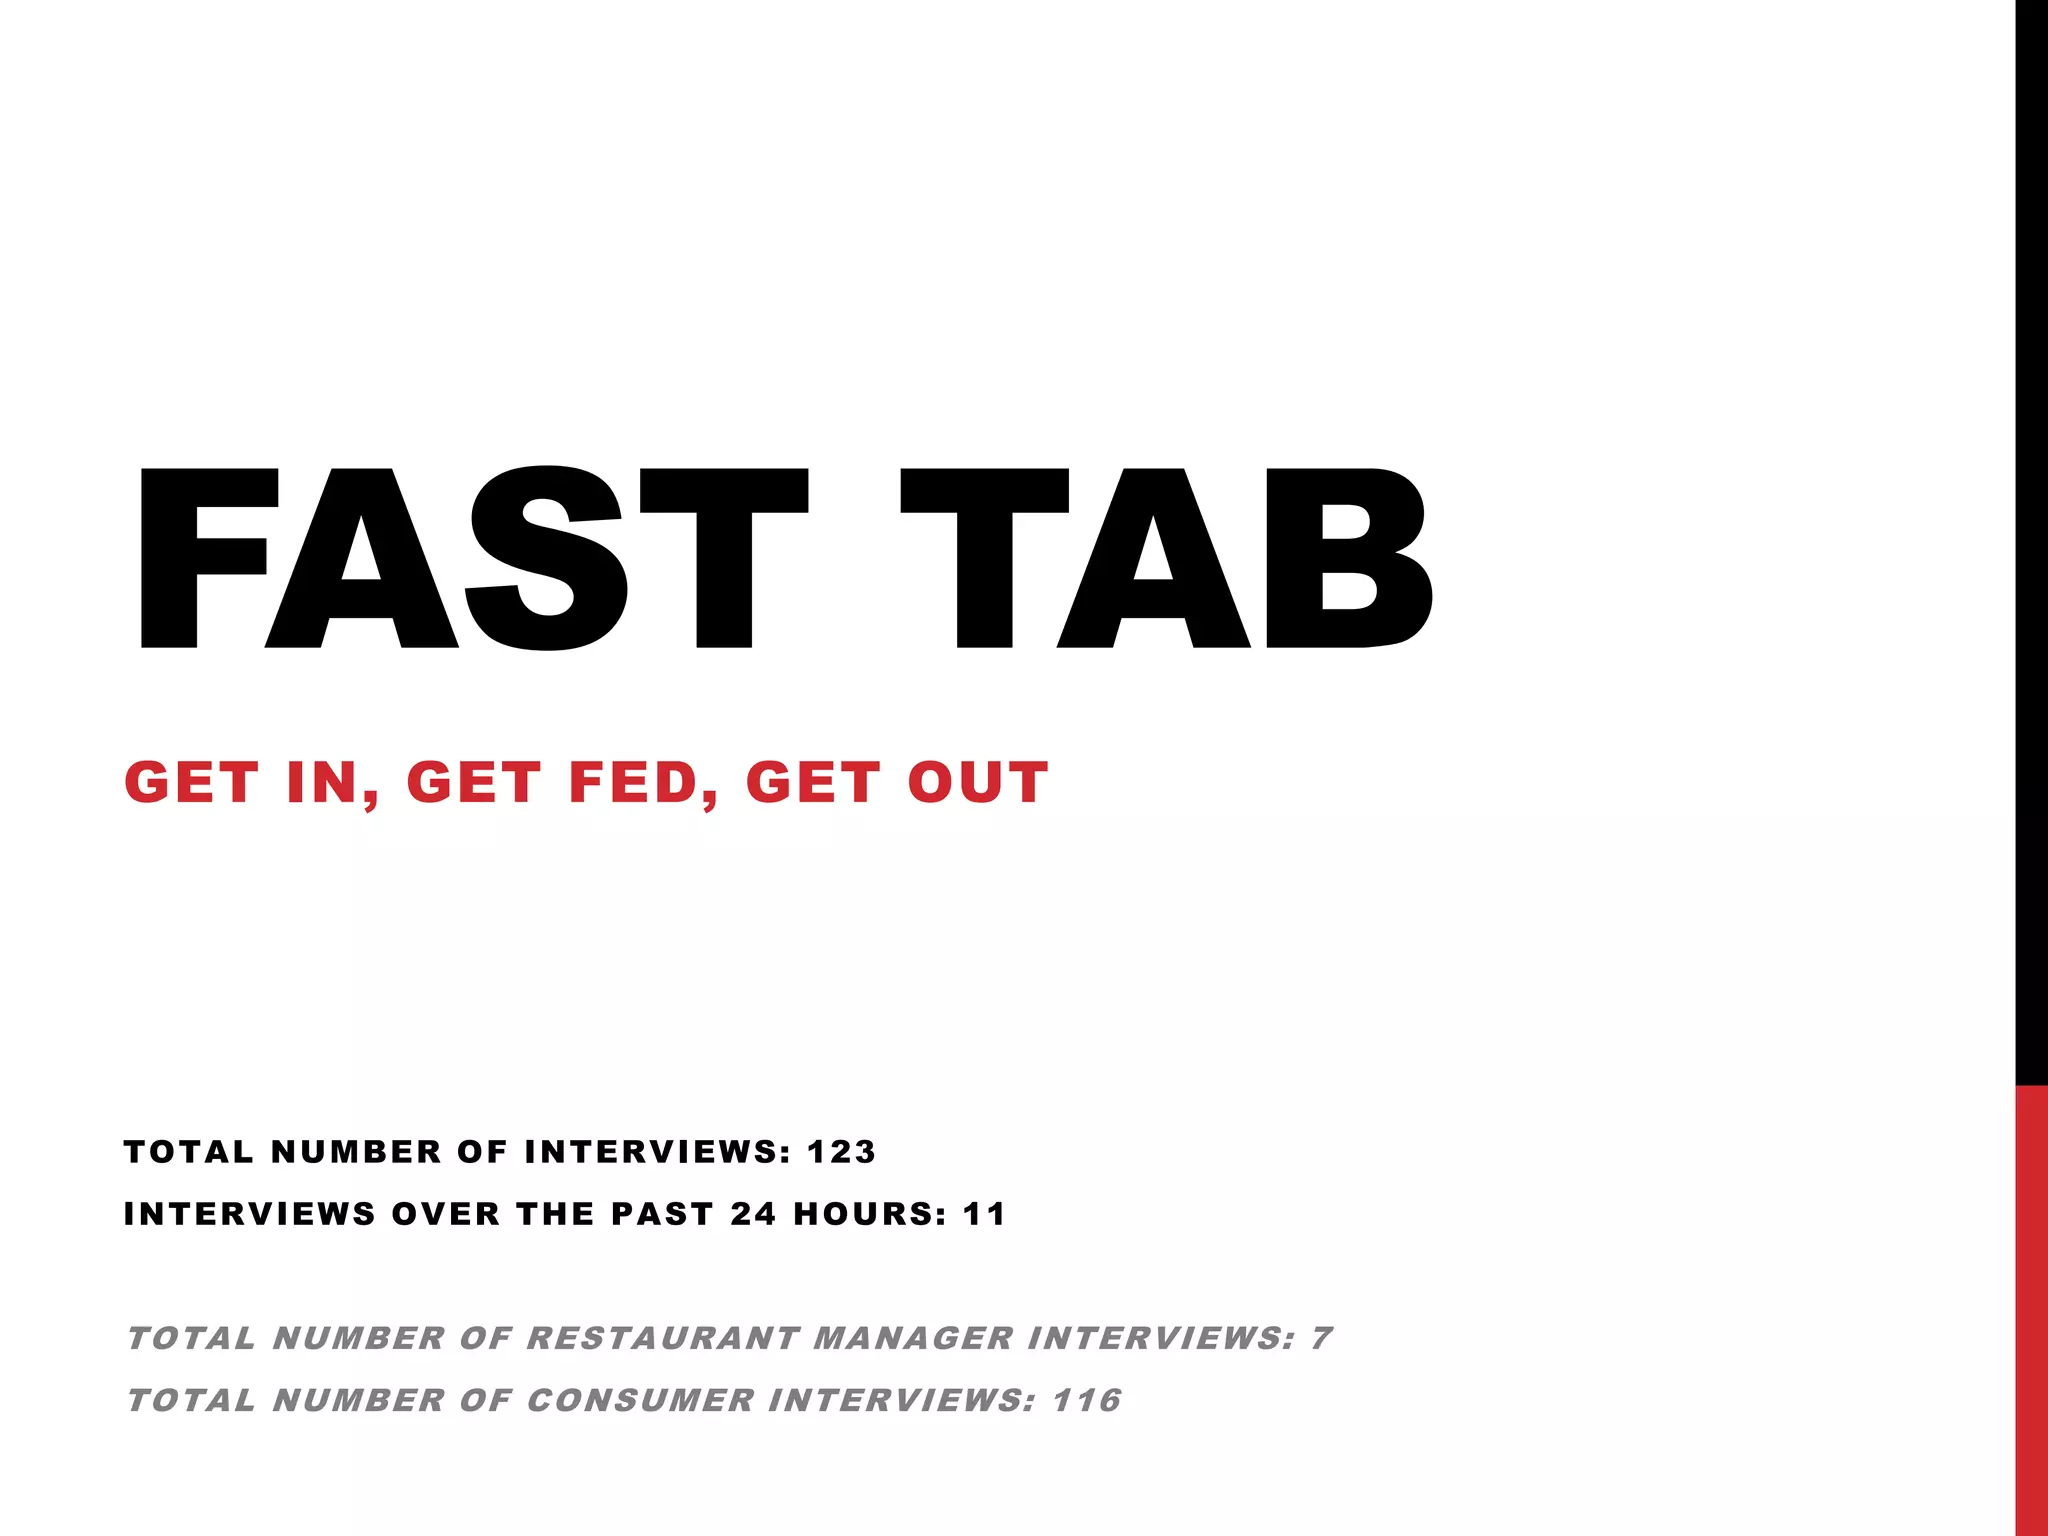
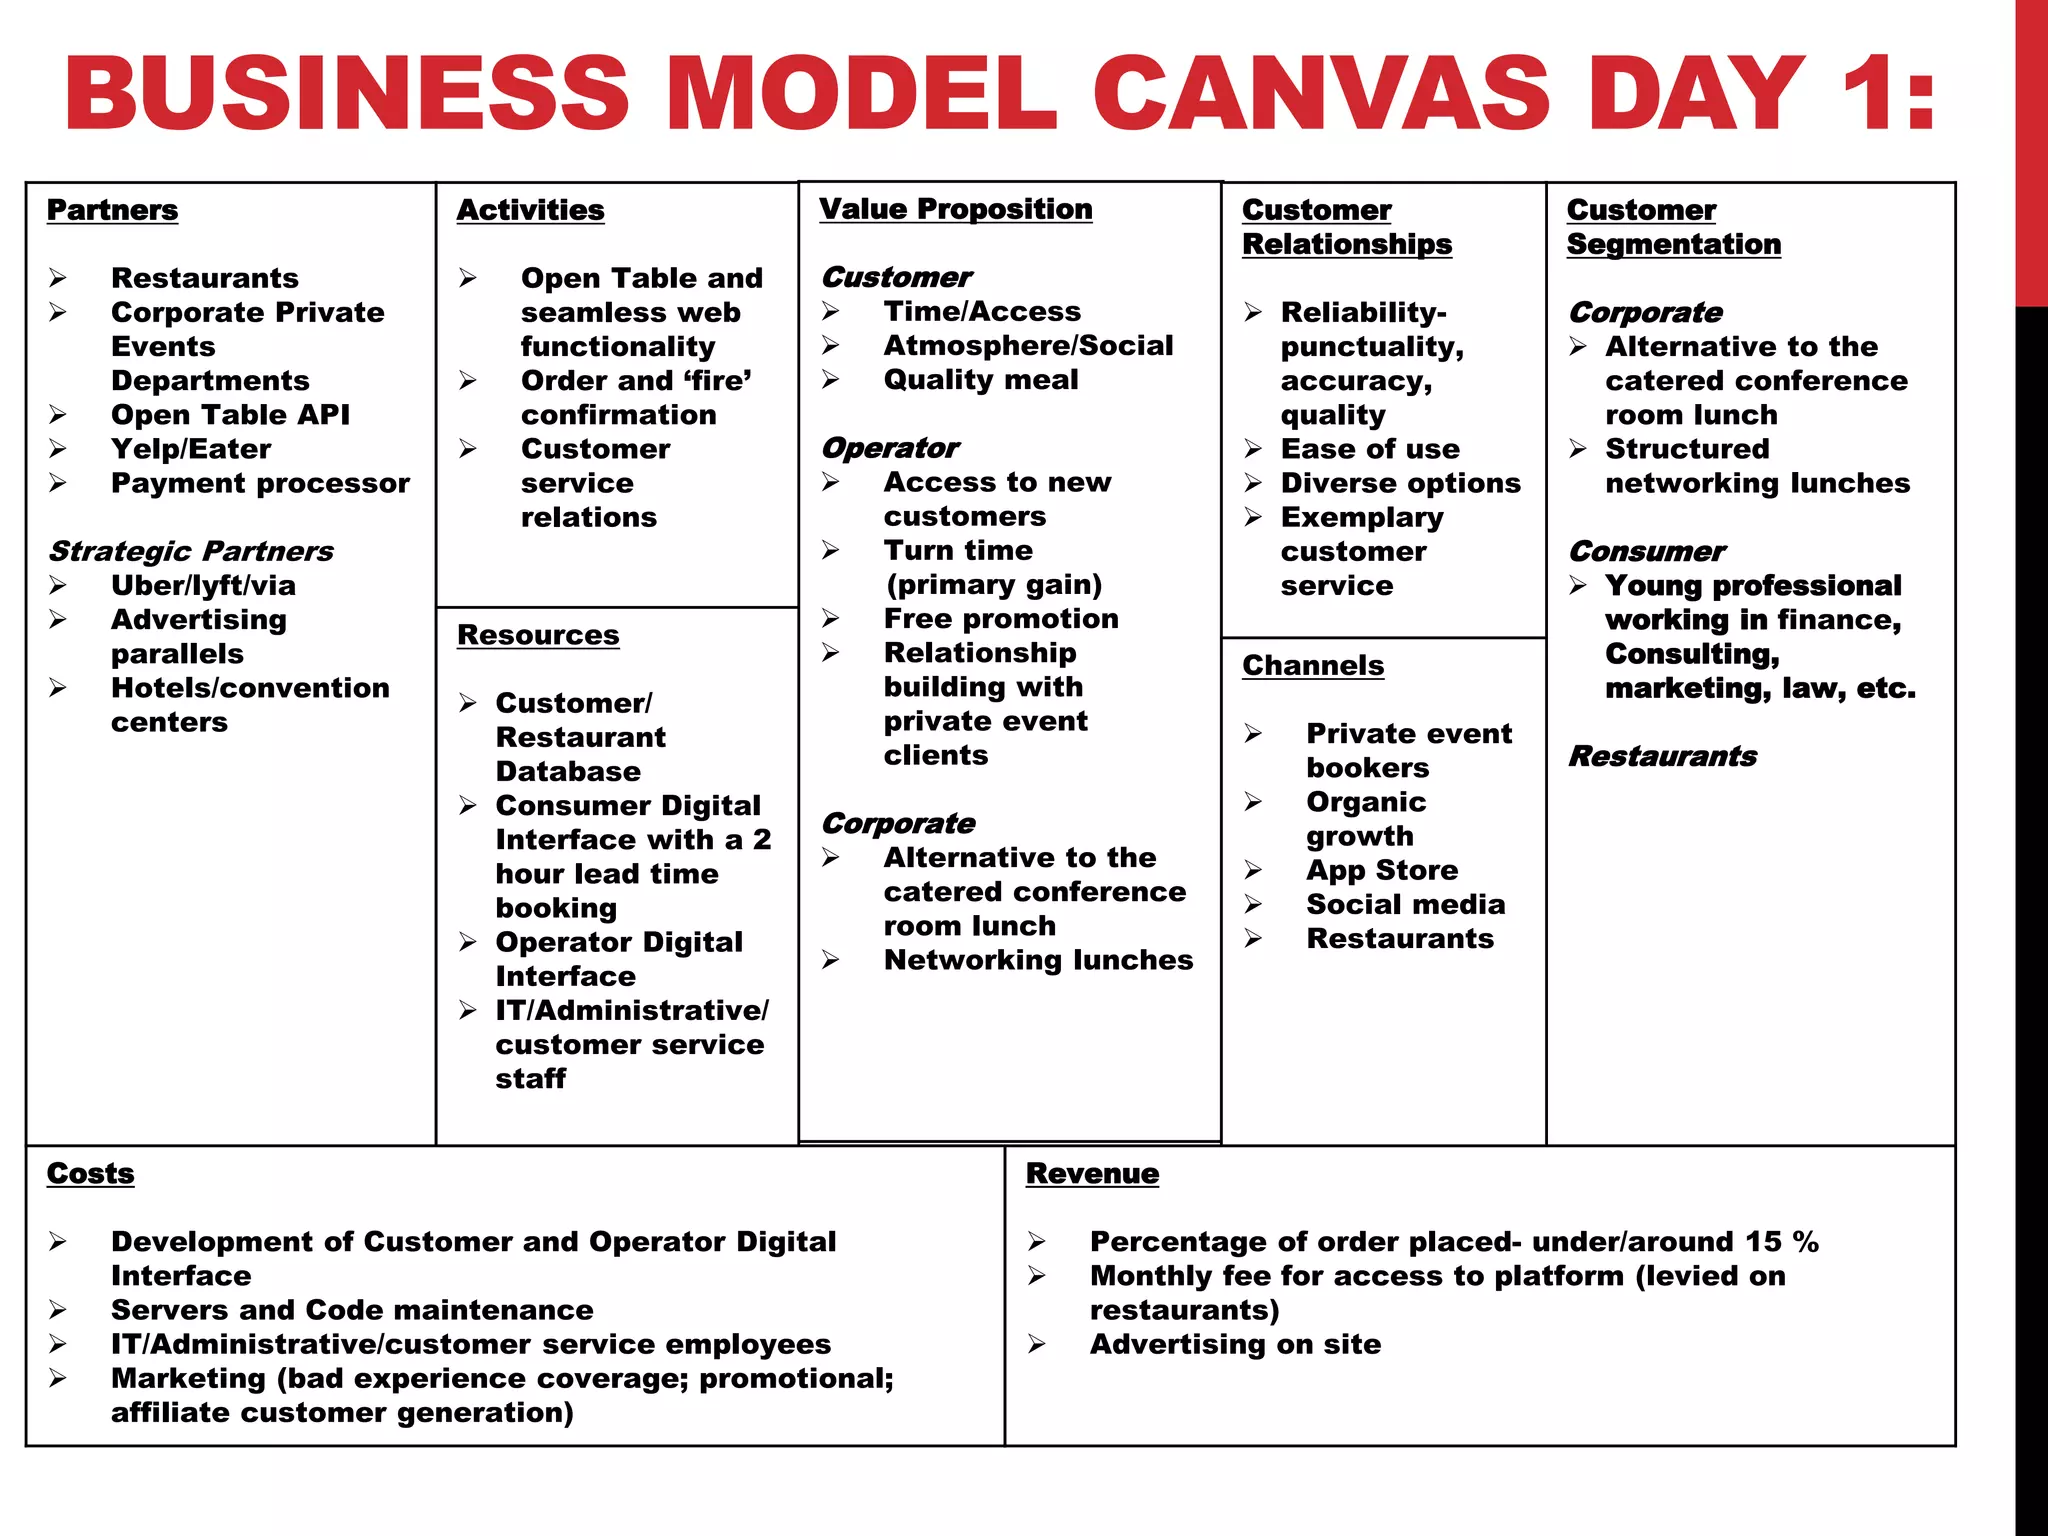
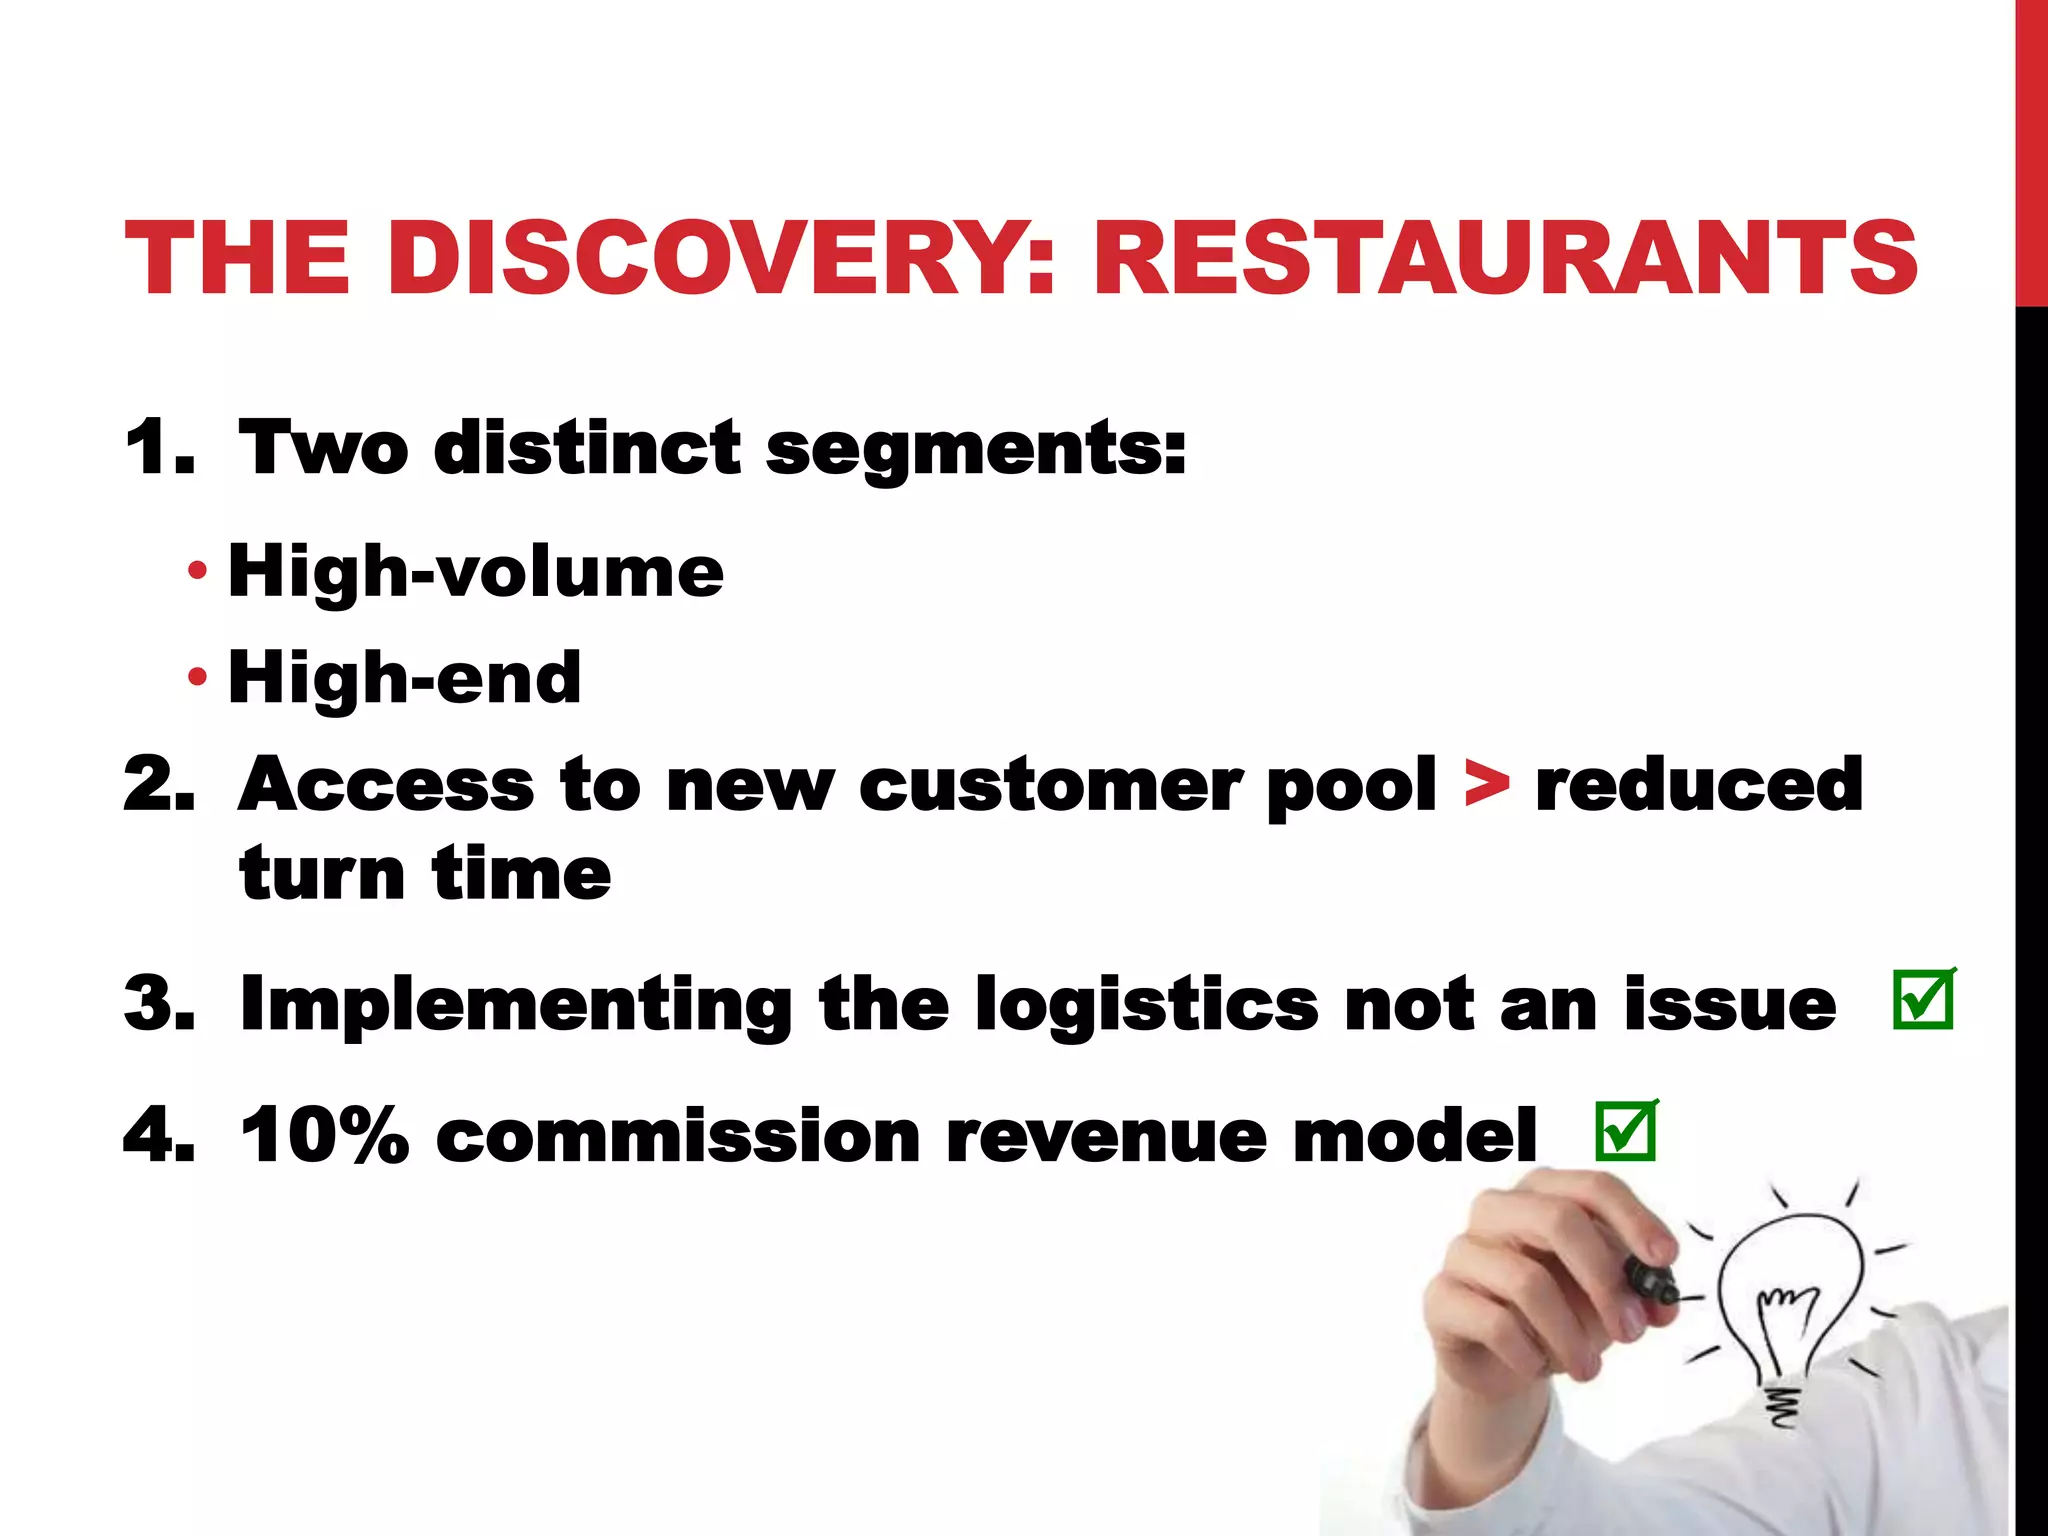
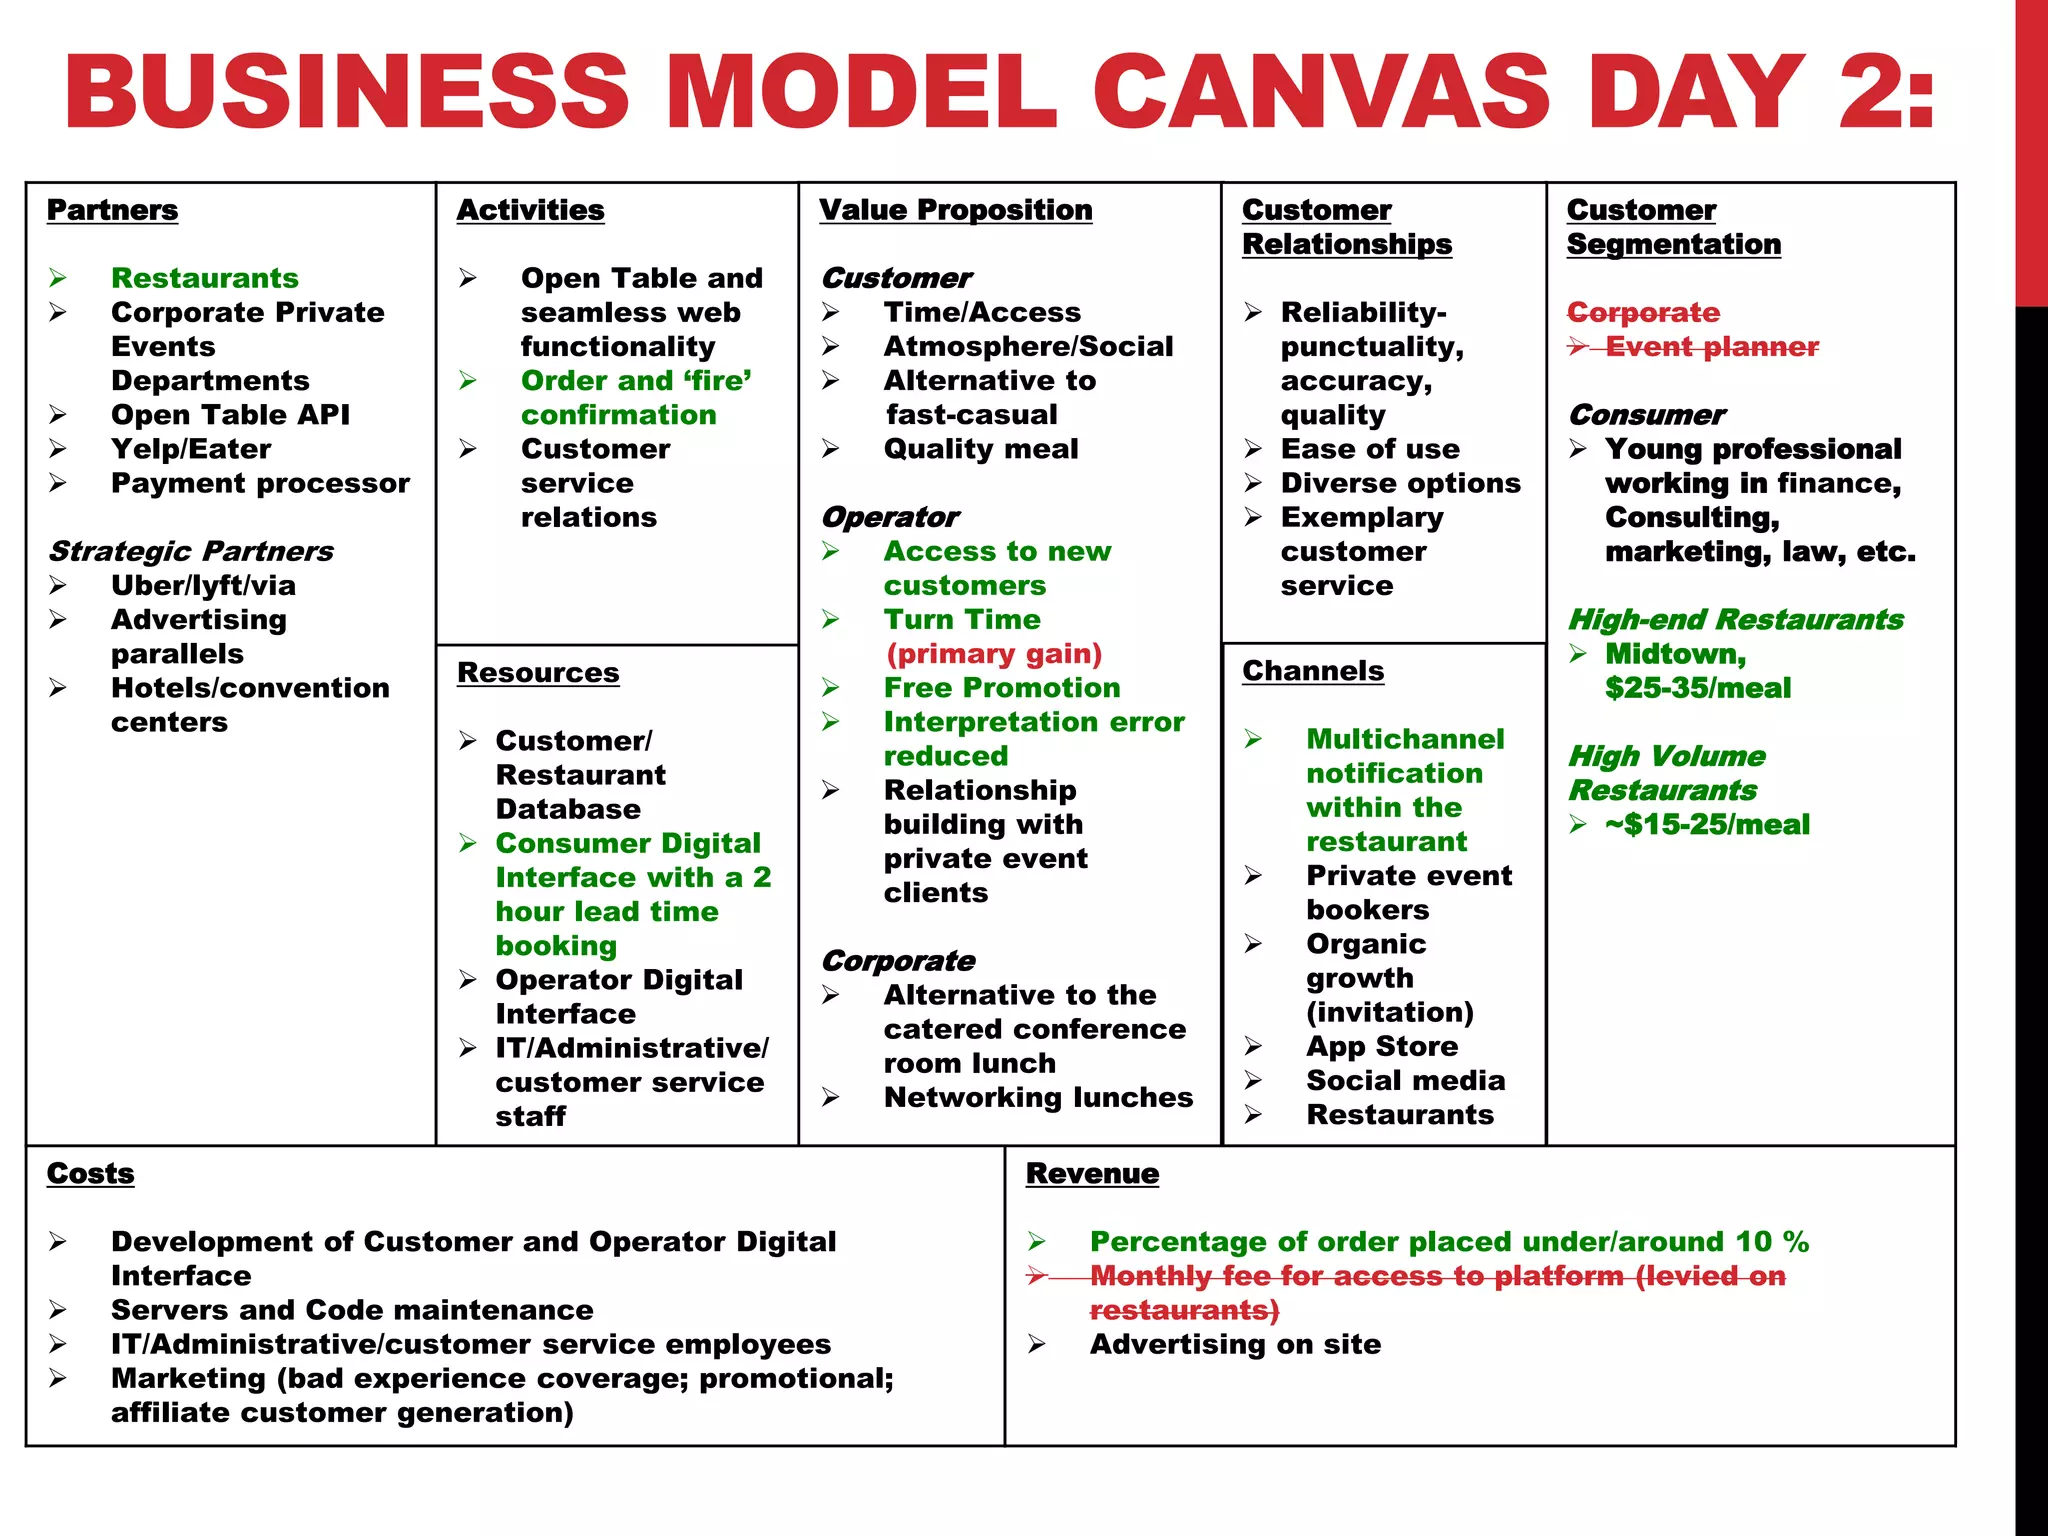
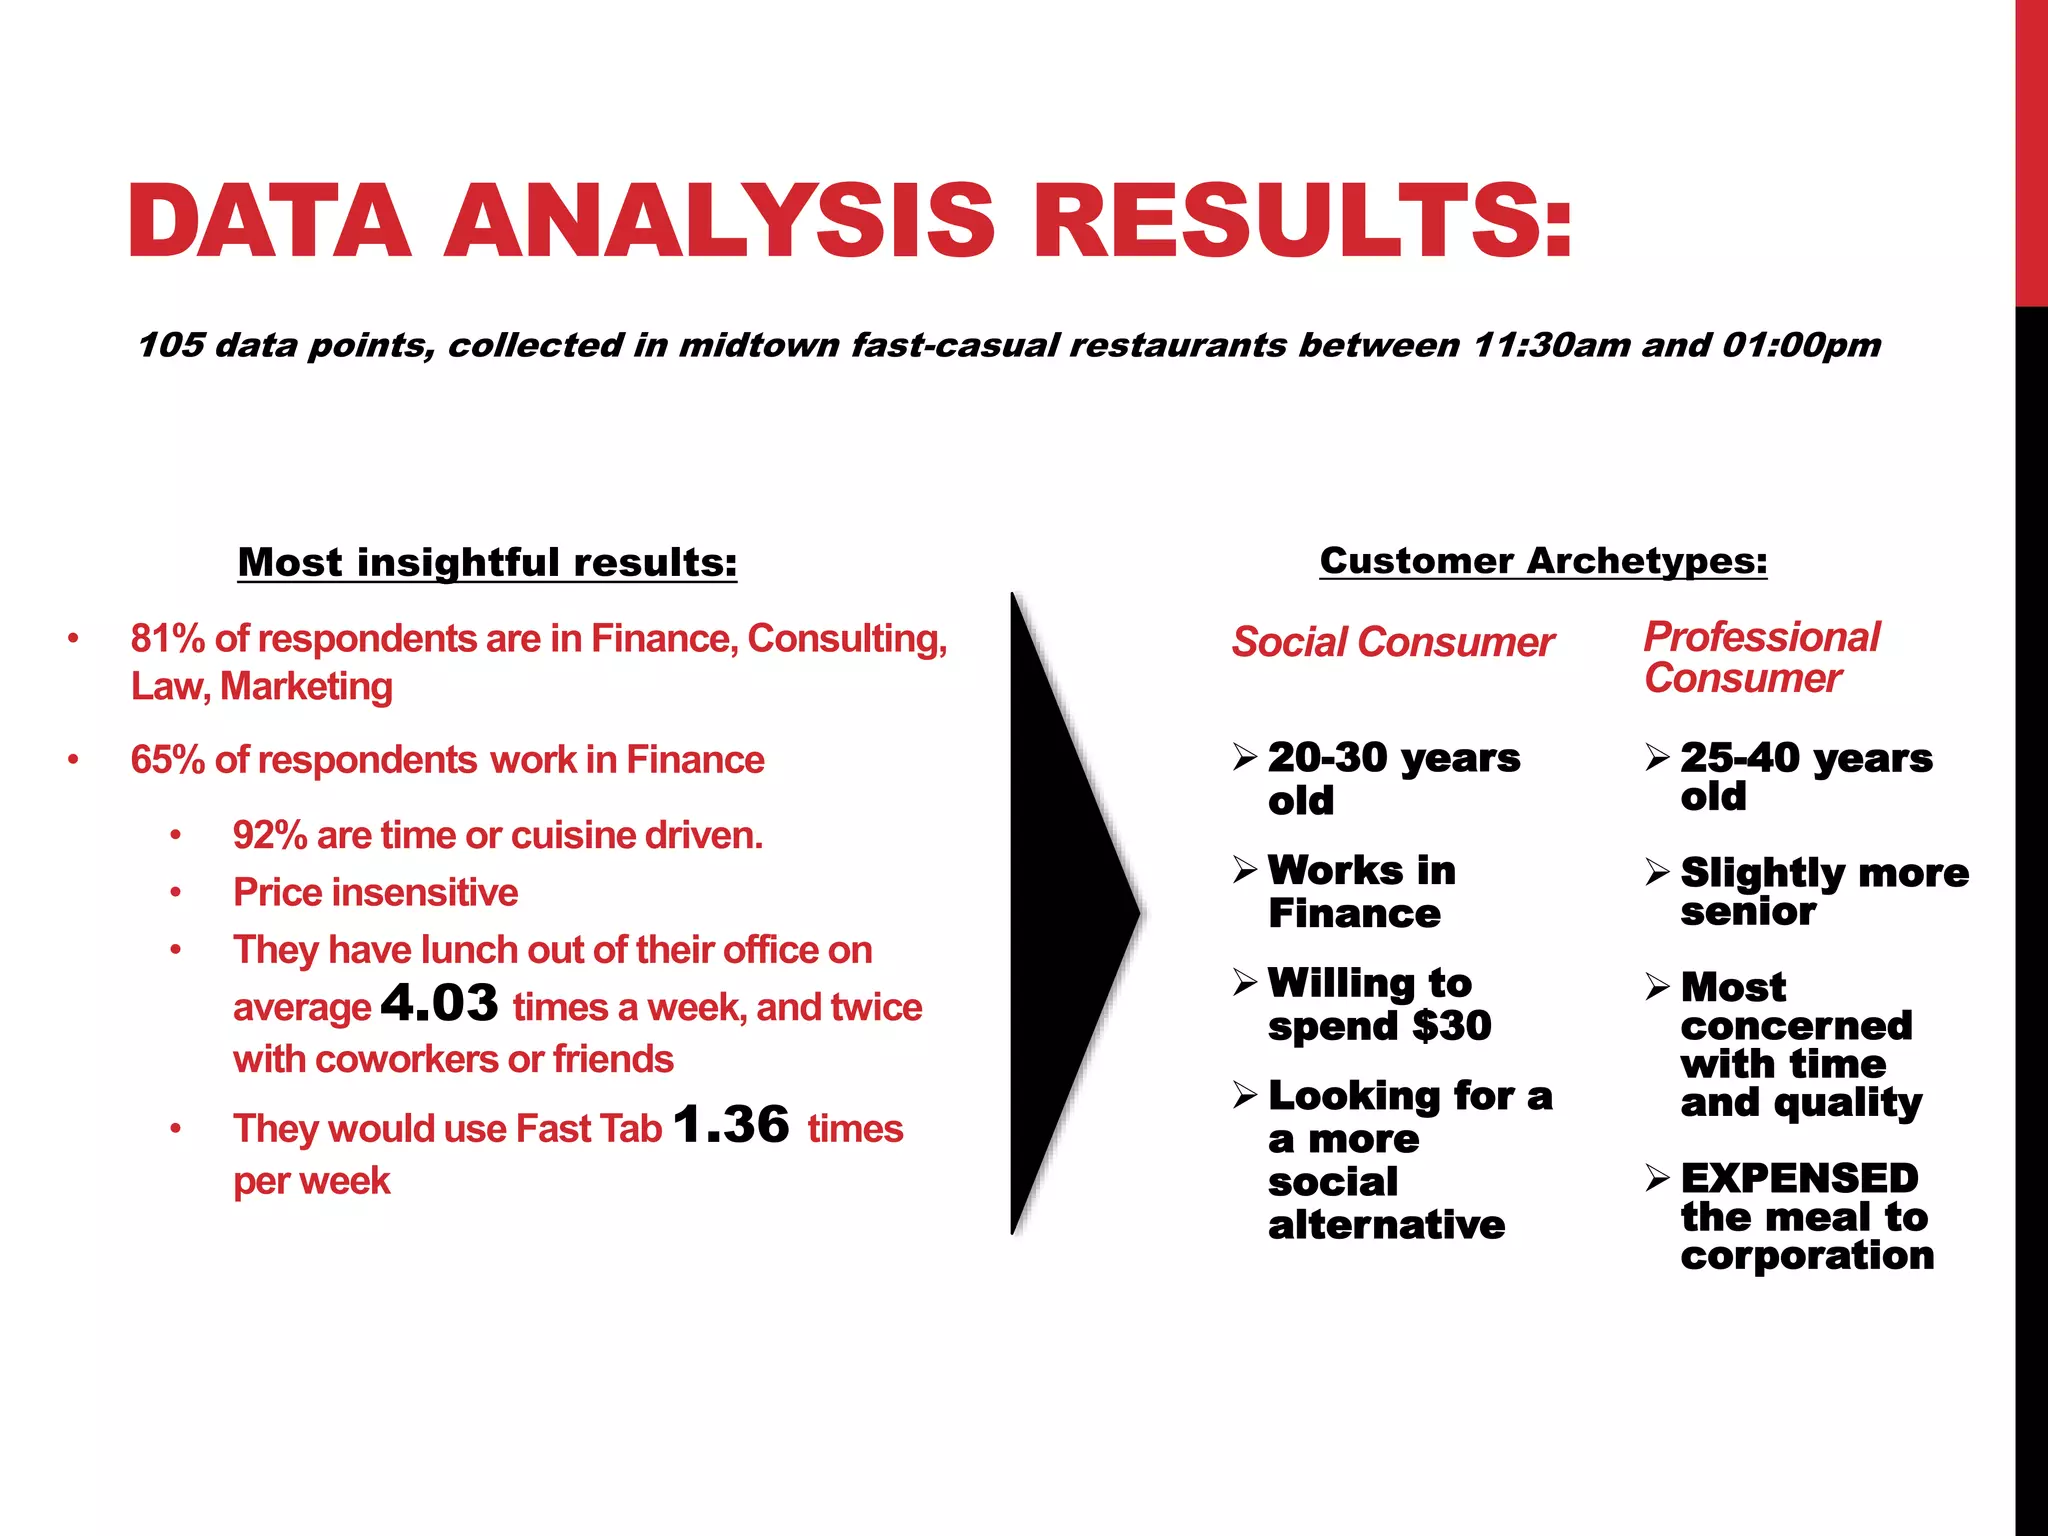
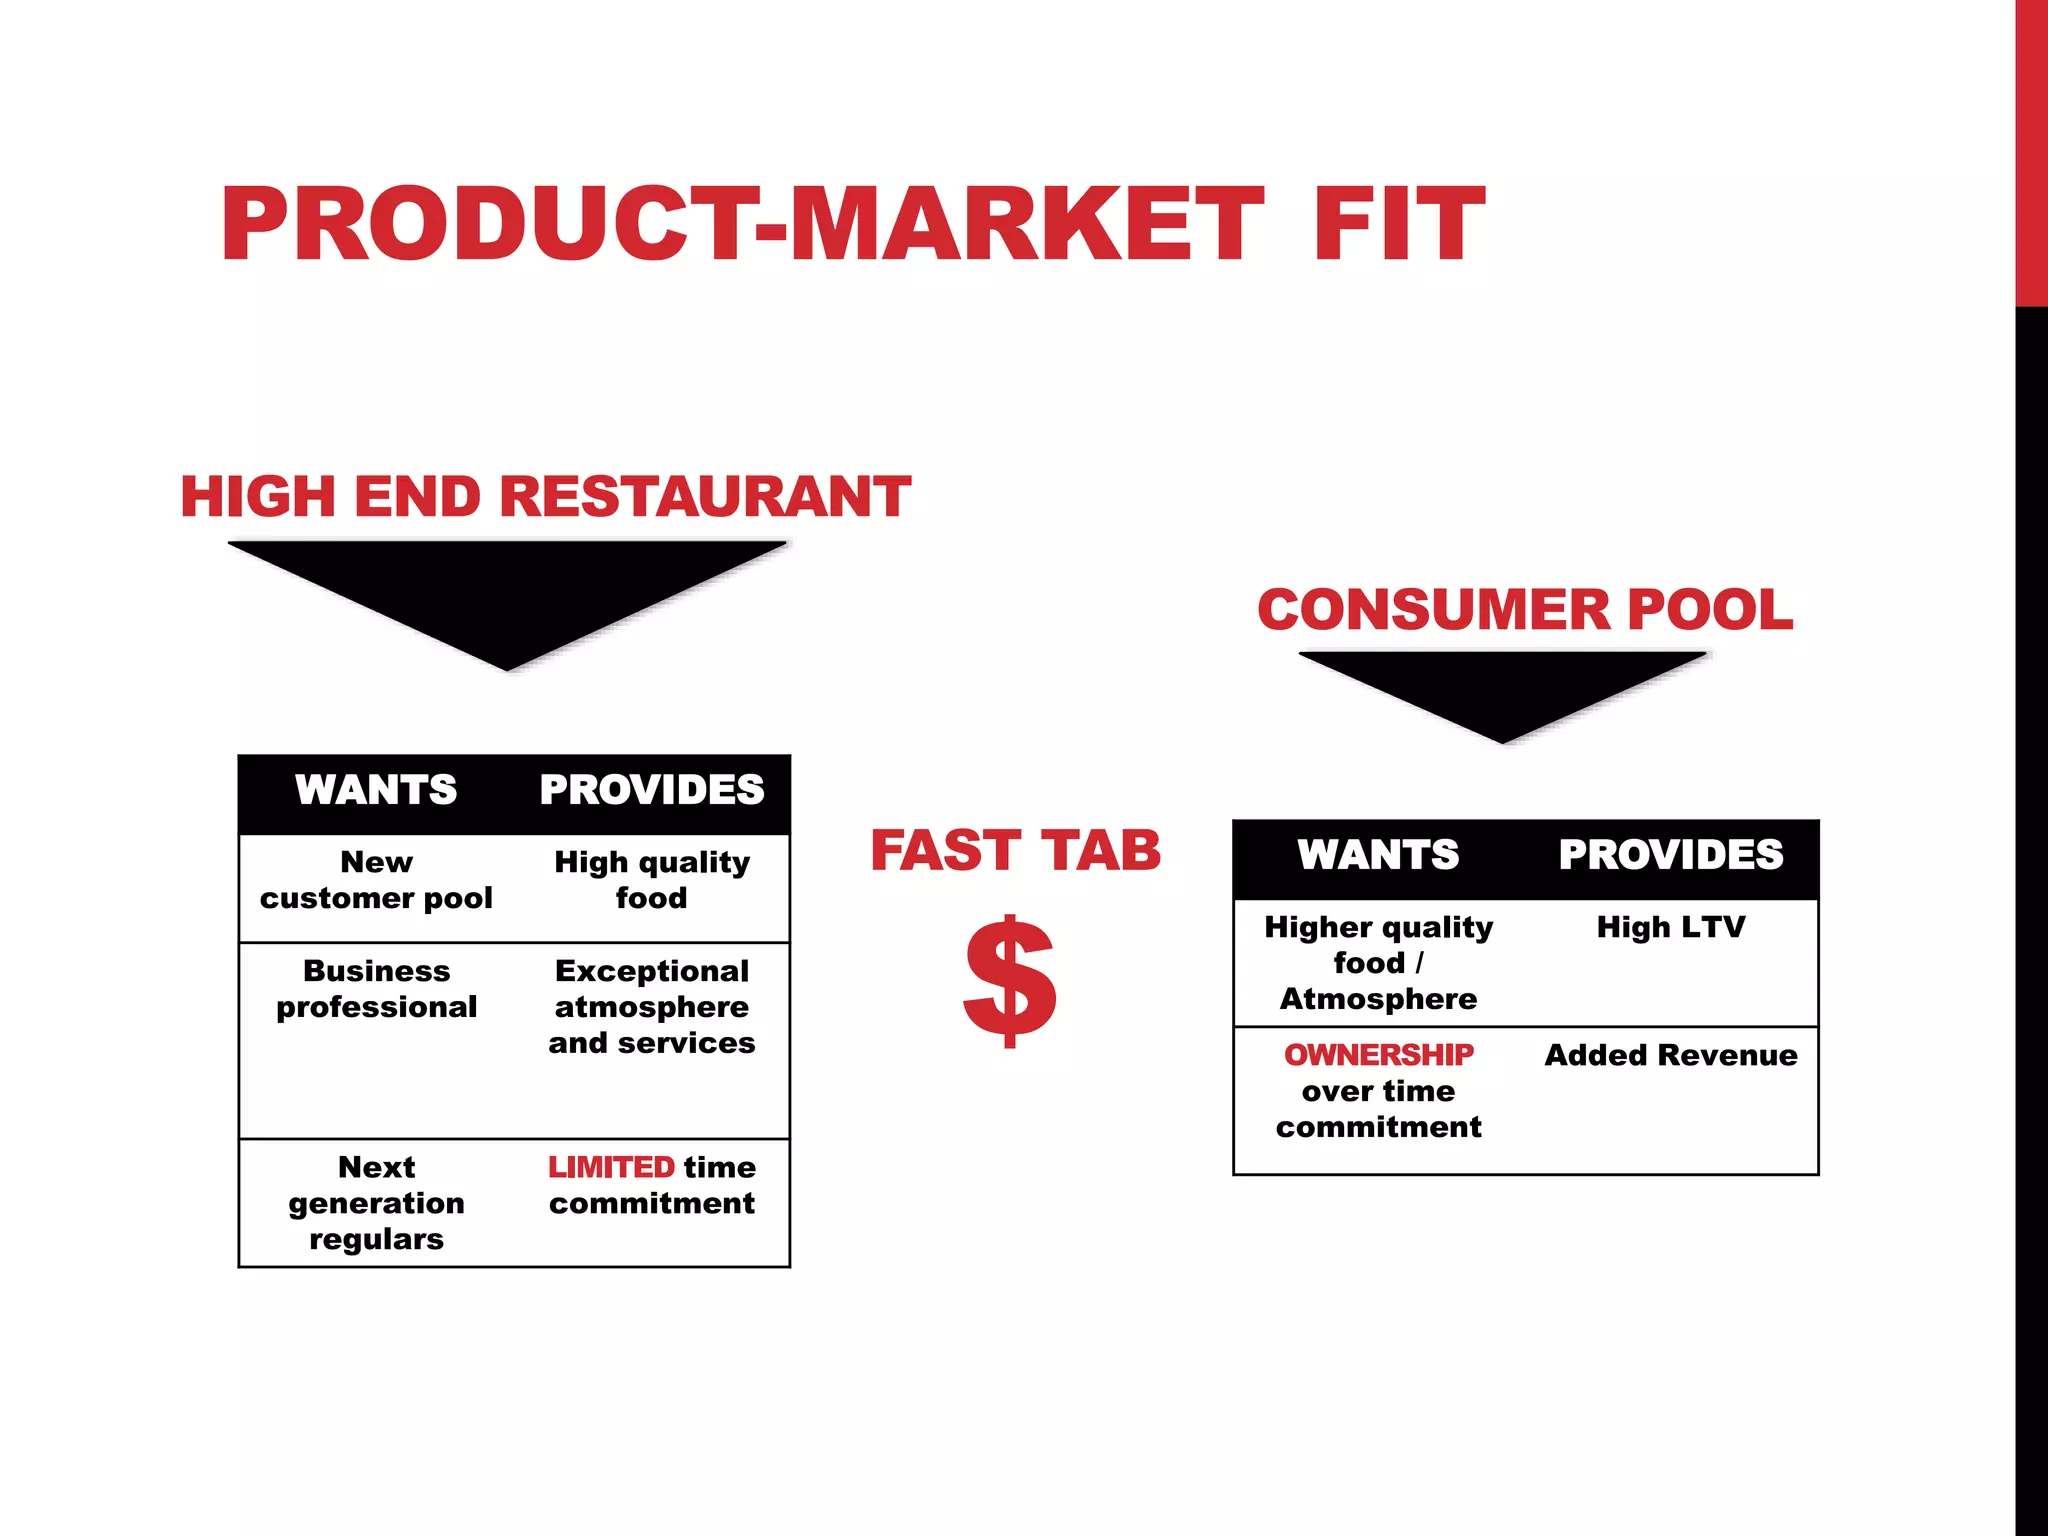
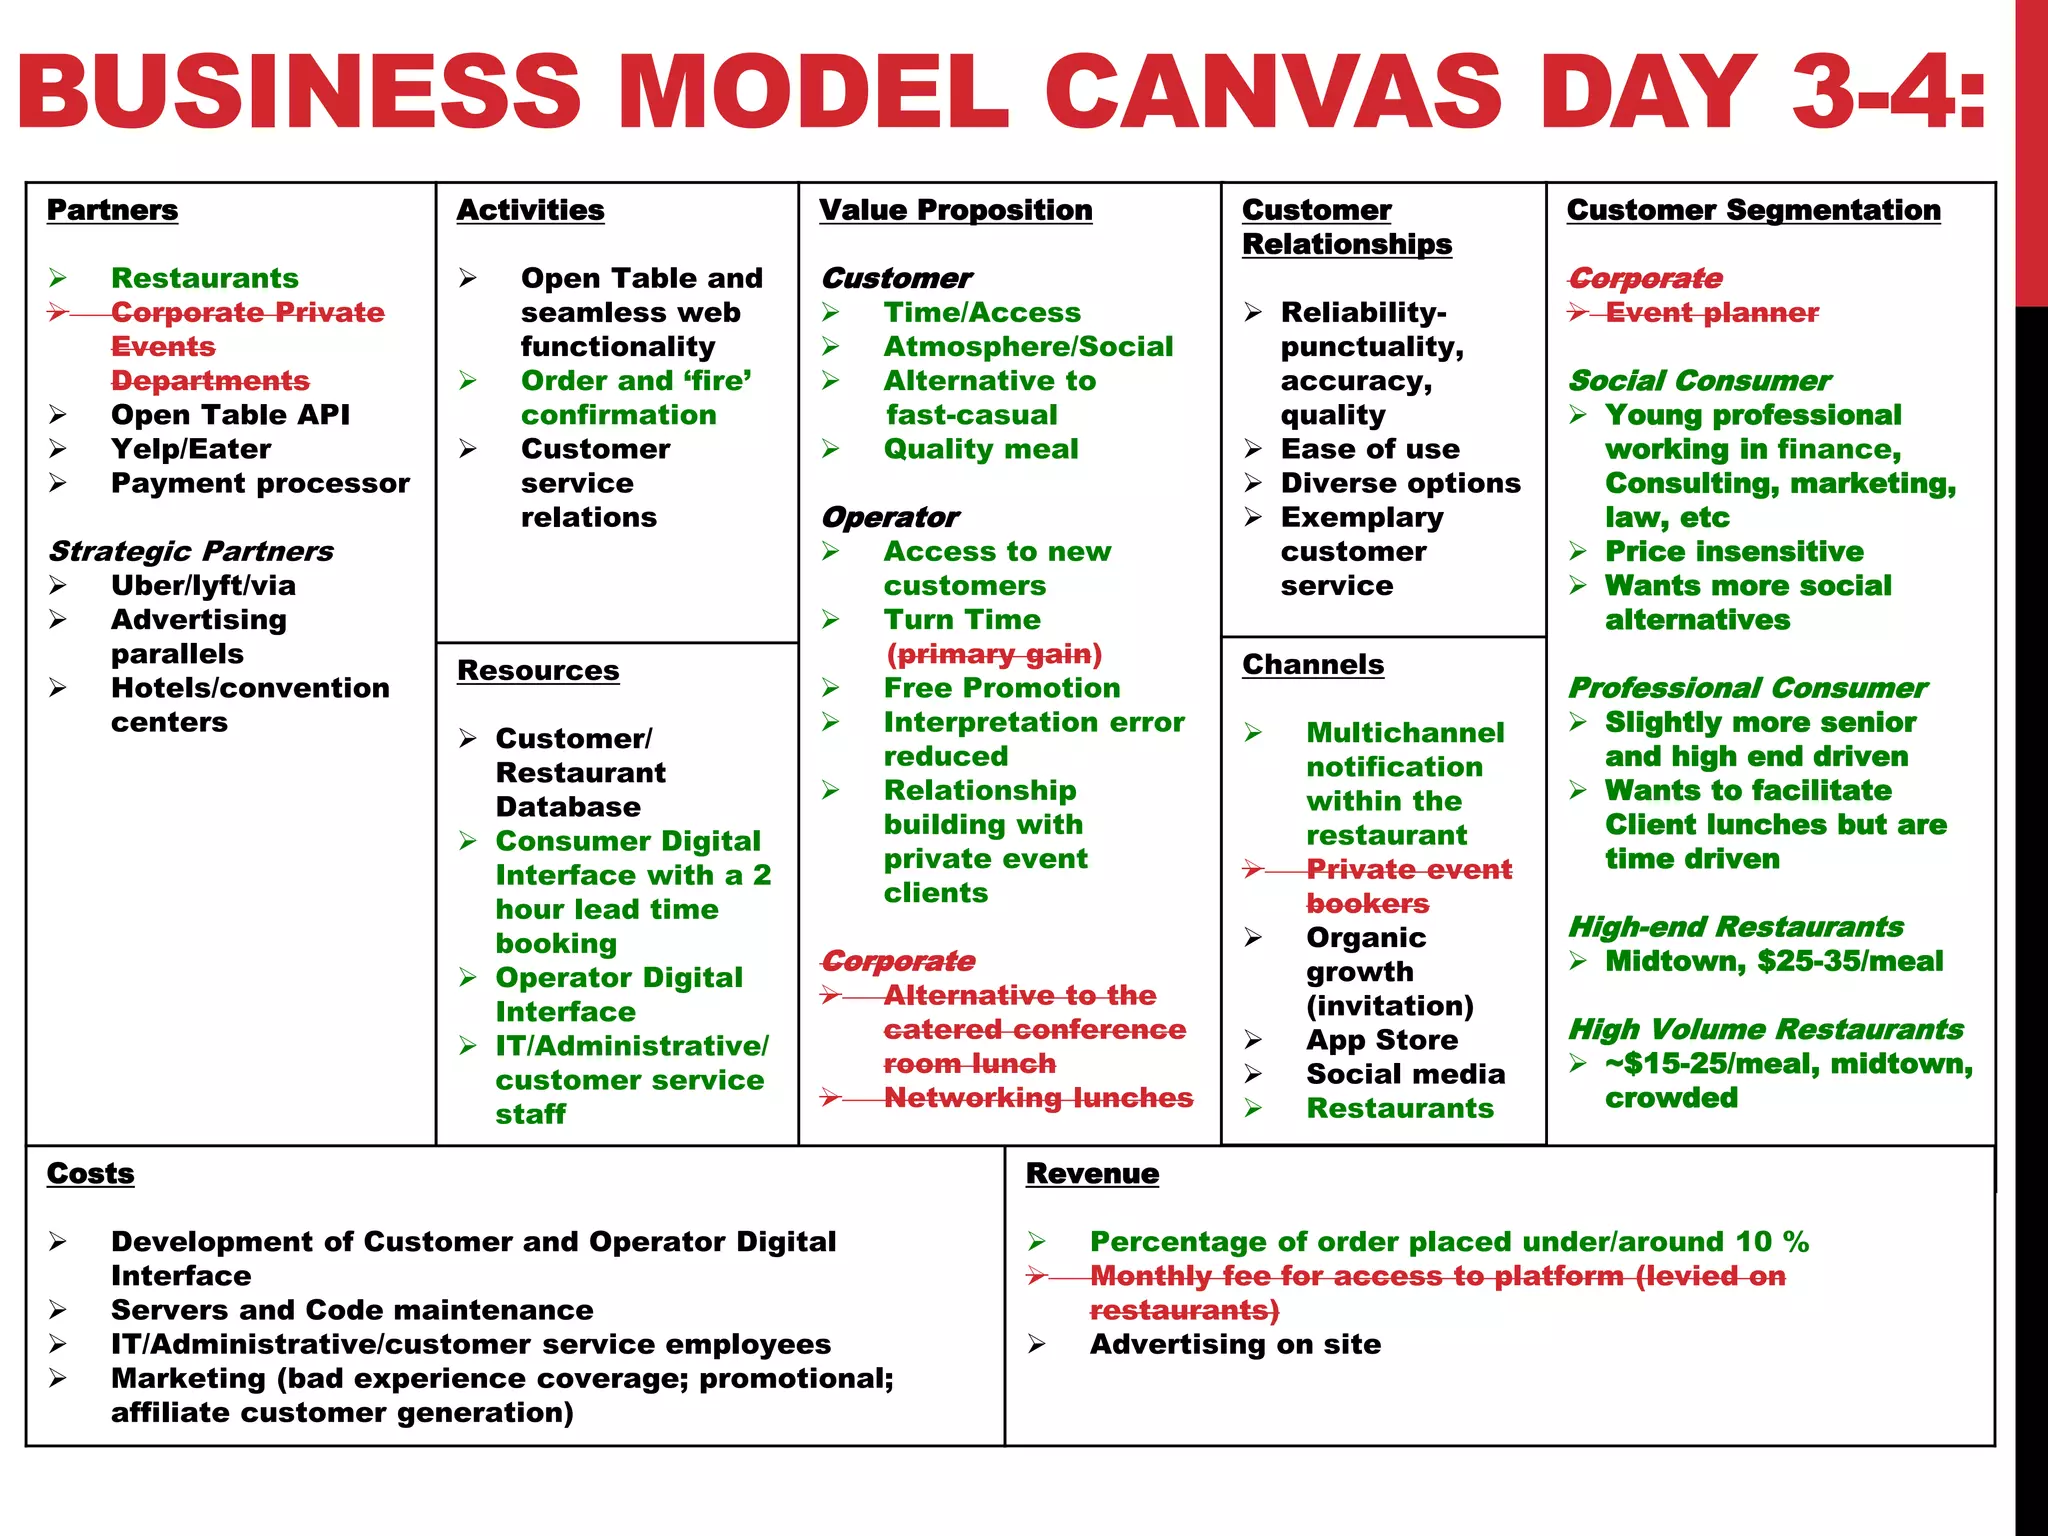
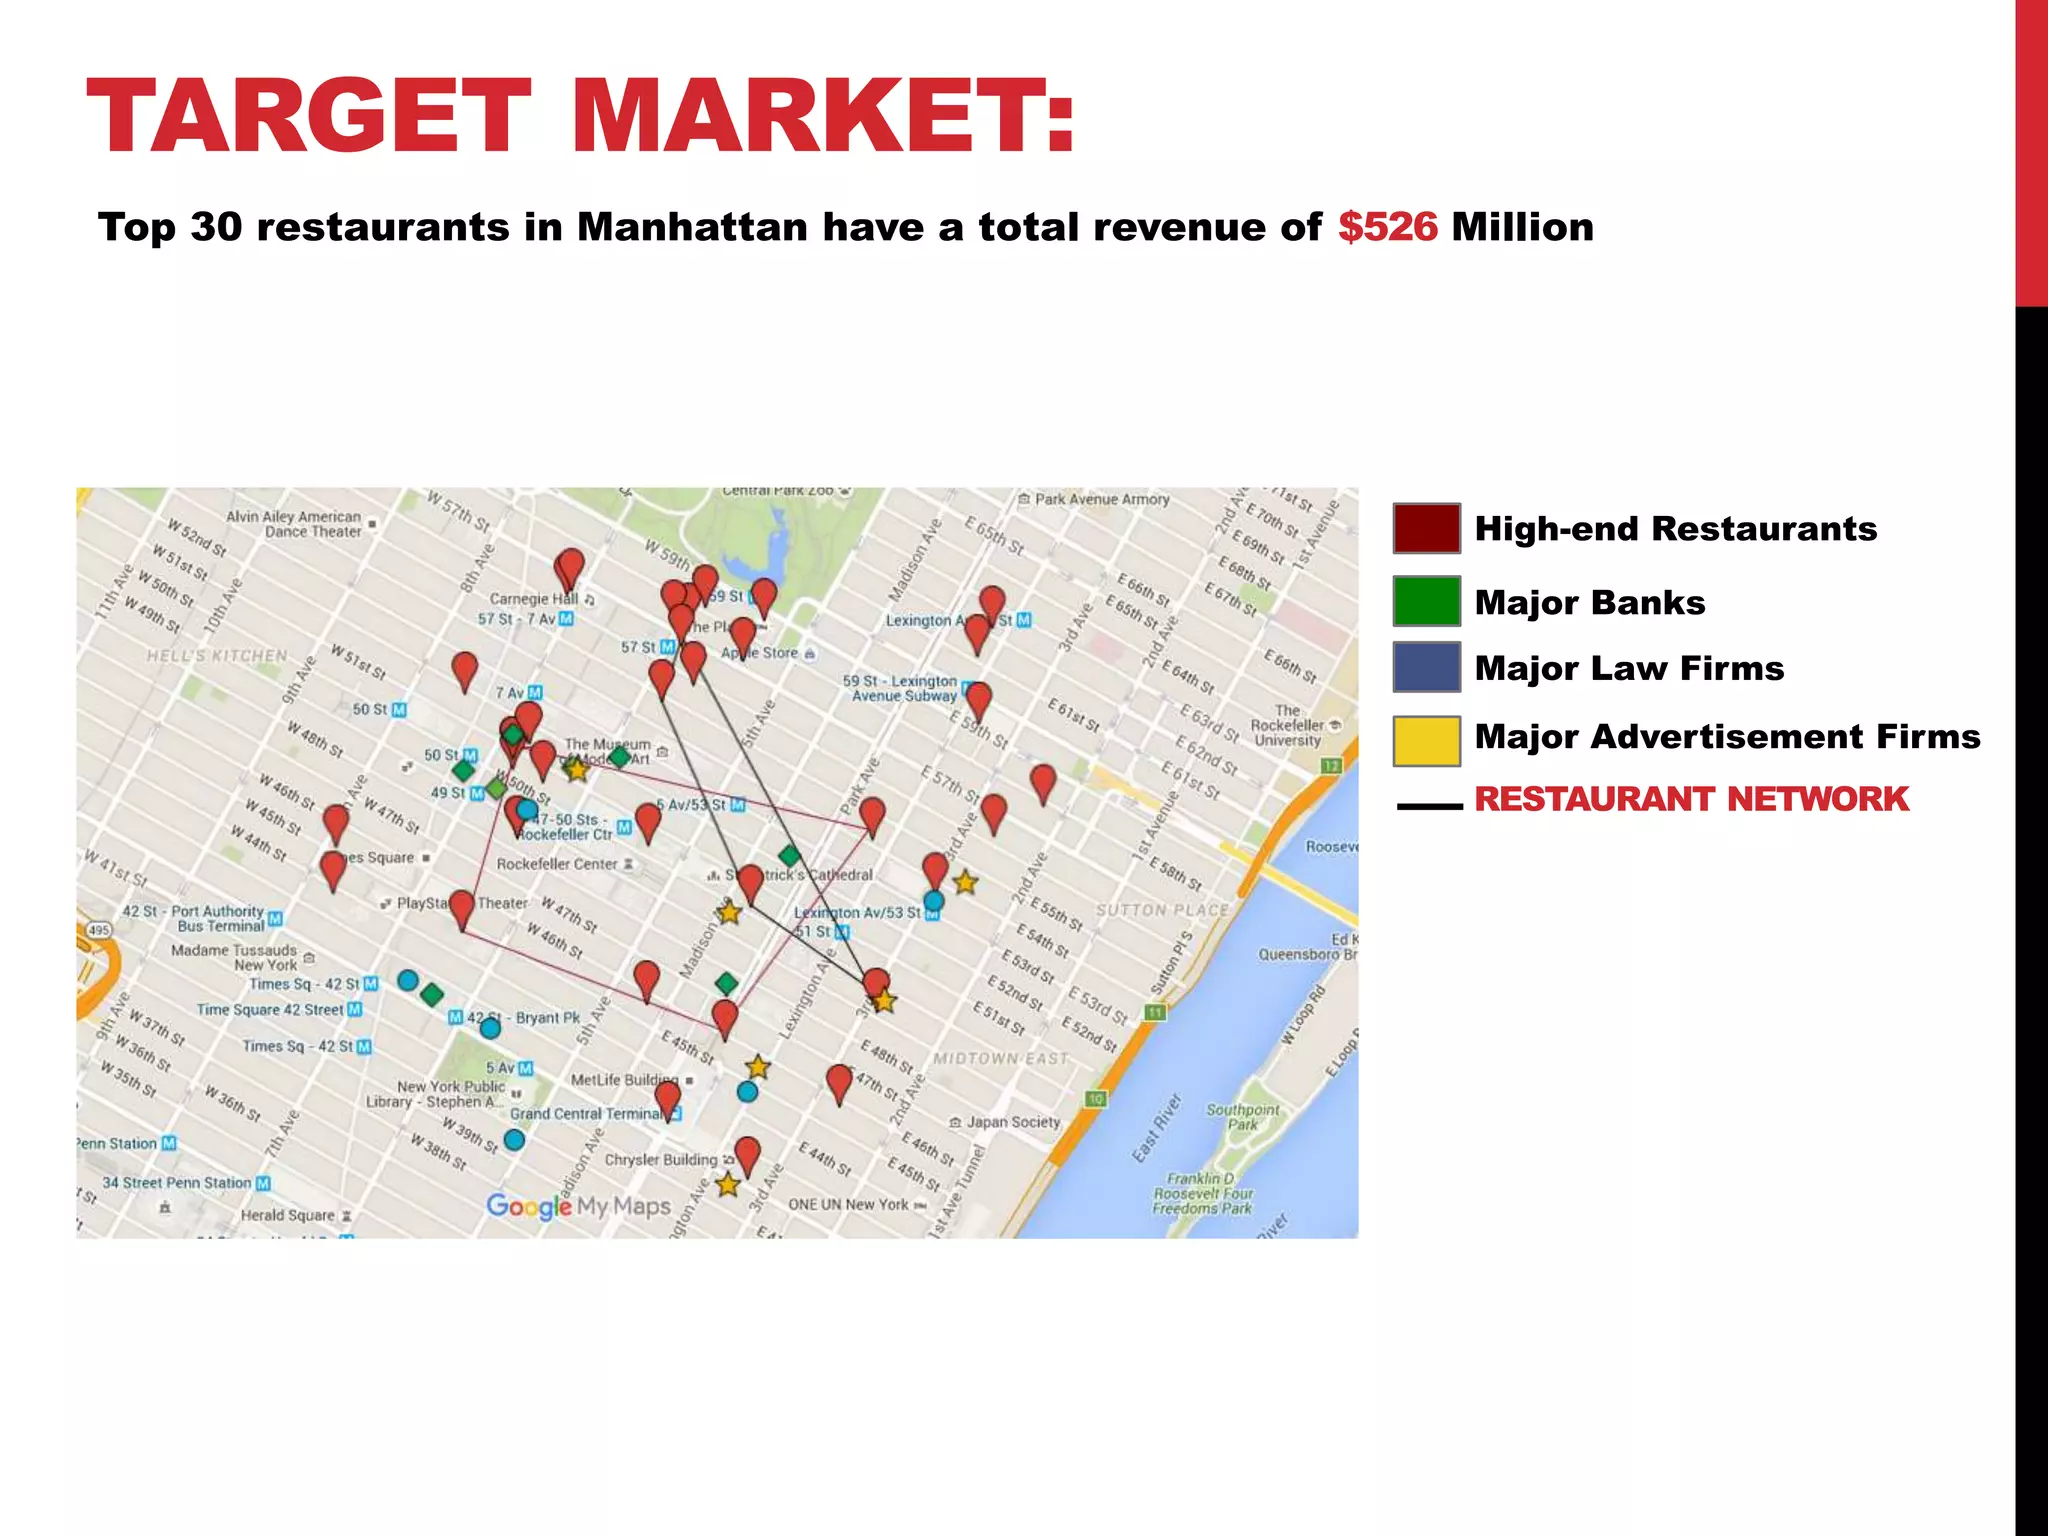
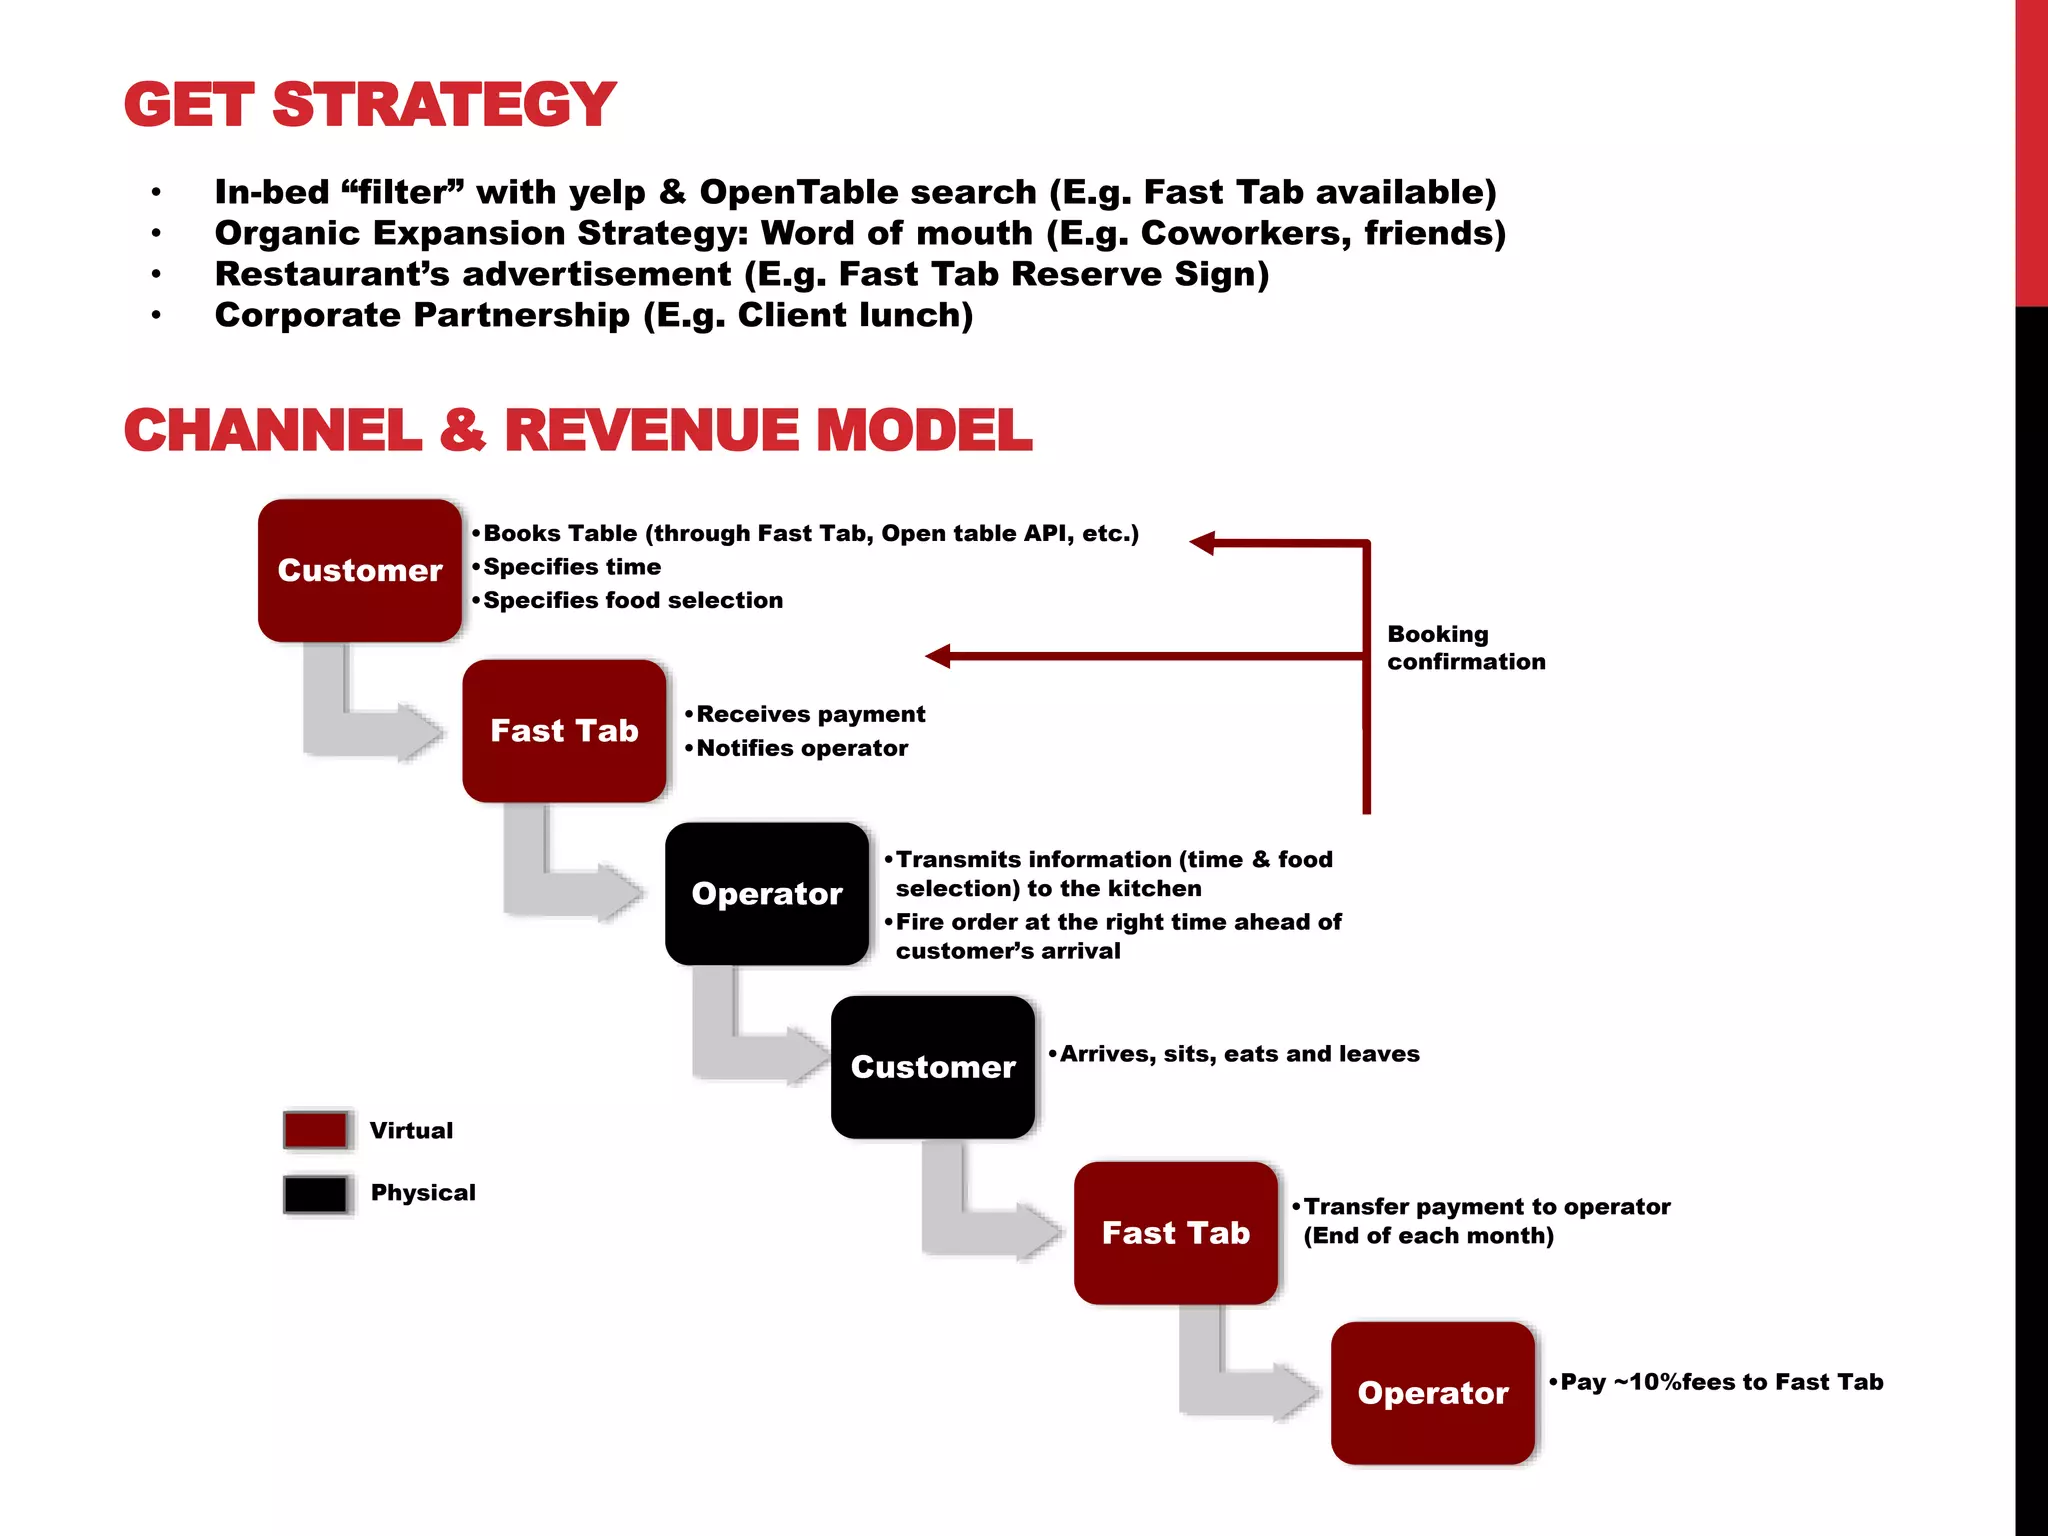
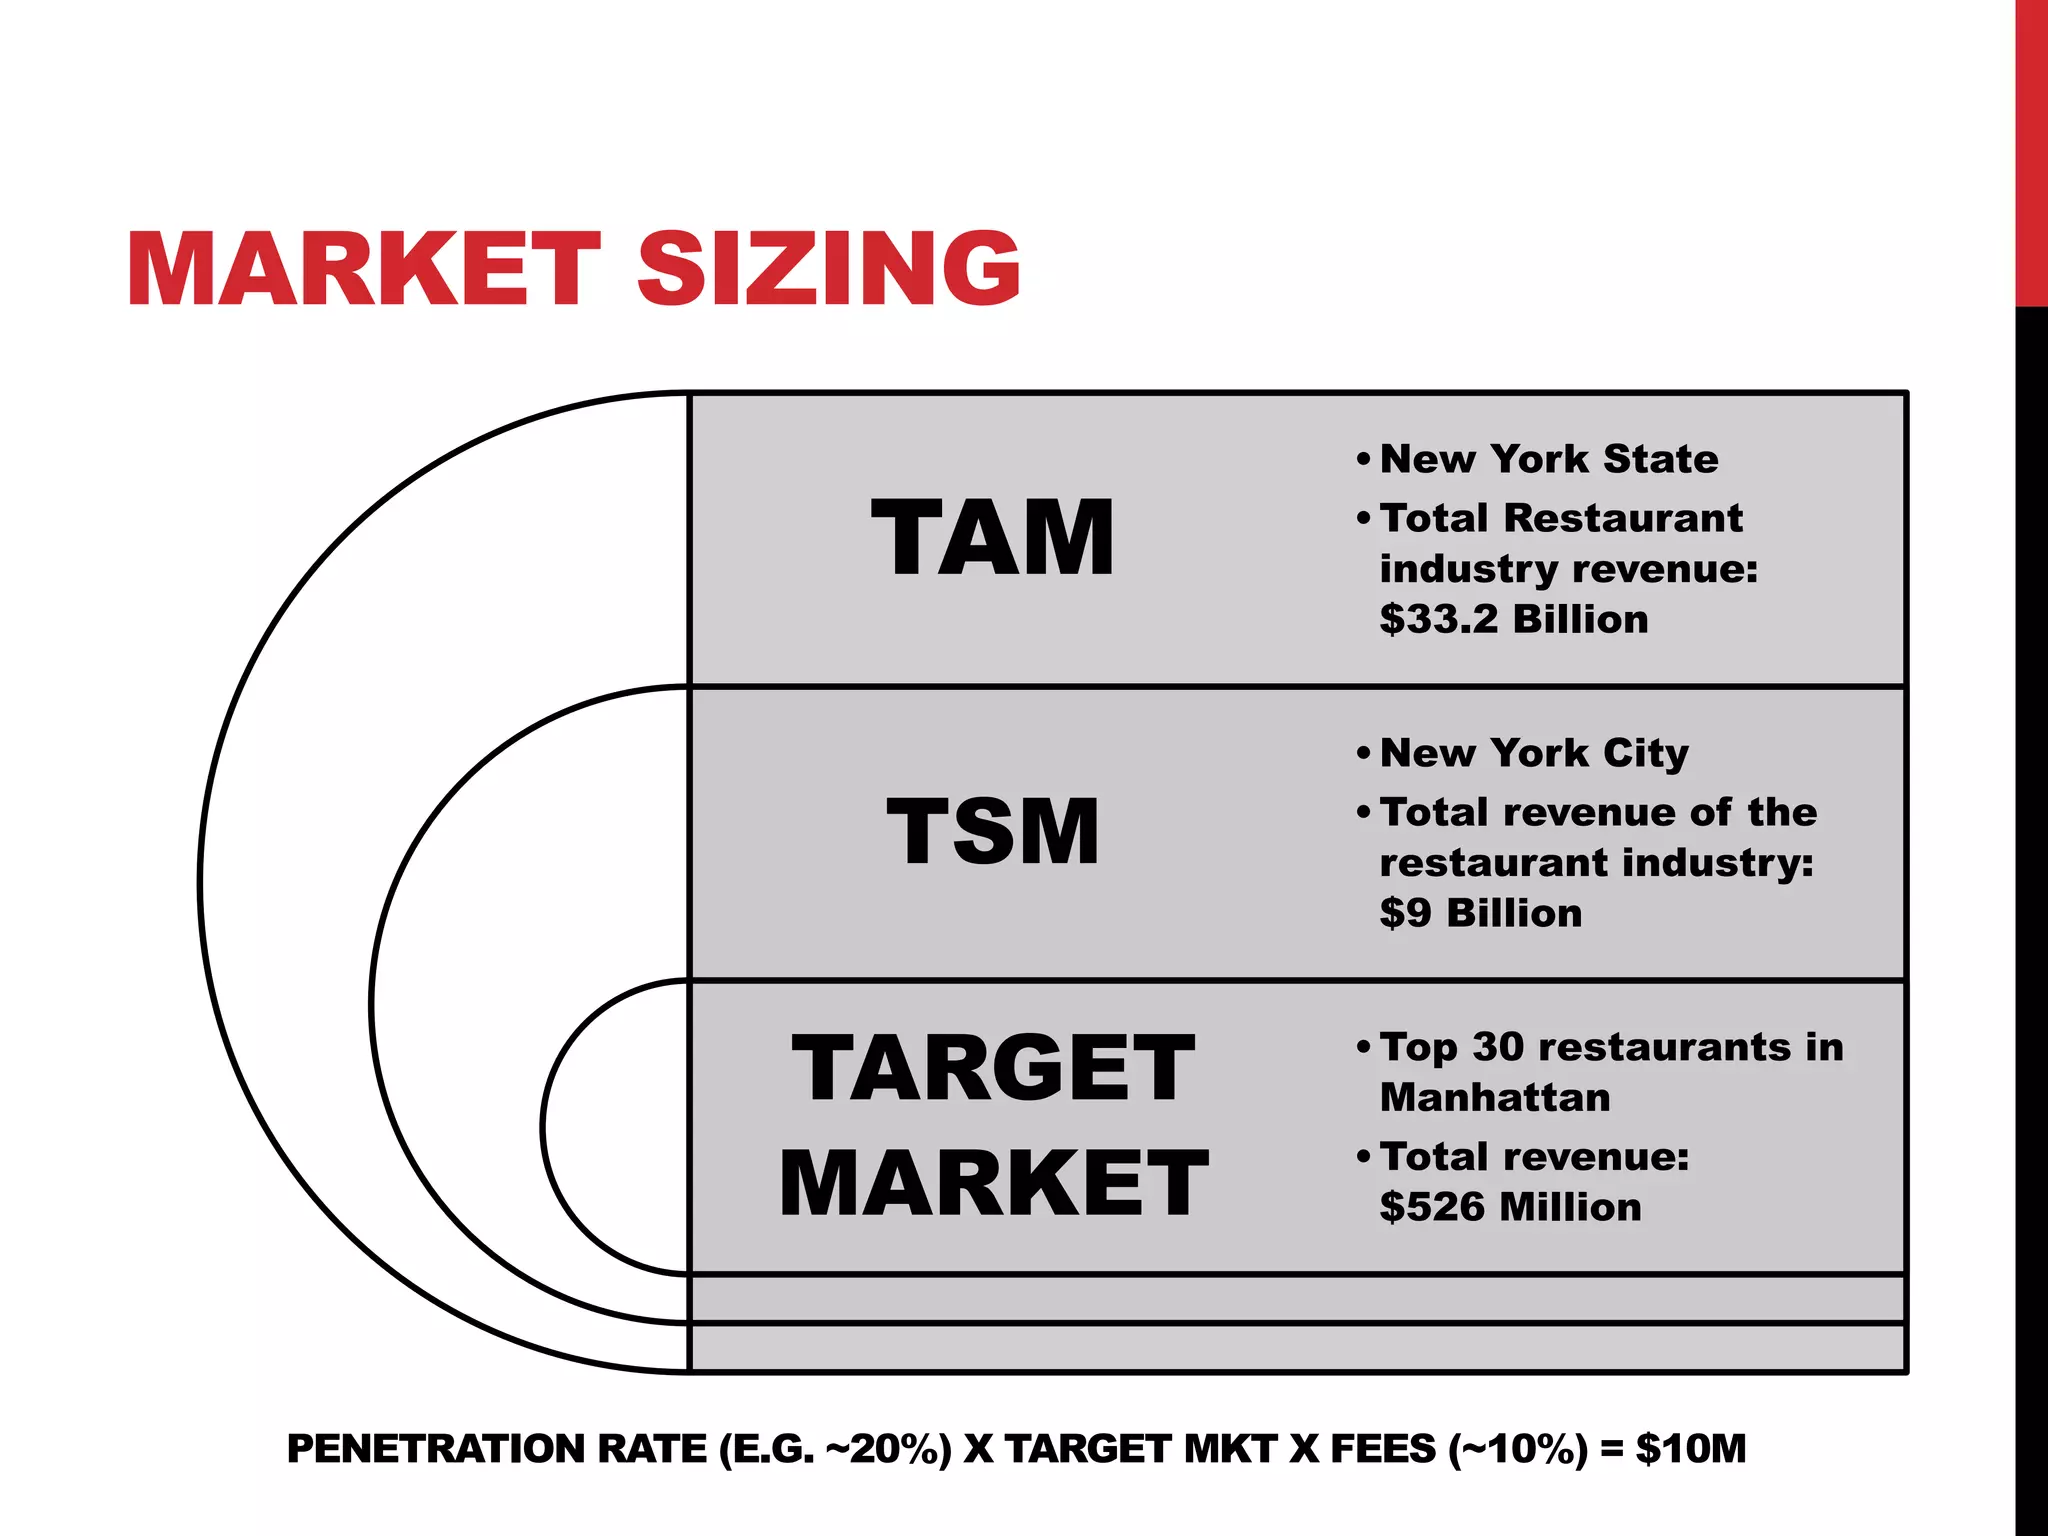
FAST TAB
GET IN, GET FED, GET OUT
TOTAL NUMBER OF INTERVIEWS: 123
INTERVIEWS OVER THE PAST 24 HOURS: 11
TOTAL NUMBER OF RESTAURANT MANAGER INTERVIEWS: 7
TOTAL NUMBER OF CONSUMER INTERVIEWS: 116
WHAT WE
THOUGHT…
Partners
 Restaurants
 Corporate Private
Events
Departments
 Open Table API
 Yelp/Eater
 Payment processor
Strategic Partners
 Uber/lyft/via
 Advertising
parallels
 Hotels/convention
centers
Value Proposition
Customer
 Time/Access
 Atmosphere/Social
 Quality meal
Operator
 Access to new
customers
 Turn time
(primary gain)
 Free promotion
 Relationship
building with
private event
clients
Corporate
 Alternative to the
catered conference
room lunch
 Networking lunches
Customer
Segmentation
Corporate
 Alternative to the
catered conference
room lunch
 Structured
networking lunches
Consumer
 Young professional
working in finance,
Consulting,
marketing, law, etc.
Restaurants
Activities
 Open Table and
seamless web
functionality
 Order and ‘fire’
confirmation
 Customer
service
relations
Resources
 Customer/
Restaurant
Database
 Consumer Digital
Interface with a 2
hour lead time
booking
 Operator Digital
Interface
 IT/Administrative/
customer service
staff
Customer
Relationships
 Reliability-
punctuality,
accuracy,
quality
 Ease of use
 Diverse options
 Exemplary
customer
service
Channels
 Private event
bookers
 Organic
growth
 App Store
 Social media
 Restaurants
Costs
 Development of Customer and Operator Digital
Interface
 Servers and Code maintenance
 IT/Administrative/customer service employees
 Marketing (bad experience coverage; promotional;
affiliate customer generation)
Revenue
 Percentage of order placed- under/around 15 %
 Monthly fee for access to platform (levied on
restaurants)
 Advertising on site
BUSINESS MODEL CANVAS DAY 1:
WHAT WE
FOUND OUT!
THE DISCOVERY: RESTAURANTS
1. Two distinct segments:
• High-volume
• High-end
2. Access to new customer pool > reduced
turn time
3. Implementing the logistics not an issue 
4. 10% commission revenue model 
Partners
 Restaurants
 Corporate Private
Events
Departments
 Open Table API
 Yelp/Eater
 Payment processor
Strategic Partners
 Uber/lyft/via
 Advertising
parallels
 Hotels/convention
centers
Value Proposition
Customer
 Time/Access
 Atmosphere/Social
 Alternative to
fast-casual
 Quality meal
Operator
 Access to new
customers
 Turn Time
(primary gain)
 Free Promotion
 Interpretation error
reduced
 Relationship
building with
private event
clients
Corporate
 Alternative to the
catered conference
room lunch
 Networking lunches
Customer
Segmentation
Corporate
 Event planner
Consumer
 Young professional
working in finance,
Consulting,
marketing, law, etc.
High-end Restaurants
 Midtown,
$25-35/meal
High Volume
Restaurants
 ~$15-25/meal
Activities
 Open Table and
seamless web
functionality
 Order and ‘fire’
confirmation
 Customer
service
relations
Resources
 Customer/
Restaurant
Database
 Consumer Digital
Interface with a 2
hour lead time
booking
 Operator Digital
Interface
 IT/Administrative/
customer service
staff
Customer
Relationships
 Reliability-
punctuality,
accuracy,
quality
 Ease of use
 Diverse options
 Exemplary
customer
service
Channels
 Multichannel
notification
within the
restaurant
 Private event
bookers
 Organic
growth
(invitation)
 App Store
 Social media
 Restaurants
Costs
 Development of Customer and Operator Digital
Interface
 Servers and Code maintenance
 IT/Administrative/customer service employees
 Marketing (bad experience coverage; promotional;
affiliate customer generation)
Revenue
 Percentage of order placed under/around 10 %
 Monthly fee for access to platform (levied on
restaurants)
 Advertising on site
BUSINESS MODEL CANVAS DAY 2:
DATA ANALYSIS RESULTS:
Most insightful results:
• 81% of respondents are in Finance, Consulting,
Law, Marketing
• 65% of respondents work in Finance
• 92% are time or cuisine driven.
• Price insensitive
• They have lunch out of their office on
average 4.03 times a week, and twice
with coworkers or friends
• They would use Fast Tab 1.36 times
per week
105 data points, collected in midtown fast-casual restaurants between 11:30am and 01:00pm
Social Consumer
 20-30 years
old
 Works in
Finance
 Willing to
spend $30
 Looking for a
a more
social
alternative
Professional
Consumer
 25-40 years
old
 Slightly more
senior
 Most
concerned
with time
and quality
 EXPENSED
the meal to
corporation
Customer Archetypes:
HIGH END RESTAURANT
WANTS PROVIDES
New
customer pool
High quality
food
Business
professional
Exceptional
atmosphere
and services
Next
generation
regulars
LIMITED time
commitment
WANTS PROVIDES
Higher quality
food /
Atmosphere
High LTV
OWNERSHIP
over time
commitment
Added Revenue
$
FAST TAB
PRODUCT-MARKET FIT
CONSUMER POOL
Partners
 Restaurants
 Corporate Private
Events
Departments
 Open Table API
 Yelp/Eater
 Payment processor
Strategic Partners
 Uber/lyft/via
 Advertising
parallels
 Hotels/convention
centers
Value Proposition
Customer
 Time/Access
 Atmosphere/Social
 Alternative to
fast-casual
 Quality meal
Operator
 Access to new
customers
 Turn Time
(primary gain)
 Free Promotion
 Interpretation error
reduced
 Relationship
building with
private event
clients
Corporate
 Alternative to the
catered conference
room lunch
 Networking lunches
Customer Segmentation
Corporate
 Event planner
Social Consumer
 Young professional
working in finance,
Consulting, marketing,
law, etc
 Price insensitive
 Wants more social
alternatives .
Professional Consumer
 Slightly more senior
and high end driven
 Wants to facilitate
Client lunches but are
time driven
High-end Restaurants
 Midtown, $25-35/meal
High Volume Restaurants
 ~$15-25/meal, midtown,
crowded
Activities
 Open Table and
seamless web
functionality
 Order and ‘fire’
confirmation
 Customer
service
relations
Resources
 Customer/
Restaurant
Database
 Consumer Digital
Interface with a 2
hour lead time
booking
 Operator Digital
Interface
 IT/Administrative/
customer service
staff
Customer
Relationships
 Reliability-
punctuality,
accuracy,
quality
 Ease of use
 Diverse options
 Exemplary
customer
service
Channels
 Multichannel
notification
within the
restaurant
 Private event
bookers
 Organic
growth
(invitation)
 App Store
 Social media
 Restaurants
Costs
 Development of Customer and Operator Digital
Interface
 Servers and Code maintenance
 IT/Administrative/customer service employees
 Marketing (bad experience coverage; promotional;
affiliate customer generation)
Revenue
 Percentage of order placed under/around 10 %
 Monthly fee for access to platform (levied on
restaurants)
 Advertising on site
BUSINESS MODEL CANVAS DAY 3-4:
WHAT’S
NEXT?
TARGET MARKET:
High-end Restaurants
Major Banks
Major Law Firms
Major Advertisement Firms
RESTAURANT NETWORK
Top 30 restaurants in Manhattan have a total revenue of $526 Million
ALPHA TESTING:
MVP
AND THEN…
APPENDIX
CHANNEL, GET STRATEGY, REVENUE MODEL,
PETAL DIAGRAM, MARKET SIZING, ETC.
CHANNEL & REVENUE MODEL
Customer
•Books Table (through Fast Tab, Open table API, etc.)
•Specifies time
•Specifies food selection
Fast Tab
•Receives payment
•Notifies operator
Operator
•Transmits information (time & food
selection) to the kitchen
•Fire order at the right time ahead of
customer’s arrival
Customer
•Arrives, sits, eats and leaves
Fast Tab
•Transfer payment to operator
(End of each month)
Operator •Pay ~10%fees to Fast Tab
Booking
confirmation
Virtual
Physical
GET STRATEGY
• In-bed “filter” with yelp & OpenTable search (E.g. Fast Tab available)
• Organic Expansion Strategy: Word of mouth (E.g. Coworkers, friends)
• Restaurant’s advertisement (E.g. Fast Tab Reserve Sign)
• Corporate Partnership (E.g. Client lunch)
PETAL DIAGRAM:
FOOD DELIVERY
CATERING SERVICES
PAYMENT GATEWAY
RESERVATION SERVICES
FOOD REVIEWING
POINT OF SALE
FAST TAB
MARKET SIZING
TAM
TSM
TARGET
MARKET
•New York State
•Total Restaurant
industry revenue:
$33.2 Billion
•New York City
•Total revenue of the
restaurant industry:
$9 Billion
•Top 30 restaurants in
Manhattan
•Total revenue:
$526 Million
PENETRATION RATE (E.G. ~20%) X TARGET MKT X FEES (~10%) = $10M

Fast Tab Columbia

  • 1.
    FAST TAB GET IN,GET FED, GET OUT TOTAL NUMBER OF INTERVIEWS: 123 INTERVIEWS OVER THE PAST 24 HOURS: 11 TOTAL NUMBER OF RESTAURANT MANAGER INTERVIEWS: 7 TOTAL NUMBER OF CONSUMER INTERVIEWS: 116
  • 2.
  • 3.
    Partners  Restaurants  CorporatePrivate Events Departments  Open Table API  Yelp/Eater  Payment processor Strategic Partners  Uber/lyft/via  Advertising parallels  Hotels/convention centers Value Proposition Customer  Time/Access  Atmosphere/Social  Quality meal Operator  Access to new customers  Turn time (primary gain)  Free promotion  Relationship building with private event clients Corporate  Alternative to the catered conference room lunch  Networking lunches Customer Segmentation Corporate  Alternative to the catered conference room lunch  Structured networking lunches Consumer  Young professional working in finance, Consulting, marketing, law, etc. Restaurants Activities  Open Table and seamless web functionality  Order and ‘fire’ confirmation  Customer service relations Resources  Customer/ Restaurant Database  Consumer Digital Interface with a 2 hour lead time booking  Operator Digital Interface  IT/Administrative/ customer service staff Customer Relationships  Reliability- punctuality, accuracy, quality  Ease of use  Diverse options  Exemplary customer service Channels  Private event bookers  Organic growth  App Store  Social media  Restaurants Costs  Development of Customer and Operator Digital Interface  Servers and Code maintenance  IT/Administrative/customer service employees  Marketing (bad experience coverage; promotional; affiliate customer generation) Revenue  Percentage of order placed- under/around 15 %  Monthly fee for access to platform (levied on restaurants)  Advertising on site BUSINESS MODEL CANVAS DAY 1:
  • 4.
  • 5.
    THE DISCOVERY: RESTAURANTS 1.Two distinct segments: • High-volume • High-end 2. Access to new customer pool > reduced turn time 3. Implementing the logistics not an issue  4. 10% commission revenue model 
  • 6.
    Partners  Restaurants  CorporatePrivate Events Departments  Open Table API  Yelp/Eater  Payment processor Strategic Partners  Uber/lyft/via  Advertising parallels  Hotels/convention centers Value Proposition Customer  Time/Access  Atmosphere/Social  Alternative to fast-casual  Quality meal Operator  Access to new customers  Turn Time (primary gain)  Free Promotion  Interpretation error reduced  Relationship building with private event clients Corporate  Alternative to the catered conference room lunch  Networking lunches Customer Segmentation Corporate  Event planner Consumer  Young professional working in finance, Consulting, marketing, law, etc. High-end Restaurants  Midtown, $25-35/meal High Volume Restaurants  ~$15-25/meal Activities  Open Table and seamless web functionality  Order and ‘fire’ confirmation  Customer service relations Resources  Customer/ Restaurant Database  Consumer Digital Interface with a 2 hour lead time booking  Operator Digital Interface  IT/Administrative/ customer service staff Customer Relationships  Reliability- punctuality, accuracy, quality  Ease of use  Diverse options  Exemplary customer service Channels  Multichannel notification within the restaurant  Private event bookers  Organic growth (invitation)  App Store  Social media  Restaurants Costs  Development of Customer and Operator Digital Interface  Servers and Code maintenance  IT/Administrative/customer service employees  Marketing (bad experience coverage; promotional; affiliate customer generation) Revenue  Percentage of order placed under/around 10 %  Monthly fee for access to platform (levied on restaurants)  Advertising on site BUSINESS MODEL CANVAS DAY 2:
  • 7.
    DATA ANALYSIS RESULTS: Mostinsightful results: • 81% of respondents are in Finance, Consulting, Law, Marketing • 65% of respondents work in Finance • 92% are time or cuisine driven. • Price insensitive • They have lunch out of their office on average 4.03 times a week, and twice with coworkers or friends • They would use Fast Tab 1.36 times per week 105 data points, collected in midtown fast-casual restaurants between 11:30am and 01:00pm Social Consumer  20-30 years old  Works in Finance  Willing to spend $30  Looking for a a more social alternative Professional Consumer  25-40 years old  Slightly more senior  Most concerned with time and quality  EXPENSED the meal to corporation Customer Archetypes:
  • 8.
    HIGH END RESTAURANT WANTSPROVIDES New customer pool High quality food Business professional Exceptional atmosphere and services Next generation regulars LIMITED time commitment WANTS PROVIDES Higher quality food / Atmosphere High LTV OWNERSHIP over time commitment Added Revenue $ FAST TAB PRODUCT-MARKET FIT CONSUMER POOL
  • 9.
    Partners  Restaurants  CorporatePrivate Events Departments  Open Table API  Yelp/Eater  Payment processor Strategic Partners  Uber/lyft/via  Advertising parallels  Hotels/convention centers Value Proposition Customer  Time/Access  Atmosphere/Social  Alternative to fast-casual  Quality meal Operator  Access to new customers  Turn Time (primary gain)  Free Promotion  Interpretation error reduced  Relationship building with private event clients Corporate  Alternative to the catered conference room lunch  Networking lunches Customer Segmentation Corporate  Event planner Social Consumer  Young professional working in finance, Consulting, marketing, law, etc  Price insensitive  Wants more social alternatives . Professional Consumer  Slightly more senior and high end driven  Wants to facilitate Client lunches but are time driven High-end Restaurants  Midtown, $25-35/meal High Volume Restaurants  ~$15-25/meal, midtown, crowded Activities  Open Table and seamless web functionality  Order and ‘fire’ confirmation  Customer service relations Resources  Customer/ Restaurant Database  Consumer Digital Interface with a 2 hour lead time booking  Operator Digital Interface  IT/Administrative/ customer service staff Customer Relationships  Reliability- punctuality, accuracy, quality  Ease of use  Diverse options  Exemplary customer service Channels  Multichannel notification within the restaurant  Private event bookers  Organic growth (invitation)  App Store  Social media  Restaurants Costs  Development of Customer and Operator Digital Interface  Servers and Code maintenance  IT/Administrative/customer service employees  Marketing (bad experience coverage; promotional; affiliate customer generation) Revenue  Percentage of order placed under/around 10 %  Monthly fee for access to platform (levied on restaurants)  Advertising on site BUSINESS MODEL CANVAS DAY 3-4:
  • 10.
  • 11.
    TARGET MARKET: High-end Restaurants MajorBanks Major Law Firms Major Advertisement Firms RESTAURANT NETWORK Top 30 restaurants in Manhattan have a total revenue of $526 Million
  • 12.
  • 13.
    APPENDIX CHANNEL, GET STRATEGY,REVENUE MODEL, PETAL DIAGRAM, MARKET SIZING, ETC.
  • 14.
    CHANNEL & REVENUEMODEL Customer •Books Table (through Fast Tab, Open table API, etc.) •Specifies time •Specifies food selection Fast Tab •Receives payment •Notifies operator Operator •Transmits information (time & food selection) to the kitchen •Fire order at the right time ahead of customer’s arrival Customer •Arrives, sits, eats and leaves Fast Tab •Transfer payment to operator (End of each month) Operator •Pay ~10%fees to Fast Tab Booking confirmation Virtual Physical GET STRATEGY • In-bed “filter” with yelp & OpenTable search (E.g. Fast Tab available) • Organic Expansion Strategy: Word of mouth (E.g. Coworkers, friends) • Restaurant’s advertisement (E.g. Fast Tab Reserve Sign) • Corporate Partnership (E.g. Client lunch)
  • 15.
    PETAL DIAGRAM: FOOD DELIVERY CATERINGSERVICES PAYMENT GATEWAY RESERVATION SERVICES FOOD REVIEWING POINT OF SALE FAST TAB
  • 16.
    MARKET SIZING TAM TSM TARGET MARKET •New YorkState •Total Restaurant industry revenue: $33.2 Billion •New York City •Total revenue of the restaurant industry: $9 Billion •Top 30 restaurants in Manhattan •Total revenue: $526 Million PENETRATION RATE (E.G. ~20%) X TARGET MKT X FEES (~10%) = $10M