1. Material Science
Prof. Satish V. Kailas
Associate Professor
Dept. of Mechanical Engineering,
Indian Institute of Science,
Bangalore – 560012
India
Chapter 8. Failure
Failure can be defined, in general, as an event that does not accomplish its intended
purpose. Failure of a material component is the loss of ability to function normally.
Components of a system can fail one of many ways, for example excessive deformation,
fracture, corrosion, burning-out, degradation of specific properties (thermal, electrical, or
magnetic), etc. Failure of components, especially, structural members and machine
elements can lead to heavy loss of lives, wealth and even may jeopardize the society!
This chapter deals with the study of failures by mechanical means i.e. application
stresses.
Even though the causes of failure are known, prevention of failure is difficult to
guarantee. Causes for failure include: improper materials selection, improper processing,
inadequate design, misuse of a component, and improper maintenance. It’s the engineer’s
responsibility to anticipate and prepare for possible failure; and in the event of failure, to
assess its cause and then take preventive measures.
Structural elements and machine elements can fail to perform their intended functions in
three general ways: excessive elastic deformation, excessive plastic deformation or
yielding, and fracture. Under the category of failure due to excessive elastic deformation,
for example: too flexible machine shaft can cause rapid wear of bearing. On the other
hand sudden buckling type of failure may occur. Failures due to excessive elastic
deformation are controlled by the modulus of elasticity, not by the strength of the
material. The most effective way to increase stiffness of a component is by tailoring the
shape or dimensions. Yielding or plastic deformation may render a component useless
after a certain limit. This failure is controlled by the yield strength of the material. At
room temperature, continued loading over the yielding point may lead to strain hardening
followed by fracture. However at elevated temperatures, failure occurs in form of time-
dependent yielding known as creep. Fracture involves complete disruption of continuity
of a component. It starts with initiation of a crack, followed by crack propagation.
Fracture of materials may occur in three ways – brittle/ductile fracture, fatigue or
progressive fracture, delayed fracture. Ductile/brittle fracture occurs over short period of
time, and distinguishable. Fatigue failure is the mode in which most machine parts fail.
Fatigue, which is caused by a critical localized tensile stress, occurs in parts which are
2. subjected to alternating or fluctuating stress. Stress-rupture occurs when a metal has been
statically loaded at an elevated temperature for a long time, and is best example for
delayed fracture.
8.1 Fracture, Ductile and Brittle fracture
8.1.1 Fracture
Fracture is a form of failure, and is defined as the separation or fragmentation of a solid
body into two or more parts under the action of stress. Fracture that occurs over a very
short time period and under simple loading conditions (static i.e. constant or slowly
changing) is considered here. Fracture under complex condition, for example alternating
stress, is considered in later sections.
The process of fracture can be considered to be made up of two components, crack
initiation followed by crack propagation. Fractures are classified w.r.t. several
characteristics, for example, strain to fracture, crystallographic mode of fracture,
appearance of fracture, etc. Table-8.1 gives a brief summary of different fracture modes.
Table-8.1: Different fracture modes.
characteristic terms used
Strain to fracture Ductile Brittle
Crystallographic mode Shear Cleavage
Appearance Fibrous and gray Granular and bright
Crack propagation Along grain boundaries Through grains
Shear fracture, promoted by shear stresses, occurs as result of extensive slip on active
slip plane. On the other hand, cleavage fracture is controlled by tensile stresses acting
normal to cleavage plane. A shear fracture surface appears gray and fibrous, while a
cleavage fracture surface appears bright or granular. Actual fracture surfaces often appear
as mixture of fibrous and granular mode. Based on metallographic examination of
fracture surfaces of polycrystalline materials, they are classified as either transgranular or
intergranular. Transgranular fracture, as the name go by, represents crack propagation
through the grains, whereas intergranular fracture represents the crack that propagated
along the grain boundaries.
The fracture is termed ductile or brittle depending on the ability of a material to undergo
plastic deformation during the fracture. A ductile fracture is characterized by
considerable amount of plastic deformation prior to and during the crack propagation. On
the other hand, brittle fracture is characterized by micro-deformation or no gross
deformation during the crack propagation. Plastic deformation that occurs during ductile
fracture, if monitored, can be useful as warning sign to the fracture that may occur in later
stages. Thus brittle fracture shall be avoided as it may occur without warning!
3. Since deformation of a material depends on many conditions such as stress state, rate of
loading, ambient temperature, crystal structure; ductile and brittle are relative terms.
Thus the boundary between a ductile and brittle fracture is arbitrary and depends on the
situation being considered. A change from the ductile to brittle type of fracture is
promoted by a decrease in temperature, an increase in the rate of loading, and the
presence of complex state of stress (for example, due to a notch). Under the action of
tensile stresses, most metallic materials are ductile, whereas ceramics are mostly brittle,
while polymers may exhibit both types of fracture. Materials with BCC or HCP crystal
structure can be expected to experience brittle fracture under normal conditions, whereas
materials with FCC crystal structure are expected to experience ductile fracture.
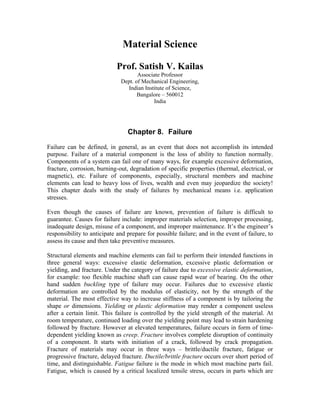
Figure-8.1 depicts characteristic macroscopic fracture profiles. The profile shown in
figure-8.1(a) is representative of very high ductility represented by close to 100%
reduction in cross-sectional area. This kind of failure is usually called rupture. It is
observed in very soft metals such as pure gold and lead at room temperature and other
metals, polymers, glasses at elevated temperatures. Most ductile metals fracture preceded
by a moderate amount of necking, followed by formation of voids, cracks and finally
shear. This gives characteristic cup-and-cone fracture as shown by figure-8.1(b). In this
central interior region has an irregular and fibrous appearance. Figure-8.1(c) presents the
typical profile of brittle fracture which is usually transgranular. It occurs in most ceramics
and glasses at room temperature, long-chain polymers below their glass transition
temperatures, certain metals and alloys below their ductile-to-brittle transition
temperatures.
Figure-8.1: Fracture profiles.
Detailed and important information on the mechanism of fracture can be obtained from
microscopic examination of fracture surfaces. This study is known as fractography. This
4. study is most commonly done using SEM (scanning electron microscope). Common
microscopic modes of fracture observed include cleavage, quasi-cleavage, and dimpled
rupture. Characteristic feature of cleavage fracture is flat facets, and these exhibit river
marking caused by crack moving through the crystal along number of parallel planes
which form a series of plateaus and connecting ledges. Quasi-cleavage fracture is related
but distinct from cleavage in the sense that fracture surfaces are not true cleavage planes.
This often exhibit dimples and tear ridges around the periphery of the facets. Dimpled
rupture is characterized by cup-like depressions whose shape is dependent on stress state.
The depressions may be equi-axial, parabolic, or elliptical. This dimpled rupture
represents a ductile fracture. Table-8.2 distinguishes two common modes of fracture.
Table-8.2: Ductile Vs Brittle fracture.
Parameter Ductile fracture Brittle fracture
Strain energy required Higher Lower
Stress, during cracking Increasing Constant
Crack propagation Slow Fast
Warning sign Plastic deformation None
Deformation Extensive Little
Necking Yes No
Fractured surface Rough and dull Smooth and bright
Type of materials Most metals (not too cold) Ceramics, Glasses, Ice
8.1.2 Ductile fracture
Most often ductile fracture in tension occurs after appreciable plastic deformation. It
occurs by a slow tearing of the metal with the expenditure of considerable energy. It can
be said that ductile fracture in tension is usually preceded by a localized reduction in
cross-sectional area, called necking. Further it exhibits three stages - (1) after on set of
necking, cavities form, usually at inclusions at second-phase particles, in the necked
region because the geometrical changes induces hydrostatic tensile stresses, (2) the
cavities grow, and further growth leads to their coalesce resulting in formation of crack
that grows outward in direction perpendicular to the application of stress, (3) final failure
involves rapid crack propagation at about 45 ْ to the tensile axis. This angle represents
the direction of maximum shear stress that causes shear slip in the final stage. During the
shear slip, crack propagates at a rapid speed around the outer perimeter of neck leaving
one surface in form of cup, and the other in form of cone. Thus it is known as cup-and-
cone fracture. In this central interior region has an irregular and fibrous appearance,
which signifies plastic deformation. Different progressive stages of ductile fracture are
shown in figure-8.2.
5. Figure-8.2: Stages of ductile tensile fracture.
The voids are thought to be nucleated heterogeneously at sites where further deformation
is difficult. These preferred sites mainly consists of foreign inclusions, second-phase
particles like oxide particles, or even voids those can form at grain boundary triple points
in high-purity metals. It has been observed that concentration of nucleating sites had a
strong influence on ductile fracture as true strain to fracture decreases rapidly with
increasing volume fraction of second phase particles. In addition, particle shape also has
an important influence. When the particles are more spherical than plate-like, cracking is
more difficult and the ductility is increased. This is because dislocations can cross slip
around spherical particles with ease than around plate-like particles thus avoids buildup
of high stresses.
More details of fracture mechanism can be obtained from fractographic study of the
fracture surface. At high magnification under microscope, numerous spherical dimples
separated by thin walls are found on the ductile fractured surface. This is an indication
that surface had formed from numerous holes which were separated by thin walls until it
fractures. Dimples formed on shear lip of cup-and-cone fracture will be elongated
attaining parabolic shape which is indication that shear failure took place.
Ductile fracture is not particularly important in terms of mechanical behavior because it
usually is associated with good toughness. However, McClintock’s analytical treatment
of ductile fracture resulted in the following equation, which gives strain to fracture, εf,
[ ])32()()1(sinh
)2ln()1( 00
σσσ
ε
ba
f
n
bln
+−
−
=
for a material with a stress-strain curve given by , and σn
Kεσ = a, σb are stresses parallel
and perpendicular to the axis of the cylindrical holes respectively, σ¯ is the true flow
stress, b0 is initial radius of cylindrical holes and l0 is the average spacing of holes. The
equation indicates that ductility decreases as void fraction increases, as the strain-
hardening exponent, n, decreases. This is the consequence of change of stress state from
uni-axial to tri-axial tension.
6. 8.1.2 Brittle fracture
The other common mode of fracture is known as brittle fracture that takes place with
little or no preceding plastic deformation. It occurs, often at unpredictable levels of stress,
by rapid crack propagation. The direction of crack propagation is very nearly
perpendicular to the direction of applied tensile stress. This crack propagation
corresponds to successive and repeated breaking to atomic bonds along specific
crystallographic planes, and hence called cleavage fracture. This fracture is also said to
be transgranular because crack propagates through grains. Thus it has a grainy or faceted
texture. Most brittle fractures occur in a transgranular manner. However, brittle fracture
can occur in intergranular manner i.e. crack propagates along grain boundaries. This
happens only if grain boundaries contain a brittle film or if the grain-boundary region has
been embrittled by the segregation of detrimental elements.
In analogy to ductile fracture, as supported by number of detailed experiments, the brittle
fracture in metals is believed to take place in three stages - (1) plastic deformation that
causes dislocation pile-ups at obstacles, (2) micro-crack nucleation as a result of build-up
of shear stresses, (3) eventual crack propagation under applied stress aided by stored
elastic energy.
As mentioned earlier, brittle fracture occurs without any warning sign, thus it needs to be
avoided. Hence brittle fracture and its mechanism have been analyzed to a great extent
compared to ductile fracture. Brittle fracture usually occurs at stress levels well below
those predicted theoretically from the inherent strength due to atomic or molecular bonds.
This situation in some respects is analogous to the discrepancy between the theoretical
strength shear strength of perfect crystals and their observed lower yield strength values.
When a crystal is subjected to tensile force, separation between atoms will be increased.
The repulsive force decreases more rapidly with this than the attractive force, so that a net
force between atoms balances the tensile force. With further increase in tensile force,
repulsive force continues to decrease. At an instant, repulsive force becomes negligible
because of increased separation, which corresponds to theoretical cohesive strength of the
material. Assume that inter-atomic spacing of atoms in unstrained condition is a, and x is
change in mean inter-atomic distance. Strain, ε, is given by
a
x
=ε
And according to Hooke’s law, if E – Young’s modulus
a
Ex
E == εσ
Cohesive force can be approximated with little or no error using a sine curve as follows
(refer to chapter-3: theoretical strength):
7. λ
π
σσ
x
th
2
sin=
where λ is wave length of the curve. For small values of x, sin x ≈ x, and thus
λ
π
σσ
x
th
2
=
If Hooke’s law equation is substituted in the above equation,
ππ
λ
σ
E
a
E
th ≈=
2
In a brittle material, when fracture occurs, work expended goes into creation of two new
surfaces, each with a surface energy, γ. Work done per unit area of fracture surface, W, is
the area under the stress-strain curve.
γ
π
λσ
λ
π
σ
λ
2
2
sin
2
0
=== ∫
th
th dx
x
W
⇒
thσ
πγ
λ
2
= ⇒
21
⎟
⎠
⎞
⎜
⎝
⎛
=
a
E
th
γ
σ
As brittle fracture involves, crack propagation, let’s assume that a material has an interior
crack of length 2c (or a surface crack of length c) with radius of curvature as ρ as shown
in figure-8.3.
8. Figure-8.3: Schematic presentation of interior and surface cracks.
The maximum stress at the tip of crack is
2121
max 221 ⎟⎟
⎠
⎞
⎜⎜
⎝
⎛
≈
⎥
⎥
⎦
⎤
⎢
⎢
⎣
⎡
⎟⎟
⎠
⎞
⎜⎜
⎝
⎛
+=
ρ
σ
ρ
σσ
cc
Before fracture starts, maximum stress at the crack tip shall rise to theoretical value of
cohesive strength. Once both are equal, crack propagates. The stress is then can be called
nominal fracture stress, σf, is given by
21
4
⎟
⎠
⎞
⎜
⎝
⎛
≈
ac
E
f
γρ
σ
The sharpest crack (i.e. maximum stress concentration) can be represented by ρ = a.
Thus,
21
4
⎟
⎠
⎞
⎜
⎝
⎛
≈
c
E
f
γ
σ
Griffith theory: Griffith proposed that a brittle material contains number of micro-cracks
which causes stress rise in localized regions at a nominal stress which is well below the
theoretical value. When one of the cracks spreads into a brittle fracture, it produces an
increase in the surface energy of the sides of the crack. Source of the increased surface
energy is the elastic strain energy, released as crack spreads. Griffith’s criteria for
9. propagation of crack include these terms as: a crack will propagate when the decrease in
elastic energy is at least equal to the energy required to create the new crack surface. This
criterion is useful in determining the tensile stress which will just cause a critical sized
crack to propagate as a brittle fracture.
Elastic energy stored under tensile stress will be released as crack propagates. Part of this
energy is expended in forming the surface of the crack, while the remaining is
transformed into kinetic energy. According to Griffith, such as crack will propagate and
produce brittle fracture when an incremental increase in its length doe not change the net
energy of the system. Strain energy released in a thin plate of unit thickness is given by
Inglis as follows:
E
c
Ue
22
πσ
=
where E is Young’s modulus, and is the applied stress. At the same time, surface energy
gained by the system due to new surfaces formed as a crack, of length 2c, propagates can
be given as
cUs γ4=
Griffith’s criterion can be expressed as follows for incremental change in systems energy
with crack length:
c
U
c
U se
∂
∂
=
∂
∂
⇒ γ
πσ
4
2 2
=
E
c
⇒
21
2
⎟
⎠
⎞
⎜
⎝
⎛
=
π
γ
σ
c
E
The equation gives the stress required to propagate a crack in a thin plate under plane
stress. The stress necessary to cause fracture varies inversely with length of existing
cracks, thus largest crack determines the strength of material. The sensitivity of the
fracture of solids to surface conditions has been termed Joffe effect. For a plate which is
thick compared with crack size (i.e. plane strain condition), the stress is given as
21
2
)1(
2
⎟⎟
⎠
⎞
⎜⎜
⎝
⎛
−
=
πν
γ
σ
c
E
where ν is Poisson’s ratio. The Griffith theory applies only to completely brittle
materials. In crystalline materials which fracture in an apparently brittle mode, plastic
deformation usually occurs next to fracture surface. Orowan, thus, modified the Griffith
equation to make it more compatible by including plastic energy term as follows:
2121
)(2
⎟
⎠
⎞
⎜
⎝
⎛
≈⎟
⎠
⎞
⎜
⎝
⎛ +
=
c
Ep
c
pE
π
γ
σ
10. where p is the work of plastic deformation at the tip of the growing crack. The surface
energy term is neglected in the above equation since plastic work values are in order of
102
-103
J m-2
as compared to surface energy values whose range is 1-2 J m-2
.
8.2 Fracture mechanics
It is a relatively new section of materials study under mechanical loading conditions.
Using fracture mechanics concept it possible to determine whether a crack of given
length in a material with known toughness is dangerous at a given stress level. This
mechanics section can also provides guide lines for selection of materials and design
against fracture failures.
Orowan modified equation is further modified by Irwin to replace the hard to measure
plastic work term with other term that was directly measurable. New form of the equation
21
⎟
⎠
⎞
⎜
⎝
⎛
=
π
σ
c
EGc
where Gc is the critical value of crack-extension force.
⇒
E
c
G
2
πσ
=
G has units of J m-2
, and is actually strain-energy release rate that is experimentally
measurable. The critical value of crack extension force, Gc, makes the crack propagate to
fracture, and is considered as one form of fracture toughness of the material. Fracture
toughness is defined as fracture resistance of a material in the presence of cracks.
Fracture occurs due to stress concentration at flaws, like surface scratches, voids, etc. If c
is the length of the crack and ρ the radius of curvature at crack tip, the enhanced stress
(σm) near the crack tip is given by:
21
2 ⎟⎟
⎠
⎞
⎜⎜
⎝
⎛
=
ρ
σσ
c
m
The above equation states that smaller the radius, higher is the stress enhancement.
Another parameter, often used to describe fracture toughness is known as critical stress
concentration factor, K, and is defined as follows for an infinitely wide plate subjected to
tensile stress perpendicular to crack faces:
πσ cK =
This relation holds for specific conditions, and here it is assumed that the plate is of
infinite width having a through-thickness crack. It is worth noting that K has the unusual
11. units of MPa√m. It is a material property in the same sense that yield strength is a
material property. The stress intensity factor K is a convenient way of describing the
stress distribution around a flaw. For the general case the stress intensity factor is given
by
πασ cK =
where α is a parameter that depends on the specimen and crack sizes and geometries, as
well as the manner of load application. For example, for a plate of width w loaded in
tension with a centrally located crack of length 2c,
21
tan ⎟
⎠
⎞
⎜
⎝
⎛
==
w
c
c
w
ccK
π
π
πσπασ
In this regard, it is important to realize that there are three basic modes of fracture, as
shown in figure-8.4. Mode-I corresponds to fracture where the crack surfaces are
displaced normal to themselves. This is a typical tensile type of fracture. In mode-II,
crack surfaces are sheared relative to each other in a direction normal to the edge of the
crack. In mode-III, shearing action is parallel to the edge of the crack. To indicate
different modes, it is normal practice to add the corresponding subscript. The above
example described is obviously of the mode-I. There are two extreme cases for mode-I
loading. With thin plate-type specimens the stress state is plane stress, while with thick
specimens there is a plane-strain condition. The plane-strain condition represents the
more severe stress state and the values of K are lower than for plane-stress specimens.
The fracture toughness measured under plane-strain conditions is obtained under
maximum constraint or material brittleness. The plane strain fracture toughness is
designated as KIc, and is a true material property.
Figure-8.4: Crack deformation modes.
12. While crack extension force, G, has more direct physical significance to the fracture
process, the stress intensity factor K is preferred in working with fracture mechanics
because it is more amenable to analytical determination. Both these parameters are
related as:
GEK =2
for plane stress (e.g. thin plate)
)1( 22
ν−= GEK for plane strain (e.g. thick plate)
Fracture toughness for mode-I, plane strain fracture toughness KIc, depends on many
factors, the most influential of which are temperature, strain rate, and microstructure. The
value of KIc decreases with increasing strain rate and decreasing temperature. Normally
values of KIc increases with reduction in grain size. In addition, an enhancement in yield
strength generally produces a corresponding decrease in KIc. The minimum thickness to
achieve plane-strain conditions and valid KIc measurements is
2
0
5.2 ⎟⎟
⎠
⎞
⎜⎜
⎝
⎛
=
σ
IcK
B
where σ0 is the 0.2% offset yield strength.
8.3 Impact fracture testing, Ductile-to-Brittle transition
8.3.1 Impact fracture testing
As mentioned in earlier section, three basic factors contribute to a brittle-cleavage type of
fracture. They are (1) tri-axial state of stress (2) a low temperature and (3) a high strain
rate or rapid rate of loading. A tri-axial state of stress, such as exists at a notch, and low
temperature are responsible for most service failures of brittle type. Since, these effects
are accented at a high rate of loading, various types of notched-bar impact tests have been
used to determine the susceptibility of materials to brittle fracture.
The changes produced by the introduction of a notch have important consequences in the
fracture process. The chief effect of the notch is not in introducing a stress concentration
but in producing a tri-axial state of stress at the notch. As a result of this tri-axial state of
stress, yield strength of a notched specimen is greater than the uni-axial yield strength
because it is more difficult to spread the yielded zone in the presence of tri-axial stresses.
The ratio of notched-to-unnotched strength is referred as the plastic-constraint factor, q.
Unlike stress concentration factor, which can reach values in excess of 10 as the notch is
made sharper and deeper, Orowan has shown that the plastic constraint factor cannot
exceed a value of 2.57. It results in notch-strengthening of a ductile material. But in a
material prone to brittle fracture the increased tensile stresses from the plastic constraint
can exceed the critical value for fracture before the material undergoes general plastic
yielding. A notch, thus, increases the tendency for brittle fracture in four important ways:
(a) By producing high local stresses, (b) by introducing a tri-axial state of stress, (c) by
13. producing high local strain hardening and cracking, and (d) by producing a local
magnification to the strain rate.
Two classes of specimens have been standardized for notch-impact testing: (i) Charpy
specimen. It has a square cross section and contains 45 ْ V notch, 2 mm deep with a 0.25
mm root radius. The specimen is supported as a horizontal beam, and loaded behind the
notch by the impact of heavy swinging pendulum with velocity about 5 m/sec. The
energy expended is measured in terms of change in potential energy (height) of the
pendulum. The specimen is forced to bend and fracture at a high strain rate in order of
103
sec-1
. The V-notch in the specimen provides triaxiality of stress, and the high hammer
velocity insures a high strain rate. (ii) Izod specimen. It has either circular or square cross
section and contains V notch near the clamped end. It is supported as over hanging
vertical beam. Load is again applied using swinging pendulum but in front of the notch.
Figure-8.5 depicts loading of Charpy and Izod specimens for notch-impact tests.
Figure-8.5: Loading of Charpy and Izod notched-bar impact testing specimens.
The principal measurement from the impact test is the energy absorbed in fracturing the
specimen. Energy expended during fracture is some times known as notch toughness. The
energy expended will be high for complete ductile fracture, while it is less for brittle
fracture. However, it is important to note that measurement of energy expended is only a
relative energy, and can not be used directly as design consideration. Another common
result from the Charpy test is by examining the fracture surface. It is useful in
determining whether the fracture is fibrous (shear fracture), granular (cleavage fracture),
or a mixture of both. A third measurement that can be made is the ductility, indicated by
the percent contraction of the specimen at the notch. The notched-bar impact test is most
useful when conducted over a range of temperatures. Thus it is possible to know at which
temperature the ductile-to-brittle transition is taking place. Thus the chief engineering use
of Charpy test is in selecting materials which are resistant to brittle fracture by means of
transition temperature curves. When selecting a material for design purposes which might
be susceptible to brittle fracture, the material with the lowest transition temperature is to
be preferred.
14. Both plane strain fracture toughness and notched-bar impact tests determine the fracture
properties of materials. The former are quantitative in nature, in that a specific property is
determined. On the other hand, the results of the impact tests are qualitative in nature,
thus are of little use fro design purposes. Plane strain fracture toughness tests are not as
simple to perform as impact tests, and equipment and specimens are more expensive.
8.3.2 Ductile-to-Brittle transition
It is well understood that ductile and brittle are relative, and thus interchange between
these two modes of fracture is achievable with ease. The term Ductile-to-Brittle
transition (DBT) is used in relation to the temperature dependence of the measured
impact energy absorption. For a material, as the temperature is lowered, the impact
energy drops suddenly over a relatively narrow temperature range, below which the
energy has a considerably lower value as a representative of brittle fracture.
The temperature where DBT occurs is termed as Ductile-to-Brittle Transition
Temperature (DBTT). A typical variation of energy expended as a function of
temperature is shown in figure-8.6. From the figure it can be concluded that there is no
single criterion that defines the transition temperature. Above the DBTT, the yield
strength (σy) is lower than the tensile stress necessary to cause brittle failure (σf) i.e. σy <
σf. With decreasing temperature, the yield strength increases rapidly to the point where it
equals the tensile stress for brittle failure, and below this temperature, fracture usually
occurs in brittle/cleavage mode. So, at and below the DBTT, σy = σf. At the transition
temperature, the micro-cracks that form are of critical size for crack propagation, and at
lower temperatures these cracks exceed the critical size. Over a temperature range just
above DBTT, micro-cracks formed are initially sub-critical so that further plastic
deformation and strain hardening must proceed before the tensile stress level becomes
sufficient to cause crack propagation. With further increase in temperature, micro-cracks
no longer form and fracture mode changes from cleavage to ductile.
Figure-8.6: Typical variation of fracture toughness as a function of temperature.
15. As shown in the above figure, BCC metals possess a distinct DBTT compared with other
metals. Common BCC metals are to become brittle at low temperatures or at extremely
high rates of strain. Many FCC metals, on the other hand, remain ductile even at very low
temperatures. In metals DBTT is around 0.1-0.2 Tm while in ceramics it is about 0.5-0.7
Tm, where Tm represents absolute melting temperature. The crack propagation stress
usually is relatively insensitive to temperature. Strain rate which increases the yield
strength but not the crack propagation stress increases the DBTT. As mentioned earlier,
DBTT does not have a unique value for a given material, and is a function of several
other variables such as flaw size, strain rate, triaxiality of stress, etc. Sharp notches in the
specimen provide stress concentration centers and thus increase the DBTT. Fine grained
materials have a lower transition temperature as compared to coarse grained materials.
There are other factors which affect the DBTT for a material, for example metallurgical
factors. One of the most important is microstructure, which in turn can depend on heat
treatment practice and temperature, for example, for steels. The composition also has a
very pronounced effect on DBTT. In steels, it is found that impurities like P, Si, Mo, Cr
along with C increase the DBTT, while Mn and Ni have reverse effect.
8.4 Fatigue, Crack initiation and propagation, Crack propagation rate
8.4.1 Fatigue
Failures occurring under conditions of dynamic or alternating loading are called fatigue
failures, presumably because it is generally observed that these failures occur only after a
considerable period of service. Fatigue failure usually occurs at stresses well below those
required for yielding, or in some cases above the yield strength but below the tensile
strength of the material. These failures are dangerous because they occur without any
warning. Typical machine components subjected to fatigue are automobile crank-shaft,
bridges, aircraft landing gear, etc. Fatigue failures occur in both metallic and non-metallic
materials, and are responsible for a large number fraction of identifiable service failures
of metals.
A typical fatigue-fracture surface looks like the one shown in figure-8.7. The fatigue
crack nucleates at the stress concentration. Generally, the fatigue fracture surface is
perpendicular to the direction of an applied stress. A fatigue failure can be recognized
from the appearance of the fracture surface, which shows a smooth and polished surface
that corresponds to the slow growth of crack, when the crack faces smoothen out by
constant rubbing against each other and a rough/granular region corresponds to the stage
of fast growth, after critical conditions is attained where member has failed in a ductile
manner when cross section was no longer able to carry the applied load. The region of a
fracture surface that formed during the crack propagation step may be results in
characteristic pattern of concentric rings spread over the smooth region of the fracture
surface, known as beach marks or striations, radiating outward from the point of
initiation of the failure, as shown in figure-8.7. Beach marks (also known as clamshell
pattern) are macroscopic dimensions and may be observed with the unaided eye. These
markings are found for components that experienced interruptions during the crack
16. propagation stage. Each beach mark band represents a period of time over which crack
growth occurred. On the other hand fatigue striations are microscopic in size and subject
to observation with the electron microscope (either TEM or SEM). The relatively widely
spaced striations are caused by variations in the stress amplitude during the life of the
component. On a much finer level, a large number of striations may be sometimes being
seen. The width of each striation here is equal to the distance by which the crack grows
during one cycle. Any point with stress concentration such as sharp corner or notch or
metallurgical inclusion can act as point of initiation of fatigue crack.
Figure-8.7: Schematic of fatigue fracture surface.
Three basic requisites for occurrence of fatigue fracture are: (a) a maximum tensile stress
of sufficiently high value (b) a large enough variation or fluctuation in the applied stress
and (c) a sufficiently large number of cycles of applied stress. The stress cycles that are
evident in fatigue studies are characterized using many parameters, such as mean stress,
alternating stress, stress ratio and amplitude ratio. If the applied stress varies between σmax
and σmin,
Range of stress, σr = σmax – σmin
Alternating stress, σa = σr/2 = (σmax – σmin)/2
Mean stress, σm = (σmax + σmin)/2
Stress ratio, R= σmin / σmax
Amplitude ratio, A= σa / σm = (1-R) / (1+R)
There are as many ways of conducting a test to measure fatigue as there are ways of
applying repeated stresses to a metal. A specimen of rotating beam type is often used
because of its simplicity. In a fatigue test, the premium output is number of cycles
required to fracture the specimen at a given stress. If the maximum tensile stress applied
17. is only slightly less than the yield strength (or tensile strength), test will run only a few
cycles. Continues reduction of the stress greatly increases the life of the specimen, hence
fatigue data is usually presented by plotting maximum stress (S) against number of cycles
to fracture (N), using a logarithmic scale for the latter variable. This form of curve, S-N
curve, shown in figurer-8.8, is significant because there is a stress below which the
specimens do not fracture. This limiting stress is called fatigue limit or endurance limit
(σe), below which fatigue will never occur. Fatigue limit can be related to tensile strength
of the material, and the ratio of fatigue limit to tensile strength is known as endurance
ratio. Most steels have distinct fatigue limit, and is usually about 0.4-0.5 of tensile
strength i.e. endurance ratio=0.4-0.5. Unlike steels, most nonferrous metals do not have a
fatigue limit i.e. S-N curve continues to fall steadily with decreasing stress, though at a
decreasing rate. Thus, fatigue will ultimately occur regardless of the magnitude of the
applied stress. Fatigue response of these materials is specified for a number of stress
cycles, normally 107
, and is known as fatigue strength. Another important parameter that
characterizes a material’s fatigue behavior is fatigue life, Nf, number of cycles to cause
fatigue failure at a specified stress level.
Figure-8.8: Typical S-N curves for ferrous and non-ferrous metals.
The S-N curve in the high-cycle region is some times described by the Basquin equation:
CN p
a =σ
where σa is the alternating stress or stress amplitude and p and C are empirical constants.
It will be generally found that there is a considerable amount of scatter in the results.
Thus fatigue life and fatigue strength are considered as statistical quantities. It has been
observed that scatter in fatigue life decreases with increase in stress. The statistical
problem of accurately determining the fatigue limit is complicated by the fact that
complete S-N curve cannot obtainable using a single specimen as specimen cannot be
rested during the test.
18. With the exception of rotating shafts, most structural members are not subjected to
symmetrical stress cycles having a mean stress of zero. When (R = -1 for the case of
completely reversed stress) R becomes more positive i.e. with increasing mean stress, the
measured fatigue limit becomes greater (figure-8.9). For a given stress amplitude, a mean
tensile stress reduces the fatigue life of a material. It has been observed that as the mean
stress becomes more positive the allowable alternating stress decreases (figure-8.10).
Figure-8.9: Dependence of fatigue limit on stress ratio.
Figure-8.10: Dependence of alternating stress on mean stress.
The Goodman diagram presents the dependence of allowable stress ranges on mean stress
for a material. As shown in figure-8.11, allowable stress range increases with increasing
compressive mean stress i.e. compressive stress increases the fatigue limit.
19. Figure-8.11: Goodman diagram.
An alternative method of presenting mean stress data is by using Heig-Soderberg diagram
in which alternating stress is plotted against the mean stress. As figure-8.12 depicts,
Goodman’s criterion appears as a straight line. Test data for ductile metals, however,
follows parabolic curve proposed by Gerber. Both these criteria can be expressed as:
⎥
⎥
⎦
⎤
⎢
⎢
⎣
⎡
⎟⎟
⎠
⎞
⎜⎜
⎝
⎛
−=
x
u
m
ea
σ
σ
σσ 1
where x=1 for Goodman line, x=2 for the Gerber parabola, and σe is the fatigue limit for
completely reversed loading. Soderberg line presents the data when the design is based
on yield strength (σ0).
Figure-8.12: Heig-Soderberg diagram.
20. 8.4.2 Crack initiation and propagation
Based on structural changes that occur during fatigue, fatigue failure process can be
considered as made of following stages: (a) crack initiation – includes the early
development of fatigue damage that can be removed by suitable thermal anneal (b) slip-
band crack growth – involves the deepening of initial crack on planes of high shear stress.
This is also known as stage-I crack growth. (c) crack growth on planes of high tensile
stress – involves growth of crack in direction normal to maximum tensile stress, called
stage-II crack growth (d) final ductile failure – occurs when the crack reaches a size so
that the remaining cross-section cannot support the applied load.
Fatigue failures usually are found to initiate at a free surface or at internal flaws such as
inclusions where the local stress causes some heterogeneous permanent flow leading to
formation of a small crack. Fatigue failures start as small microscopic cracks and,
accordingly, are very sensitive to even minute stress raisers. It has been observed that
diffusion processes are not necessary to the formation of fatigue cracks. The initiation of
a fatigue crack does not lead to immediate failure, rather, the crack propagates slowly and
discontinuously across the specimen under the action of cyclic stress. The amount of
crack motion per cycle depends on the material and the stress level; high stresses favor
larger crack growth increments per cycle. Eventually, the crack propagates to the point
where the remaining intact cross section of material no longer can support the applied
load, and further crack propagation is rapid, leading to catastrophic failure. The final
fracture surface is composed of an area over which there was slow crack propagation and
an area where the crack moved rapidly. Final fracture can be either ductile or brittle type.
In polycrystalline metals, during a fatigue test slip lines appear first on crystal whose slip
planes have the highest resolved shear stress. As time goes on and the number of stress
cycles increases, the size and number of slip bands (clusters of slip lines) increase. The
extent and number of slip bands are also a function of the amplitude of the applied stress;
higher stresses give larger values. In fatigue, under cyclic loading, the slip bands tend to
group into packets or striations in a slip band. Each striation represents the successive
position of an advancing crack front that is normal to the greatest tensile stress. Ridge
kinds of striations are called extrusions while, while crevice striations are known as
intrusions, and both tend to be formed depending on the crystal orientation. It has been
shown that fatigue cracks initiate at intrusions and extrusions. These surface disturbances
are approximately 10-3
to 10-4
mm in height and appear as early as 1/10 of the total life of
a specimen. Figure-8.13 depicts the slip bands forming under static load and cyclic load.
Table-8.3 summarizes deformation features under static and cyclic loading.
With increasing numbers of cycles, the surface grooves deepen and the crevices or
intrusions take on the nature of a crack. When this happens, stage-I of the crack-growth
process has begun i.e. stage-I crack propagates along persistent slip bands, and can
continue for a large fraction of the fatigue life. Low applied stresses and deformation by
slip on a single slip plane favor stage-I growth. On the other hand multiple-slip
conditions favor stage-II growth. The transition from stage-I to stage-II is often induced
when a slip-plane crack meets an obstacle such as a grain boundary. The rate of crack
21. propagation in stage-I is generally very low on the order of nm per cycle compared with
that in stage-II where it is in order of μm per cycle. Thus, from a practical viewpoint,
stage-II is of importance than stage-I. Stage-I growth follows a slip plane, whereas stage-
II growth does not have this crystallographic character. The fracture surface of stage-I is
practically featureless. On the other hand, stage-II shows a characteristic pattern of
striations, which occurs by repetitive plastic blunting and sharpening of the crack tip.
Table-8.4 distinguishes stage-I from stage-II crack growth.
Figure-8.13: Comparison of slip bands formed under (a) static loading and (b) cyclic
loading.
Table-8.3: Deformation under static and cyclic loads.
Feature Static load Cyclic load
Slip (nm) 1000 1-10
Deformation feature Contour Extrusions & Intrusions
Grains involved All grains Some grains
Vacancy concentration Less Very high
Necessity of diffusion Required Not necessary
22. Table-8.4: Fatigue crack growth: stage-I Vs stage-II.
Stage-I Stage-II
Stresses involved Shear Tensile
Crystallographic orientation Yes No
Crack propagation rate Low (nm/cycle) High (μm/cycle)
Slip on Single slip plane Multiple slip planes
Feature Feature less Striations
The region of fatigue fracture surface that formed during the crack propagation step can
be characterized by two types of markings termed beach marks and striations. Both of
these features indicate the position of the crack tip at some point in time and appear as
concentric rings that expand away from the crack initiation site(s), frequently in a circular
or semicircular pattern. Beach marks (some times also called clamshell marks) are of
macroscopic dimensions, found for components that experienced interruptions during the
crack propagation stage. Each beach mark band represents a period of time over which
crack growth occurred. Striations are microscopic in size, and each of it is thought to
represent the advance distance of a crack front during a single load cycle. Striation width
depends on, and increases with, increasing stress range. There may be literally thousands
of striations within a single beach mark. The presence of beach marks/striations on a
fracture surface confirms that the cause of failure in fatigue. Nevertheless, the absence of
either or both does not exclude fatigue as the case of failure.
8.4.3 Crack propagation rate
As pointed out in earlier section, crack propagation in stage-II, where it is faster, has
greater practical importance. Considerable research has gone into studying the crack
propagation in this stage as the results from this can be used as fail-safe design
considerations.
To distinguish the crack propagation time from crack initiation time, pre-existing flaws or
cracks are introduced into a fatigue specimen. Crack propagation rate (da/dN) is studied
in terms of increase in crack growth which is a proportional to number of applied stress
cycles and length of the crack i.e.
nm
a aCafn
dN
da
σσ == ),(
where C – a constant, σa – the alternating stress, a – the crack length, m=2-4, and n=1-2.
It has been found that crack growth rate can be related to stress-intensity factor, K (mode-
I) of fracture mechanics which itself is a combination of stress and crack length. Thus,
23. p
KA
dN
da
)(Δ=
where ∆K – stress-intensity factor range., A and p – constants that are functions of
material, environment, frequency, temperature and stress ratio.
πσπσπσ aaaKKK r=−=−=Δ minmaxminmax
Since the stress intensity factor is not defined for compressive stresses, if σmin is in
compression, zero value is assigned for Kmin.
Fatigue data presented in terms of log (crack growth rate) against log (∆K) is shown in
figure-8.14. The curve can be divided into three regions. In region-I, which is bound by a
threshold value ∆Kth, no observable crack growth occurs i.e. crack growth rate is very
slow in order of 0.25 nm per cycle or less. The straight line part of curve in region-II can
be represented by the power law (also known as Paris law)
p
KA
dN
da
)(Δ=
and slope of the straight line will give value for p. The values of p are the range of 3 for
steels, and in the range of 3-4 for aluminium alloys. Region-III of the curve represents the
rapid unstable crack growth to ultimate fracture. Here Kmax approaches Kc, the fracture
toughness of the material. When K is known under relevant loading conditions, the
fatigue life can be estimated by integrating the above equation between limits of initial
crack size and final crack size. One such equation is given below when p≠2:
)1)2/((2
1)2/(
0
1)2/(
+−
−
=
+−+−
pA
aa
N ppp
mm
f
f
απσ
Nf – number of cycles required for a crack to grow from a0 to af. α - is a parameter that
depends on the specimen and crack sizes and geometries, as well as the manner of load
application.
24. Figure-8.14: Schematic presentation of fatigue crack growth.
Increasing mean stress, R, in the fatigue cycle has a tendency to increase the crack growth
rates in all portions of the curve. The effect of increasing R is less in region-II than in
regions I and III. The influence of R on the region-II is given by:
KKR
KA
dN
da
c
p
Δ−−
Δ
=
)1(
)(
where Kc – fracture toughness, R – stress ratio. Fatigue life estimation is usually carried
out when R=-1 i.e. fully reversed stress conditions, whereas fatigue crack growth data is
determined for R=0 i.e. pulsating tension without compression. Compression loads are
avoided because during compression loading the crack is closed and the stress intensity
factor is zero.
8.5 Creep, Generalized creep behavior, Stress and Temperature effects
8.5.1 Creep
It is well known and observed number of times that shear modulus of a material increases
with decreasing temperature, and this has a corresponding effect on the flow-stress, since
the stress associated with a dislocation is always proportional to the shear modulus. Thus
σ/E can be expected to be constant with varying temperature. However, this ratio
25. decreases with increase in temperature. Since, the dislocation-density contribution of the
flow stress is effectively constant, it was concluded that there must be a second basic
component of flow stress that is temperature-dependent i.e.
Eσσσ += *
where σ* is thermal component and σE is athermal component of flow stress. The fact that
the flow stress contains a component that responds to thermal activation implies that
plastic deformation can occur while both the temperature and the stress are maintained
constant. Deformation that occurs under these conditions which is time-dependent is
known as creep. Creep deformation (constant stress) is possible at all temperatures above
absolute zero. However, it is extremely sensitive to temperature. Hence, creep in usually
considered important at elevated temperatures (temperatures greater than 0.4 Tm, Tm is
absolute melting temperature).
8.5.2 Generalized creep behavior
Creep behavior of a material is studied using creep test. In creep test, the tensile specimen
is subjected to a constant load or stress at a constant temperature. Most creep tests are
conducted at constant load in analogous to engineering application, whereas creep tests at
constant stress are necessary for understanding of mechanism of creep. During the creep
test, strain (change in length) is measured as a function of elapsed time. Creep test data is
presented as a plot between time and strain known as creep curve. Figure-8.15 depicts a
typical creep curve. The slope of the creep curve is designated as creep rate.
Figure-8.15: Typical creep curve.
As shown in the above figure, upon loading the specimen, there is an instantaneous
deformation (ε0) that is mostly elastic. Actual creep curve follows this elastic
26. deformation. Based on the variation of creep rate with time, creep curve is considered to
be consists of three portions, each of which has its own distinctive strain-time feature.
After initial rapid elongation, ε0, the creep rate decreases continuously with time, and is
known as primary or transient creep. Primary creep is followed by secondary or steady-
state or viscous creep, which is characterized by constant creep rate. This stage of creep
is often the longest duration of the three modes. Finally, a third stage of creep known as,
tertiary creep occurs that is characterized by increase in creep rate. Creep curve could be
represented by the following equation, according to Andrade:
kt
et )1( 31
0 βεε +=
where ε is strain in time t, and β and k are constants. A better equation is proposed by
Garofalo:
te s
rt
t εεεε &+−+= −
)1(0
where ε0 – instantaneous strain on loading, εt – limit for transient creep, r – ratio of
transient creep rate to the transient creep strain, ·εs – steady-state creep rate.
It is suggested that during primary creep, material strain hardens thus increases its creep
resistance. Constant creep rate during secondary creep is believed to be due to balance
between the competing processes of strain hardening and recovery. The average value of
creep rate during the secondary creep is called the minimum creep rate. Third stage creep
occurs in constant load tests at high stresses at high temperatures. This stage is greatly
delayed in constant stress tests. Tertiary creep is believed to occur because of either
reduction in cross-sectional area due to necking or internal void formation. Third stage is
often associated with metallurgical changes such as coarsening of precipitate particles,
recrystallization, or diffusional changes in the phases that are present.
For metallic materials most creep tests are conducted in uni-axial tensile mode. However,
uni-axial compression tests are used for brittle materials to avoid stress amplification and
corresponding crack propagation. For most materials creep properties are independent of
loading direction.
The minimum creep rate is the most important design parameter derived from the creep
curve. It is the engineering design parameter that is considered for long-life applications,
e.g. nuclear power plant components. On the other hand, for short-life components (e.g.
turbine blades, rocket motor nozzles), time to rupture or rupture lifetime is the dominant
factor in design. It is found from test conducted to the point of failure, and the test is
known as stress-rupture test. This is basically similar to a creep test except that the test is
always carried out at higher loads. In a creep test total strain is often less than 0.5%,
while in stress-rupture test it is around 50%.
8.5.2 Stress and temperature effects
27. Creep properties of a material are usually characterized at a constant stress and a constant
temperature. A change in either of these parameters causes change in creep behavior of
the material. With increase in either stress or temperature (a) instantaneous elastic strain
increases (b) steady state creep rate increases and (c) rupture lifetime decreases.
Influence of stress on steady state creep rate can be written as
n
s K σε 1=&
where K1 and n are material constants. Value of these parameters can found from
logarithmic plot between creep rate and stress after conducting tests at a constant
temperature. Similarly temperature influence on steady state creep rate can be
characterized. Influence of combined action of temperature and stress on steady state
creep rate can be presented as follows:
RT
Q
n
s
c
eK
−
= σε 2
&
where K2 and Qc (activation energy for creep) are constants. Values of n for a specific
material are dependent mechanism of creep operational in those particular conditions of
stress and temperature. Figure-8.16 presents the influence of stress/temperature on creep
behavior.
Figure-8.16: Influence of stress/temperature on creep behavior.
Creep data presented in form of stress-temperature diagrams are termed deformation
mechanism maps which indicates stress-temperature regimes over which various
mechanisms operate. The chief creep deformation mechanisms are:
28. Dislocation glide – involves dislocation moving along slip planes by overcoming
barrier with help of thermal activation. This occurs at high stresses, σ/G >10-2
.
Dislocation creep – involves movement of dislocations which overcome barriers
by thermally assisted mechanisms like diffusion of vacancies or interstitials.
Occurs at moderate stresses, 10-2
>σ/G >10-4
.
Diffusion creep – involves flow of vacancies and interstitials under the influence
of applied stress. Occurs for σ/G <10-4
.
Grain boundary sliding – involves sliding of grains against each other.
It is to be noted that, quite often, more than one creep mechanism will operate at a time.
When several mechanisms are in operation at a time simultaneously, i.e. independent of
each other, fastest mechanism will dominate the proceedings. On the other hand, when
they are operating in series, slowest mechanism will control the creep deformation.
References
1. G. E. Dieter, Mechanical Metallurgy, Third Edition, McGraw-Hill, New York,
1986.
2. R. W. Hertzberg, Deformation and Fracture Mechanics of Engineering Materials,
Fourth Edition, Wiley, New York, 1996.
3. T. H. Courtney, Mechanical Behavior of Materials, Second Edition, McGraw-
Hill, New York, 2000.