Downloaded 156 times
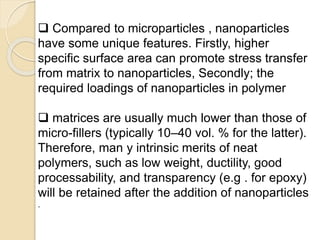
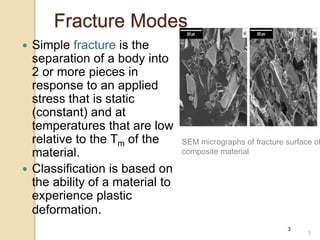
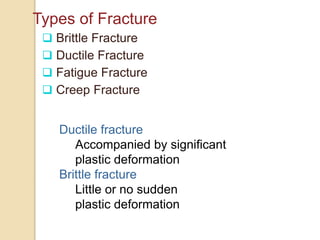
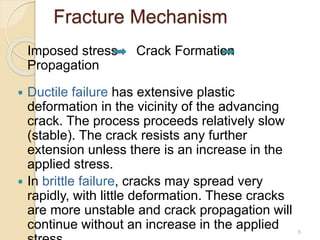
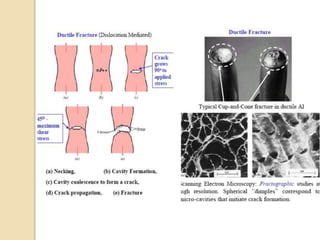
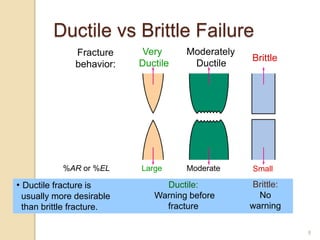
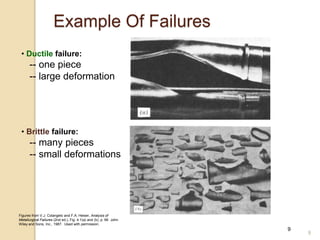
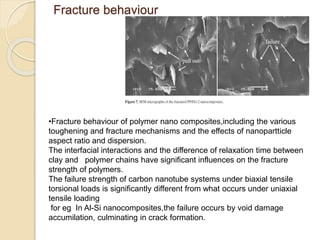
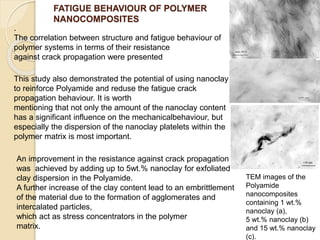
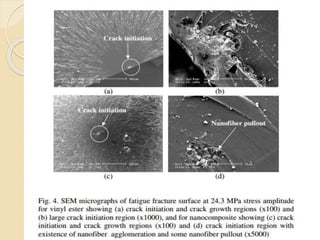


This document discusses the fracture and fatigue behavior of polymer nanocomposites. It notes that nanoparticles have higher specific surface areas than microparticles, which can improve stress transfer and that nanoparticles can be added at lower loadings while retaining properties of the neat polymer matrix. The document covers different types of fractures like brittle and ductile, and describes how the addition of nanoparticles up to 5 wt% can improve the fatigue resistance of polyamide nanocomposites by inhibiting crack propagation, but higher loadings may embrittle the material. TEM images show the differences in clay dispersion with varying nanoparticle content.


![Ch07[1]](https://cdn.slidesharecdn.com/ss_thumbnails/ch071-141226001133-conversion-gate01-thumbnail.jpg?width=640&height=640&fit=bounds)