SlideShare a Scribd company logo
1 of 14
Download to read offline
Al-Tahir R., Saeed I. & Mahabir R. 2014. Application of remote sensing and GIS technologies in flood risk management.
In: Flooding and Climate Change: Sectorial Impacts and Adaptation Strategies for the Caribbean Region. Chadee
DD, Sutherland JM & Agard, JB (Editors). pp. 137-150, Nova Publishers, Hauppauge, New York.
137
Chapter 8
APPLICATIONS OF REMOTE SENSING AND GIS
TECHNOLOGIES IN FLOOD RISK MANAGEMENT
Raid Al-Tahir, Intesar Saeed and Ron Mahabir
The Centre for Caribbean Land and Environmental Appraisal Research (CLEAR)
The University of the West Indies, St Augustine, Trinidad and Tobago
ABSTRACT
Flooding is the most common of all major disasters that regularly affect populations and
results in extensive damage to property, infrastructure, natural resources, and even to loss
of life. To ensure better outcomes, planning and execution of flood management projects
must utilize knowledge on a wide range of factors, most of which are of a spatial nature.
Advances in geospatial technologies, specifically remote sensing and Geographic
Information Systems (GIS), have enabled the acquisition and analysis of data about the
Earth's surface for flood mitigation projects in a faster, more efficient and more accurate
manner.
Remote sensing and GIS have emerged as powerful tools to deal with various aspects of
flood management in prevention, preparedness and relief management of flood disaster.
GIS facilitates integration of spatial and non-spatial data such as rainfall and stream
flows, river cross sections and profiles, and river basin characteristics, as well as other
information such as historical flood maps, infrastructures, land use, and social and
economic data. Such data sets are critical for the in-depth analysis and management of
floods.
Remote sensing technologies have great potential in overcoming the information void in
the Caribbean region. The observation, mapping, and representation of Earth’s surface
have provided effective and timely information for monitoring floods and their effect.
The potential of new air- and space-borne imaging technologies for improving hazard
evaluation and risk reduction is continually being explored. They are relatively
inexpensive and have the ability to provide information on several parameters that are
crucial to flood mapping and monitoring.
This chapter examines the use of the new imagery data as an up-to-date and affordable
source of information for establishing the necessary information for flood management in
the Caribbean region. The chapter also reviews the use of an integrated GIS approach to
Raid Al-Tahir, Intesar Saeed and Ron Mahabir
fulfil data and analysis needs for planning and emergency operations and how it can
become the backbone of emergency management.
INTRODUCTION
Of the various geohazards that disrupt the natural and man-made environments, flooding
is the most common and most costly. In fact, of all natural risks, floods pose the most widely
occurring hazard to life today. A flood is commonly defined as any level of flow that exceeds
the natural carrying capacity of a watercourse, overflows its banks, and inundates the adjacent
low lying lands (OAS 1991). The United States Geological Survey defines a flood as a
“relatively high water that overflows the natural or artificial banks of a stream or coastal area
that submerges land not normally below water” (USGS 2007).
The leading cause of floods is a prolonged heavy rainfall that creates high runoff in
rivers, or a build up of surface water in areas of low relief. On the other hand, intense rainfall
over short periods from storms and hurricanes may produce rapid runoff and sudden but
severe flash floods across river valleys, resulting in insurmountable losses to human life and
property compared to any other type of flooding. Coastal areas are also prone to flooding
when storms and large waves bring seawater onto the land (Few et al. 2004). Small Island
Developing States are especially impacted since a great majority of the population live and
work near coastal areas. Other conditions that may cause flooding are those events that occur
less frequently but result in major consequences when they occur. These include events such
as earthquakes, bursting of reservoirs, failure of dams, dikes and weir gates, and tsunamis.
Specific to developing countries, including the Caribbean region, the flooding problem is
further intensified by inappropriate land use and environmental degradation in areas that are
vulnerable to erosion, rapid water runoff, and slope failure. Poor land-use practices (e.g.,
slash and burn agriculture, quarrying, deforestation, and rapid urbanization and development)
lead to heavy sedimentation in river channels, thus, reducing their carrying capacity. In
parallel, the removal of vegetative cover leads to much shorter lag times between rainfall and
the water reaching the waterways causing the already reduced channels to overflow, leading
to massive floods (Ramlal and Baban 2008).
Further upset in flood events is also expected as a result of global climate change, leading
to consequent increase in extreme climatic events such as severe dry spells, heavy rainstorms
and tidal surges. It is expected that areas most vulnerable will continue to be further
devastated (Few et al. 2004; Ramlal and Baban 2008). Such findings are supported by reports
made available by the Intergovernmental Panel on Climate Change and related research from
scientific bodies with similar interests worldwide.
According to the UN World Water Assessment Programme, floods accounted for 15% of
all deaths related to natural disasters, and approximately 66 million people suffered flood
damage from 1973 to 1997 (WWAP 2006). Persons can be both directly and indirectly
impacted by floods. Direct impacts include loss of lives, damage to property, disruption of
transportation, communications, health and community services, crop and livestock damage,
and interruptions and losses in businesses. The indirect effects of floods are far more
damaging and include elements of society that reflect a more in-depth and personal
assessment of flooding on the wellbeing of people (Badilla 2008).
Applications of Remote Sensing and GIS Technologies in Flood Risk Management 139
Figure 8.1. Total number of reported disasters caused by floods in the World: 1974 – 2003 (Hoyois and
Guha-Sapir 2004).
Developing countries are disproportionately affected by disasters. Economic losses
attributable to natural hazards in developing countries are about 5 times higher per unit of
gross domestic product (GDP) than those of more affluent countries. Furthermore, developing
countries accounted for over 50% of all disaster fatalities from 1992 to 2001, which translates
into approximately 13 times more people die per reported disaster than in developed countries
(Van Westen 2002; WWAP 2006). This problem is further exacerbated with knowledge that
the magnitude and frequency of floods will continue to increase as indicated by the trend in
Figure 8.1 (Badilla 2008; Hoyois and Guha-Sapir 2004).
Given the severe negative impacts of floods there is therefore an urgent need to introduce
proper management measures to ensure that vulnerable areas are protected and flooding
impact is minimized. Whether using structural, non-structural or mixed strategies, improving
the capabilities to mitigate and respond to flood hazards would require better understanding
and mapping of the hazards, as well as identifying the nature and extent of vulnerability of the
areas under consideration. These activities prompt both the need and use of spatial data
representative of the disaster and factors that can be used in assisting all phases of a
comprehensive disaster management program.
This chapter is divided into 4 sections from this point on. Section 2 will review the
different phases and activities of a disaster management program, and highlights the specific
required spatial datasets within each phase. Section 3 will introduce, in general, the use of
Geographic Information Systems (GIS) and remote sensing techniques in flood management,
while Section 4 will identify, in greater detail, specific studies and cases for the application of
these technologies as they relate to the different phases of disaster management. Finally,
section 5 provides conclusions.
2. DISASTER MANAGEMENT ACTIVITIES
Disaster management endeavours to reduce or avoid the potential losses from hazards,
assure prompt and appropriate assistance to victims of disaster, and achieve rapid and
Raid Al-Tahir, Intesar Saeed and Ron Mahabir
effective recovery. Activities related to disaster management can be grouped into pre-event
activities (mitigation and preparedness), actions during and immediately following an event
(rescue and relief), and post-disaster activities (rehabilitation and reconstruction). These
phases are related to each other and are typically represented as a cycle since the occurrence
of a disaster event will eventually influence the way society is preparing for the next one
(Mansor et al. 2004; OAS 1991; Van Westen 2002). The following sections will provide a
synopsis of the activities in each phase with the objective of identifying the required spatial
data.
2.1. Mitigation
Mitigation activities focus on eliminating or reducing the probability of a disaster
occurrence and reducing the impact of unavoidable disaster. This phase involves essentially
three kinds of studies (OAS 1991):
• Natural Hazard Assessments provide information on the probable location and
severity of natural hazards and their likelihood of occurring within a specific time
period in a given area;
• Vulnerability Assessments estimate the degree of loss or damage that would result
from the occurrence of a natural hazard of given severity; and
• Risk Assessments integrate information from the analysis of an area's hazards and its
vulnerability to them, into an estimate of the probability of expected loss from a
hazardous event.
The effectiveness of disaster mitigation depends on the availability of information related
to the hazards and the various sectors affected by them. As such, data collection and analysis
is required to identify and evaluate appropriate measures. Hazard assessment studies rely
heavily on geologic, geomorphic, and soil maps; climate and hydrological data; topographic
maps, aerial photographs, and satellite imagery; as well as historical information on previous
occurrences of the hazard. Vulnerability assessments, on the other hand, need to incorporate
and analyse information on human population, capital facilities and resources, and economic
activities (OAS 1991).
2.2. Preparedness
The goal of disaster preparedness is to develop plans that minimize the loss of life and
damage to property during a natural event. Disaster preparedness promotes the development
of a system for monitoring known hazards, a warning system, emergency and evacuation
plans, and emergency routes. Additionally, this phase includes a number of efforts aimed at
increasing the amount of information disseminated to the public and at promoting cooperation
between the public and the authorities in case of an emergency (Johnson 2000; OAS 1991).
Applications of Remote Sensing and GIS Technologies in Flood Risk Management 141
2.3. Rescue and Relief
Following the occurrence of the disaster, activities in this phase are designed to provide
emergency assistance for victims that include search and rescue, emergency shelter, medical
care, and mass feeding. They also seek to stabilize the situation and reduce the probability of
secondary damage (Johnson 2000). The success of these activities is heavily dependent on
real time information with respect to service routes and up-to-date information on the location
and resource availability at the various critical facilities.
2.4. Post-Disaster Rehabilitation and Reconstruction
Post-disaster activities are necessary to return all systems to a state of normalcy or at least
to a state that is better than that immediately following the occurrence of a disaster. These
activities have a short-term goal of restoring vital life support systems to minimum operating
standards. Additionally, this phase includes long-term rehabilitation activities to re-establish
the functions of public services, business, and commerce, to repair housing and other
structures, and to return production facilities to operation (Johnson 2000; OAS 1991).
Investigations at the post-disaster phase will re-examine the qualitative and quantitative
aspects of natural hazards, often improving on information produced by modelling and
conjecture, by indicating areas where development should be extremely limited or should not
take place (OAS 1991).
3. ROLE OF GEOSPATIAL TECHNOLOGIES IN FLOOD MANAGEMENT
An effective flood management program, and all its phases, depends on a wide range of
parameters and large volumes of accurate, relevant, and timely geoinformation. Besides,
geographical data and tools are an absolute necessity if scientific understanding is to be
translated into effective evidence-based and place-based policy (Murphy et al. 2010). As
indicated in the previous section, the required physical information includes topography and
terrain, soil types, watershed/catchments, land cover and forestry, and the intensity of the
triggering factors. Ultimately, flood risk management requires socio-economic data (housing
location, valuation data, demographic structure, census information) as well as land use
information, administrative boundaries, development pressure, and environmental constraints.
However, there is a severe shortage of reliable and compatible data sets generally in the
whole Caribbean region. Information needed for accurate planning is often outdated, non-
existent, or very expensive and time consuming to collect (Al-Tahir et al. 2006). Without
such information, the investigation of flood susceptibility, and the formation of proper
national planning policies in many Caribbean island states will be both difficult and error
prone.
Modern geospatial technologies, especially in the disciplines of photogrammetry, remote
sensing, and spatial information science, can assist in crisis management through observation,
Raid Al-Tahir, Intesar Saeed and Ron Mahabir
mapping, and analysing relevant information in each of the critical disaster management
phases (Altan and Kemper 2010). Geospatial data and tools have a key role in the saving of
lives, the limitation of damage, and the reduction in the costs to society of dealing with
emergencies. Recent improvements in computer software and hardware have allowed remote
sensing and GIS to provide the way forward in collecting and managing relevant data sets,
and in developing management scenarios to evaluate mitigation strategies (Ehlers 2004).
3.1. The Role of GIS
Flooding is a dynamic process and exhibits spatial characteristics in the sense that floods
occur at a particular location at which various contributing factors for the event exist. For
example, typical flood conditions include areas gently sloping or basins, heavy rainfall,
saturated soil and blocked channels (Alkema 2004). The primary function of GIS is to store
and link multiple digital databases and many different themed layers of information,
graphically display that information as maps, and to examine how the layers interrelate. These
layers, such as those depicted in Figure 8.2, would carry the key elements needed for flood
hazard management (GAO 2004). This information may come from many sources, including
remote sensing, GPS, censuses, soil samples, stream gage systems, and weather stations.
Additionally, historical data help in identifying where flood may occur since areas most
commonly flooded are expected to flood again.
Having acquired and stored the required data, GIS based analysis is then conducted to
determine the amount of influence of each of the factors and their impacts in different
scenarios. GIS provides an enabling technology by means of presenting a feasible solution,
providing tools and methods that support all phases of flood management. Specifically, GIS is
used for locating critical and vulnerable assets, planning, mitigation activities, assisting in
response, and aiding in recovery management (Khanna et al. 2006). Table 1 lists various
common applications of GIS in hazard management in general.
Table 8.1. Common applications of GIS in hazard management (Marfai 2003)
Function Potential Applications
Data display • Aid in the analysis of spatial distribution of socio-economic
infrastructure and natural hazard phenomena.
• Use of thematic maps to enhance reports and/or presentations.
• Link with other databases for more specific information.
Land information
storage and
retrieval
Filing, maintaining, and updating land related data (e.g., land ownership,
records of previous natural events, permissible uses, etc.)
Zone and district
management
• Maintain and update district maps, such as zoning of floodplain maps.
• Determine and enforce adequate land-use regulation and building codes
Site selection Identification of potential sites for particular uses
Hazard impact
assessment
Identification of geographically determined hazard impacts
Development/land
suitability
modelling
Analysis of suitability of particular parcels for development.
Applications of Remote Sensing and GIS Technologies in Flood Risk Management 143
Figure 8.2. GIS Layers for Flood Mapping (GAO 2004).
By overlaying or intersecting different spatial layers, flood-prone areas can be identified,
thereby enabling more effective mitigation and response to flooding events. GIS is also used
to present flood-related information visually in 2D or 3D such that it might be more
intuitively understood, particularly by a lay audience. GIS-generated maps provide an
effective means of informing the public or news media on evacuation routes, on the extent
and impact of a flood when it occurs, and on the government’s response efforts (Shanley et al.
2006). This information can be disseminated with the use of web technologies, creating
interactive maps that can be queried and updated in real time, and linked to additional
information.
3.2. The Role of Remote Sensing
Remote sensing is another advancing technology that has benefited flood modelling and
flood risk assessment in providing a cost effective means of acquiring accurate spatial and
temporal data (Khanna et al. 2006). Remote sensing of the environment involves the
measurement of electromagnetic radiation reflected from or emitted by the Earth’s surface
and relating these measurements to the types of land cover and habitat in the area being
observed by the sensor (Al-Tahir et al. 2006). Observing Earth’s surface using sensors on
Raid Al-Tahir, Intesar Saeed and Ron Mahabir
board various space and air platforms has evolved into a multinational enterprise producing a
large amount of digital data on various physical parameters that characterize the earth system
(Murphy et al. 2010).
Remote sensing continues to expand making use of new kinds of sensors that exploit
different parts of the electromagnetic spectrum, and achieve finer levels of spatial, temporal,
or spectral resolution (Murphy et al. 2010). Considerable advances in remote sensing
technology have occurred both in acquiring digital aerial photography and high resolution
satellite data. Parallel to this, new techniques have been developed for improved processing
and extraction of spatial information from these new data sets (Ehlers 2004).
The distinction between aerial photography and satellite remote sensing is based on the
fact that each of them provides some capabilities that cannot be achieved by the other. Such
comparative capabilities include ground coverage, repeatability of observations, spectral
ranges, and geometry for three dimensional mapping (Li 1998). Aerial photo data are of
immense value, especially when long term spatial data is required, such as in the case of
hydrology and flooding (Rango et al. 2008) considering that aerial photography extends back
into the mid 1940s in most of the Caribbean states. Satellites on the other hand have been
around for a much shorter period, with the early images of the earth’s surface collected in the
1970s. The principal advantages in using satellite images stems from their higher spectral
resolution.
Information from earth observation platforms, combined with other relevant data in GIS,
have triggered advancements in flood modelling and demonstrated their utility in providing
historical, recent, and repetitive data for a wide range of applications in disaster management.
Earth observation techniques are used for mapping geomorphologic elements, historical
events and sequential inundation phases, including duration, depth of inundation, and
direction of current to indicate which areas are potentially vulnerable (Altan and Kemper
2010; Van Westen 2002). Moreover, images of an area can be analyzed together with various
land cover input parameters, essential for use and development of hydrological modelling for
risk analysis.
High resolution images offer great opportunities to identify individual structures and
natural features as well as their functions that are important for the assessment of their
vulnerability and value. This is a very critical aspect in monitoring the increasing risks and
impacts of floods, especially for urban areas that experience fast and uncontrolled expansion
into hazardous areas (Alkema 2004). Because of its availability and temporal resolution, high
resolution imagery provides a critical tool for monitoring floods before, during and after the
event, supporting a much more in depth analysis of the hazard and hydrological models.
Digital elevation model (DEM) (or alternatively, digital terrain model; DTM) is essential
for flood management and hydrological modelling. DEM is used for deriving critical
information sets such as possible sinks, flow direction, and rate of flow of floods. Such data is
yet another data set that can only be provided effectively by remote sensing. Aerial surveys
using airborne cameras and/or airborne LIDAR sensors are able to deliver a high density
digital terrain model. DEM can also be extracted from space- borne sources such as satellite
stereo images of SPOT, or radar data such as those collected by the Shuttle Radar Terrain
Measurement (SRTM) data. Using DEM in combination with other data in a GIS analysis
basin boundary, drainage network, area, and elevation can be extracted, and risk estimations
can be carried out (Badilla 2008). The resolution of the DEM is critical since this will dictate
the smallest structural features (e.g. rivers) that can be reconstructed (Alkema 2004).
Applications of Remote Sensing and GIS Technologies in Flood Risk Management 145
4. APPLICATIONS OF INTEGRATED GEOSPATIAL TECHNOLOGIES IN
FLOOD RISK MANAGEMENT
The following sections will review some specific cases where remote sensing and GIS
have provided the tools for data collection and analysis in support of pre-disaster
preparedness programs, in-disaster response activities, and post-disaster reconstruction.
4.1. Disaster Mitigation and Preparedness
The most promising application of remote sensing is its use for risk analysis as a function
of hazard and vulnerability assessments. The mapping of areas affected by floods is essential
for both planning and the assessment of incurred damages as a result of the disaster.
Achieving this will require mapping flooded areas before and after flood waters recede.
Satellite and aerial remote sensing provides a suitable alternative to traditional field surveying
techniques for producing flood inundation maps. Besides, they offer the possibility of
validating the output of developed models by comparing the observed extent of the flood with
the modelled prediction (Alkema 2004; Wilson and Atkinson 2003).
Due to its advantageous synoptic view of the hazard, geospatial imagery can be added
into the GIS as a layer after being georeferenced. The extent of flooding is then delineated
and further superimposed onto additional spatial variables for analysis. Also, images
representing the extent of flooding can be collected at different time intervals in order to
monitor both the progression and recession of the flood inundation within a short period of
time which can be used for planning and organizing mitigation or response operations
effectively (Khanna et al. 2006).
Flood susceptibility mapping and risk area delineation is another task that can benefit
from an integrated use of GIS and remote sensing. In a study carried out in Malaysia, a GIS
and remote sensing-based flood susceptibility model was prepared using the known extent of
flooded areas (Pradhan 2009). Historical flooded areas extracted from RADARSAT images,
and terrain characteristics extracted from the DEM (e.g., slope, aspect, flow direction), soil,
soil texture, land cover, and precipitation information were updated to enable the
quantification of flood associated attributes. A flood susceptibility map was then produced
using a logistic regression model that assessed all these factors.
Most studies typically assess flood risks purely in terms of economic damage while
neglecting the social and economic impacts, leaving the map to assess the risk.
One may face a challenging task when incorporating several factors in identifying both
potential areas to be flooded and the associated level of risk should the hazard be realized.
This becomes an issue of concern since different factors exert different levels of influence
based on present situation and their interactions within the environment. In this event weights
must be given to the different criteria for indicating the level of impact that each risk criterion
has on flooding. In studies by Meyer et al. (2009) and Wallingford (2007), a multi-criteria
approach towards flood-risk management is given. GIS provides an optimum environment for
providing different possibilities for multi-criteria analysis of spatial problems such as floods.
Hydrological models are used as another approach in flood hazard mapping in parallel
with the use of historical events as the main indicator. A study by Kafle et al. (2006)
Raid Al-Tahir, Intesar Saeed and Ron Mahabir
integrated flood simulation modelling with remote sensing and GIS data for flood hazard
mapping in the Baghmati River, Nepal. Dry season satellite images were used to update the
existing land use map in the flood affected areas. Following this, a hydrologic model was
developed in combination with a digital elevation model, and was used for delineating the
inundation area extent, and estimating the flood depths in areas where images capturing the
peak flood events were not available. Consequently, flood hazard maps were prepared for a
50-year flood followed by designing a flood-hazard ranking system by combining flood
extent, flood depth, land-use types and population. A specific large segment of the river bank
was subsequently identified as the main spilling reach for structural countermeasures (Kafle
et al. 2006).
It is evident from all previous discussions that digital elevation model (DEM) plays a
very essential role in hydraulic models and risk analysis. As such, several studies have
focused on the varying means for acquiring elevation data, and the impact of their resolution
and accuracy on the analysis. Such a study was conducted by Wilson and Atkinson (2003) for
the use of LiDAR, stereo photogrammetry, and ERS interferometric SAR (InSAR) elevation
data for flood inundation modelling. Each dataset was used to predict flood inundation for a
60 day event during a series of major flooding of the Avon River, England, that occurred in
autumn 2000. Predictions using each elevation dataset were then compared to aerial
photography of the flooding acquired close to the flood peak. The most accurate prediction of
inundation was obtained using the LiDAR data (after the removal of above surface features),
followed by photogrammetric data (Wilson and Atkinson 2003).
In another study, concerns over the suitability of using a coarse resolution of DEM (50
metre) to reconstruct small structural features of small rivers, especially those with narrow
banks like Onga River on Kyushu Island in Japan were investigated (Mori 2007). To achieve
the goals for this study, a 2-meter meshed DEM was generated using the airborne laser
system with a vertical resolution of 0.1 metre. For estimating flooded areas around the Onga
River, 3D topographic maps and 1-meter contour lines were created using the DEM data in
the GIS system. The study concluded that the higher resolution DEM was the key for
providing precise water levels and, hence, more accurate estimations of the flooded area.
4.2. During and Post-Disaster Applications
During the event of flooding, the integrated use of remote sensing and GIS has been
effectively applied in issuing warnings (such as cyclone tracking), appraising the extent of
damage, and providing alternative evacuation routes during rescue and relief efforts.
Developed evacuation plans need to be rapidly updated in response to new images and
information over the affected population as well as the damaged routes and shelters. Figure
8.3 depicts such a GIS and remote sensing approach to dynamic response to a disaster. Such
an approach, though, depends on a rich source of accurate and up-to-date GIS and auxiliary
data, and satellite imagery. In some cases particular resources, including human and
technology needed to execute the system may not be available due to either financial
limitations or lack of political will. Such is usually the case for developing countries.
Applications of Remote Sensing and GIS Technologies in Flood Risk Management 147
Figure 8 3. GIS evacuation plan (Naghdi et al. 2008).
One example in this respect is the island of Haiti where in January 2010 an earthquake of
magnitude 7.0 struck resulting in massive destruction to property and killing over 100,000
persons. Relief efforts would have failed if not for the quick thinking of government and
private organizations worldwide making available vast amounts of up-to-date mid- to high-
resolution satellite imagery of the island. Using these images, relief organizations were able
to better plan their routes using visual analysis as well as integrated GIS technologies and
become more effective in their approach.
The technologies of remote sensing and also GIS play a critical role in the post-disaster
and rehabilitation phase. In addition to offering rapid flood monitoring and assessment,
satellite images of real flood events and information from the ground are useful for actual
flood damage assessment, future flood mitigation planning, and validation of hydraulic
analysis (Altan and Kemper 2010).
Such an integrated approach was used in the city of Muscat, Oman that was hit by a
cyclone (Azaz 2007). GIS and satellite images were used to organize the damage information
and the post-disaster census information, in addition to evaluating sites for reconstruction. In
this study, two high-resolution satellite images (IKONOS) were utilized; one image before
the cyclone and one after. The two images were geometrically corrected, and a change
detection technique was then applied to identify and assess the damage (Azaz 2007).
Another study developed a methodology to combine the spectral, spatial and contextual
information captured by IKONOS images to produce an accurate property damage map after
flooding that affected villages in the southern part of the Netherlands in 1995 (van der Sande
et al. 2003). The detailed land cover map, water depth, and known relations between water
depth and property damage were all contributed to the creation of this map. The study
confirmed that maps derived from high spatial resolution geospatial imagery are most
accurate for flood simulations and actual property damage assessment (van der Sande et al.
2003).
Raid Al-Tahir, Intesar Saeed and Ron Mahabir
The results of the two previous studies emphasize the importance of using remote sensing
and GIS in the damage assessment phase as part of an effective disaster management plan.
However, there is usually an overwhelming cloud cover in the aftermath of a flood,
particularly in the Caribbean islands. Thus, it is very difficult to obtain clear satellite image in
the visible and near infared region. Having the capability to penetrate clouds and rain, radar
images would thus be a better alternative in such cases. In fact, radar imagery was utilized to
promptly obtain flood extent and assess flood damage in aftermath of the flood disaster in
China along Changjiang River in 1998 (Yang et al. 2002). A RADARSAT image obtained
after the flood was used for determining the flood extent while optical satellite images
(LANDSAT) were used to provide the land cover status before the flood.
5. CONCLUSION
Flooding is the most common and most predominantly occurring geohazard in today’s
world. It accounts for a substantial proportion of human and economic distress with both
direct and indirect impacts. Management of flood disaster can be successful only when
detailed knowledge is obtained about the character and magnitude of the flood as well as the
vulnerability of the people, residential properties, infrastructure, agricultural crops, and
economic activities in the potentially vulnerable area.
This chapter has presented the use of Earth observation and Geographic Information
Systems as enabling technologies for assisting in a comprehensive disaster management
system. Having reviewed several cases for their applications, these technologies have
emerged as powerful tools for dealing with various aspects of flood prevention, preparedness,
relief, and recovery efforts of flood disaster.
Earth observation and GIS techniques can significantly contribute to improving the
efforts in modelling flood events, developing proper flood-mitigation strategies, and
providing relevant agencies with important information for alleviating flood damage. They
can supplement or complement other structural and non-structural measures in flood
management systems. Extensive use of these technologies can prospectively create long term
databases on flood proneness, risk assessment and relief management.
REFERENCES
Alkema, D. (2004). RS and GIS applications in flood forecasting. Proceedings of the
National Workshop on Flood Disaster Management: Space Inputs. India. 57-59.
Al-Tahir, R., Baban, S. & Ramlal, B. (2006). Utilizing emerging geo-imaging technologies
for the management of tropical coastal environments. West Indian Journal of
Engineering, 29 (1), 11-21.
Altan, O. & Kemper G. (2010). Spatial Information for disaster management using examples
from Istanbul. In M. Konecny et al. (eds.), Geographic Information and Cartography for
Risk and Crisis Management, Lecture Notes in Geoinformation and Cartography,
Springer-Verlag Berlin.
Applications of Remote Sensing and GIS Technologies in Flood Risk Management 149
Azaz, L. (2007). Using remote sensing and GIS for damage assessment after flooding, the
case of Muscat, Oman after Gonu tropical cyclone: Urban planning perspective.
Proceedings of 15th International Conference on Urban Planning and Regional
Development in the Information Society. Vienna, http://programm.corp.at/cdrom2010/
papers2010/CORP2010_182.pdf
Badilla, R. A. (2008). Flood Modelling in Pasig-Marikina River Basin. Thesis. International
Institute for Geo-Information Science and Earth Observation, Netherlands.
Ehlers, M. (2004). Remote sensing for GIS applications: New sensors and analysis methods.
In Ehlers, M., Kaufmann, H., and Michel (eds.), Remote Sensing for Environmental
Monitoring, GIS Applications, and Geology III, Proc. of SPIE, Vol. 5239, 1-13.
Few, R., Ahern, M., Matthies, F. & Kovats, S. (2004). Floods, Health and Climate Change: A
Strategic Review. Tyndall Centre Working Paper 63.
Hoyois, P. & Guha-Sapir, D. (2004). Disasters caused by flood: Preliminary data for a 30
year assessment of their occurrence and human impact. Health and Flood Risk Workshop.
University of East Anglia. UK. http://www.em-dat.net/documents/working_paper/
30yearsoffloods3.pdf
Johnson, R. (2000). GIS Technology for Disasters and Emergency Management. ESRI White
Paper. ESRI.
Kafle T., Hazarika, M., Shrestha, K., Prathumchai, K. & Samarakoon, L. (2006). Integration
of remote sensing and GIS with flood simulation model for flood hazard mapping in the
Bagmati River, Nepal. Proceedings of the 5th
International Symposium on New
Technologies for Urban Safety of Mega Cities in Asia, Phuket, Thailand.
Khanna, R. K., Agrawal, C. K. & Kumar, P. (2006). Remote Sensing and GIS applications in
flood management. Proceedings of the India Disaster Management Congress, New
Delhi. pp. 11.
Li, R. (1998). Potential of high-resolution satellite imagery for national mapping products.
Photogrammetric Engineering and Remote Sensing, 64(12), 1165-1169.
Mansor, S., Abu Shariah, M., Billa, L., Setiawan, I. & Jabar, F. (2004). Spatial technology for
natural risk management. Disaster Prevention and Management. Volume 13, Number 5,
364-373.
Marfai, M.A. (2003). GIS Modelling of River and Tidal Flood Hazards in a Waterfront City.
Case study: Semarang City, Central Java, Indonesia. MSc. Thesis, International Institute
for Geo-Information Science and Earth Observation, Netherlands. Available online:
http://www.itc.nl/Pub/Home/library/Academic_output (Last accessed on 10 May 2010)
Meyer, V., Haase, D. & Scheuer, S. (2009). A Multicriteria Flood Risk Assessment and
Mapping Approach. In: Flood Risk Management: Research and Practice. Allsop, W.,
Samuels, P., Harrop, J. and Huntington, S. (Editors). Taylor and Francis Group, London,
pp. 1687-1693.
Mori, M. (2007). GIS analysis of river flooding by high-resolution (2m) DEM. Proceedings
of the Annual Conference of the Remote Sensing &Photogrammetry Society. Newcastle
upon Tyne. UK
Murphy, A., Colleton, N., Downs, R., Goodchild, M., Hanson, S., Lawson, V., Macdonald,
G., Magilligan, F., Moseley, W., Polsky, C., Seto, K. & Wright, D. (2010).
Understanding the Changing Planet: Strategic Directions for the Geographical Sciences.
National Research Council. The National Academies Press. Washington, D.C.
Raid Al-Tahir, Intesar Saeed and Ron Mahabir
Naghdi, K., Mansourian, A., Valadanzoej, M. & Saadatseresht, M. (2008). Evacuation
planning in earthquake disasters using RS & GIS. The International Archives of the
Photogrammetry, Remote Sensing and Spatial Information Sciences. Vol. XXXVII. Part
B4. pp. 1671-1676
Organization of American States (OAS) (1991). Primer on Natural Hazard Management in
Integrated Regional Development Planning. Organization of American States,
Washington, D.C. http://www.oas.org/osde/publications/Unit/oea66e/begin.htm.
Plate, E. J. (2007). Flood Risk Management for Setting Priorities in Decision Making. In:
Extreme Hydrological Events: New Concepts for Security. Vasiliev, O.F., Van Gelder,
P.H.A.J.M., Plate, E.J. and Bolgov, M.V. (eds). Vol. 78, part 1, Springer Netherlands,
New York, 21-44.
Pradhan, B. (2009). Flood susceptible mapping and risk area delineation using logistic
regression, GIS and remote sensing. Journal of Spatial Hydrology. Vol. 9, No.2, 1-18.
Ramlal, B. & Baban, S. (2008). Developing a GIS based integrated approach to flood
management in Trinidad, West Indies. Journal of Environmental Management, 88 (4),
1131–1140.
Rango, A., Laliberte A. & Winters, C. (2008). Role of aerial photos in compiling a long-term
remote sensing data set. J. Appl. Remote Sens., Vol. 2, Issue 1
Shanley, L. A., Bellovary, T., Lulloff, A. & Schwoegler-Boos, P. A. L. (2006). GIS Data
Sharing and Flood Hazards in Wisconsin. Wisconsin Land Information Association,
Wisconsin. Available online: www.wlia.org/resources/datasharingfloods.pdf. Last
accessed 15 May 2010.
United States General Accounting Office (GAO) (2004). Flood Map Modernization. Report
GAO-04-417. http://www.gao.gov/cgi-bin/getrpt?GAO-04-417.
USGS. (2007). Science Topics. Floods. The United States Geological Survey. Available
online: http://www.usgs.gov/ (Last accessed on 25 April 2010).
van der Sande, C. J., de Jong, S. M. & de Roo A. P. J. (2003). A segmentation and
classification approach of IKONOS-2 imagery for land cover mapping to assist flood risk
and flood damage assessment. International Journal of Applied Earth Observation and
Geoinformation, Volume 4, Issue 3, Pages 217-229
Van Westen, C. J. (2002). Remote Sensing and GIS for natural disaster management. In A.
Skidmore (ed.), Environmental Modelling with GIS and Remote Sensing. Taylor &
Francis, London.
Wallingford, H. R. (2007). GIS-based Multicriteria Analysis as Decision Support in Flood
Risk Management. Report number T10-07-07, FLOODsite Consortium, UK. Available
on: www.floodsite.net (Last accessed on 25 April 2010)
Wilson, M. D. & Atkinson, P. M. (2003). A comparison of remotely sensed elevation data
sets for flood inundation modelling. Proceedings 7th
International Conference on
GeoComputation, Southampton, UK (on CD-ROM).
World Water Assessment Programme (WWAP) (2006). The 2nd
UN World Water
Development Report: Water, a Shared Responsibility. UNESCO and Berghahn Books.
Paris and New York.
Yang, C., Huang, H., Wei, Y., Zhu H. & Zhuo, J. (2002). Rapidly Assessing the Flood
Disaster by Using Remote Sensing and GIS. Proc. of IGARSS, Canada, 2880-2882.

More Related Content

What's hot

Role of GIS and remote sensing in Disaster Management
  Role of GIS and remote sensing in Disaster Management  Role of GIS and remote sensing in Disaster Management
Role of GIS and remote sensing in Disaster ManagementLeema Margret A
 
Flood risk mapping using GIS and remote sensing and SAR
Flood risk mapping using GIS and remote sensing and SARFlood risk mapping using GIS and remote sensing and SAR
Flood risk mapping using GIS and remote sensing and SARRohan Tuteja
 
Energy interaction with earth surface features
Energy interaction with earth surface featuresEnergy interaction with earth surface features
Energy interaction with earth surface featuressuchismita11
 
Application of GIS and RS in Watershed Management
Application of GIS and RS in Watershed ManagementApplication of GIS and RS in Watershed Management
Application of GIS and RS in Watershed Managementholegajendra
 
Disaster management using Remote sensing and GIS
Disaster management using Remote sensing and GISDisaster management using Remote sensing and GIS
Disaster management using Remote sensing and GISHarsh Singh
 
APPLICATION OF SCIENCE AND TECHNOLOGY FOR DISASTER MANAGEMENT & MITIGATION
APPLICATION OF SCIENCE AND TECHNOLOGY FOR DISASTER MANAGEMENT & MITIGATIONAPPLICATION OF SCIENCE AND TECHNOLOGY FOR DISASTER MANAGEMENT & MITIGATION
APPLICATION OF SCIENCE AND TECHNOLOGY FOR DISASTER MANAGEMENT & MITIGATIONAditya Mistry
 
drought monitoring and management using remote sensing
drought monitoring and management using remote sensingdrought monitoring and management using remote sensing
drought monitoring and management using remote sensingveerendra manduri
 
Natural Hazards & ROLE of satellite remote sensing
Natural Hazards & ROLE of satellite remote sensingNatural Hazards & ROLE of satellite remote sensing
Natural Hazards & ROLE of satellite remote sensingABU UMEER BANBHAN
 
landslides resilient planning ppt
landslides resilient planning pptlandslides resilient planning ppt
landslides resilient planning pptarharshit
 
Land use and land cover classification
Land use and land cover classification Land use and land cover classification
Land use and land cover classification Calcutta University
 
LANDSLIDE HAZARD ZONATION MAPPING USING RS AND GIS
LANDSLIDE HAZARD ZONATION MAPPING USING RS AND GISLANDSLIDE HAZARD ZONATION MAPPING USING RS AND GIS
LANDSLIDE HAZARD ZONATION MAPPING USING RS AND GISAditya Ghumare
 
Flood vulnerability and risk mapping
Flood vulnerability and risk mappingFlood vulnerability and risk mapping
Flood vulnerability and risk mappingkunalsahu9883
 
Drought management
Drought managementDrought management
Drought managementvivek gami
 
Bangladesh Climate Vulnerability: Floods and Cyclones
Bangladesh Climate Vulnerability: Floods and CyclonesBangladesh Climate Vulnerability: Floods and Cyclones
Bangladesh Climate Vulnerability: Floods and Cyclones2020resilience
 

What's hot (20)

Role of GIS and remote sensing in Disaster Management
  Role of GIS and remote sensing in Disaster Management  Role of GIS and remote sensing in Disaster Management
Role of GIS and remote sensing in Disaster Management
 
Flood risk mapping using GIS and remote sensing and SAR
Flood risk mapping using GIS and remote sensing and SARFlood risk mapping using GIS and remote sensing and SAR
Flood risk mapping using GIS and remote sensing and SAR
 
Energy interaction with earth surface features
Energy interaction with earth surface featuresEnergy interaction with earth surface features
Energy interaction with earth surface features
 
Application of GIS and RS in Watershed Management
Application of GIS and RS in Watershed ManagementApplication of GIS and RS in Watershed Management
Application of GIS and RS in Watershed Management
 
Disaster management using Remote sensing and GIS
Disaster management using Remote sensing and GISDisaster management using Remote sensing and GIS
Disaster management using Remote sensing and GIS
 
APPLICATION OF SCIENCE AND TECHNOLOGY FOR DISASTER MANAGEMENT & MITIGATION
APPLICATION OF SCIENCE AND TECHNOLOGY FOR DISASTER MANAGEMENT & MITIGATIONAPPLICATION OF SCIENCE AND TECHNOLOGY FOR DISASTER MANAGEMENT & MITIGATION
APPLICATION OF SCIENCE AND TECHNOLOGY FOR DISASTER MANAGEMENT & MITIGATION
 
drought monitoring and management using remote sensing
drought monitoring and management using remote sensingdrought monitoring and management using remote sensing
drought monitoring and management using remote sensing
 
Natural Hazards & ROLE of satellite remote sensing
Natural Hazards & ROLE of satellite remote sensingNatural Hazards & ROLE of satellite remote sensing
Natural Hazards & ROLE of satellite remote sensing
 
Landslide disaster management
Landslide disaster managementLandslide disaster management
Landslide disaster management
 
landslides resilient planning ppt
landslides resilient planning pptlandslides resilient planning ppt
landslides resilient planning ppt
 
Visual Interpretation
Visual InterpretationVisual Interpretation
Visual Interpretation
 
Digital Elevation Model (DEM)
Digital Elevation Model (DEM)Digital Elevation Model (DEM)
Digital Elevation Model (DEM)
 
Land use and land cover classification
Land use and land cover classification Land use and land cover classification
Land use and land cover classification
 
72.gis in water resources
72.gis in water resources72.gis in water resources
72.gis in water resources
 
LANDSLIDE HAZARD ZONATION MAPPING USING RS AND GIS
LANDSLIDE HAZARD ZONATION MAPPING USING RS AND GISLANDSLIDE HAZARD ZONATION MAPPING USING RS AND GIS
LANDSLIDE HAZARD ZONATION MAPPING USING RS AND GIS
 
Flood vulnerability and risk mapping
Flood vulnerability and risk mappingFlood vulnerability and risk mapping
Flood vulnerability and risk mapping
 
Drought management
Drought managementDrought management
Drought management
 
Flood Management
Flood ManagementFlood Management
Flood Management
 
Bangladesh Climate Vulnerability: Floods and Cyclones
Bangladesh Climate Vulnerability: Floods and CyclonesBangladesh Climate Vulnerability: Floods and Cyclones
Bangladesh Climate Vulnerability: Floods and Cyclones
 
Land cover and Land Use
Land cover and Land UseLand cover and Land Use
Land cover and Land Use
 

Similar to APPLICATIONS OF REMOTE SENSING AND GIS TECHNOLOGIES IN FLOOD RISK MANAGEMENT

Policy and disaster risk reduction
Policy and disaster risk reductionPolicy and disaster risk reduction
Policy and disaster risk reductionfreelance
 
UP691938 FInished Report
UP691938 FInished ReportUP691938 FInished Report
UP691938 FInished ReportKatie Acton
 
Strategies for natural disastger management and mitigation paper - copy
Strategies for natural disastger management and mitigation  paper - copyStrategies for natural disastger management and mitigation  paper - copy
Strategies for natural disastger management and mitigation paper - copyJIT KUMAR GUPTA
 
Flood Vulnerable Area Assessment of Abakaliki Metropolis South-eastern Nigeria.
Flood Vulnerable Area Assessment of Abakaliki Metropolis South-eastern Nigeria.Flood Vulnerable Area Assessment of Abakaliki Metropolis South-eastern Nigeria.
Flood Vulnerable Area Assessment of Abakaliki Metropolis South-eastern Nigeria.IJERA Editor
 
GEOGRAPHY UNIT 1 Module 3 natural events and hazards. section 5 response to ...
GEOGRAPHY UNIT 1 Module 3  natural events and hazards. section 5 response to ...GEOGRAPHY UNIT 1 Module 3  natural events and hazards. section 5 response to ...
GEOGRAPHY UNIT 1 Module 3 natural events and hazards. section 5 response to ...Liam Nabbal
 
AUVSI 2012 - Natural Disasters: A Future View in the Use of RPAS
AUVSI 2012 - Natural Disasters: A Future View in the Use of RPASAUVSI 2012 - Natural Disasters: A Future View in the Use of RPAS
AUVSI 2012 - Natural Disasters: A Future View in the Use of RPASLaura Samsó, MSc
 
A Review Of Flood Risk Assessment
A Review Of Flood Risk AssessmentA Review Of Flood Risk Assessment
A Review Of Flood Risk AssessmentChristine Maffla
 
Climate Change Adaptation and Masnaging Extreme Events
Climate Change Adaptation and Masnaging Extreme EventsClimate Change Adaptation and Masnaging Extreme Events
Climate Change Adaptation and Masnaging Extreme Eventsipcc-media
 
detection and ranking of vulnerable areas to urban flooding using gis and asm...
detection and ranking of vulnerable areas to urban flooding using gis and asm...detection and ranking of vulnerable areas to urban flooding using gis and asm...
detection and ranking of vulnerable areas to urban flooding using gis and asm...INFOGAIN PUBLICATION
 
Normalising the Crisis_Rokon
Normalising the Crisis_RokonNormalising the Crisis_Rokon
Normalising the Crisis_RokonRedwan B Rokon
 
A Review Paper on Coastal Hazard
A Review Paper on Coastal HazardA Review Paper on Coastal Hazard
A Review Paper on Coastal HazardIJERA Editor
 
Disaster Management Empirical Study of 2009 Jeddah Flood
Disaster Management Empirical Study of 2009 Jeddah FloodDisaster Management Empirical Study of 2009 Jeddah Flood
Disaster Management Empirical Study of 2009 Jeddah Floodnabaz4u
 
Housing vulnerability, resilience and adaptation strategies to flood hazard a...
Housing vulnerability, resilience and adaptation strategies to flood hazard a...Housing vulnerability, resilience and adaptation strategies to flood hazard a...
Housing vulnerability, resilience and adaptation strategies to flood hazard a...Alexander Decker
 
Module 6_Vulnerability_L&D_DRR.pptx
Module 6_Vulnerability_L&D_DRR.pptxModule 6_Vulnerability_L&D_DRR.pptx
Module 6_Vulnerability_L&D_DRR.pptxSahilRam5
 
. Schuster Range extended abstract IDRC2016_final
. Schuster Range extended abstract IDRC2016_final. Schuster Range extended abstract IDRC2016_final
. Schuster Range extended abstract IDRC2016_finalSandra Schuster
 
Toward Greater Hazard Resilience in a Changing World
Toward Greater Hazard Resilience in a Changing WorldToward Greater Hazard Resilience in a Changing World
Toward Greater Hazard Resilience in a Changing WorldOregon Sea Grant
 
англ измDisaster medicine
англ измDisaster medicineангл измDisaster medicine
англ измDisaster medicineAdnanZaaba
 
GE8071 Unit 5 - DISASTER MANAGEMENT FOR FWT.
GE8071 Unit 5 - DISASTER MANAGEMENT FOR FWT.GE8071 Unit 5 - DISASTER MANAGEMENT FOR FWT.
GE8071 Unit 5 - DISASTER MANAGEMENT FOR FWT.GogulPrasathRamachan1
 
CURRENT TRENDS DISASTER MGT.pptx
CURRENT TRENDS DISASTER MGT.pptxCURRENT TRENDS DISASTER MGT.pptx
CURRENT TRENDS DISASTER MGT.pptxArunaMano2
 

Similar to APPLICATIONS OF REMOTE SENSING AND GIS TECHNOLOGIES IN FLOOD RISK MANAGEMENT (20)

A440111.pdf
A440111.pdfA440111.pdf
A440111.pdf
 
Policy and disaster risk reduction
Policy and disaster risk reductionPolicy and disaster risk reduction
Policy and disaster risk reduction
 
UP691938 FInished Report
UP691938 FInished ReportUP691938 FInished Report
UP691938 FInished Report
 
Strategies for natural disastger management and mitigation paper - copy
Strategies for natural disastger management and mitigation  paper - copyStrategies for natural disastger management and mitigation  paper - copy
Strategies for natural disastger management and mitigation paper - copy
 
Flood Vulnerable Area Assessment of Abakaliki Metropolis South-eastern Nigeria.
Flood Vulnerable Area Assessment of Abakaliki Metropolis South-eastern Nigeria.Flood Vulnerable Area Assessment of Abakaliki Metropolis South-eastern Nigeria.
Flood Vulnerable Area Assessment of Abakaliki Metropolis South-eastern Nigeria.
 
GEOGRAPHY UNIT 1 Module 3 natural events and hazards. section 5 response to ...
GEOGRAPHY UNIT 1 Module 3  natural events and hazards. section 5 response to ...GEOGRAPHY UNIT 1 Module 3  natural events and hazards. section 5 response to ...
GEOGRAPHY UNIT 1 Module 3 natural events and hazards. section 5 response to ...
 
AUVSI 2012 - Natural Disasters: A Future View in the Use of RPAS
AUVSI 2012 - Natural Disasters: A Future View in the Use of RPASAUVSI 2012 - Natural Disasters: A Future View in the Use of RPAS
AUVSI 2012 - Natural Disasters: A Future View in the Use of RPAS
 
A Review Of Flood Risk Assessment
A Review Of Flood Risk AssessmentA Review Of Flood Risk Assessment
A Review Of Flood Risk Assessment
 
Climate Change Adaptation and Masnaging Extreme Events
Climate Change Adaptation and Masnaging Extreme EventsClimate Change Adaptation and Masnaging Extreme Events
Climate Change Adaptation and Masnaging Extreme Events
 
detection and ranking of vulnerable areas to urban flooding using gis and asm...
detection and ranking of vulnerable areas to urban flooding using gis and asm...detection and ranking of vulnerable areas to urban flooding using gis and asm...
detection and ranking of vulnerable areas to urban flooding using gis and asm...
 
Normalising the Crisis_Rokon
Normalising the Crisis_RokonNormalising the Crisis_Rokon
Normalising the Crisis_Rokon
 
A Review Paper on Coastal Hazard
A Review Paper on Coastal HazardA Review Paper on Coastal Hazard
A Review Paper on Coastal Hazard
 
Disaster Management Empirical Study of 2009 Jeddah Flood
Disaster Management Empirical Study of 2009 Jeddah FloodDisaster Management Empirical Study of 2009 Jeddah Flood
Disaster Management Empirical Study of 2009 Jeddah Flood
 
Housing vulnerability, resilience and adaptation strategies to flood hazard a...
Housing vulnerability, resilience and adaptation strategies to flood hazard a...Housing vulnerability, resilience and adaptation strategies to flood hazard a...
Housing vulnerability, resilience and adaptation strategies to flood hazard a...
 
Module 6_Vulnerability_L&D_DRR.pptx
Module 6_Vulnerability_L&D_DRR.pptxModule 6_Vulnerability_L&D_DRR.pptx
Module 6_Vulnerability_L&D_DRR.pptx
 
. Schuster Range extended abstract IDRC2016_final
. Schuster Range extended abstract IDRC2016_final. Schuster Range extended abstract IDRC2016_final
. Schuster Range extended abstract IDRC2016_final
 
Toward Greater Hazard Resilience in a Changing World
Toward Greater Hazard Resilience in a Changing WorldToward Greater Hazard Resilience in a Changing World
Toward Greater Hazard Resilience in a Changing World
 
англ измDisaster medicine
англ измDisaster medicineангл измDisaster medicine
англ измDisaster medicine
 
GE8071 Unit 5 - DISASTER MANAGEMENT FOR FWT.
GE8071 Unit 5 - DISASTER MANAGEMENT FOR FWT.GE8071 Unit 5 - DISASTER MANAGEMENT FOR FWT.
GE8071 Unit 5 - DISASTER MANAGEMENT FOR FWT.
 
CURRENT TRENDS DISASTER MGT.pptx
CURRENT TRENDS DISASTER MGT.pptxCURRENT TRENDS DISASTER MGT.pptx
CURRENT TRENDS DISASTER MGT.pptx
 

More from rsmahabir

A Critical Review of High and Very High-Resolution Remote Sensing Approaches ...
A Critical Review of High and Very High-Resolution Remote Sensing Approaches ...A Critical Review of High and Very High-Resolution Remote Sensing Approaches ...
A Critical Review of High and Very High-Resolution Remote Sensing Approaches ...rsmahabir
 
Impact of road networks on the distribution of dengue fever cases in Trinidad...
Impact of road networks on the distribution of dengue fever cases in Trinidad...Impact of road networks on the distribution of dengue fever cases in Trinidad...
Impact of road networks on the distribution of dengue fever cases in Trinidad...rsmahabir
 
The Rabies Epidemic in Trinidad of 1923 to 1937: An Evaluation with a Geograp...
The Rabies Epidemic in Trinidad of 1923 to 1937: An Evaluation with a Geograp...The Rabies Epidemic in Trinidad of 1923 to 1937: An Evaluation with a Geograp...
The Rabies Epidemic in Trinidad of 1923 to 1937: An Evaluation with a Geograp...rsmahabir
 
The Role of Spatial Data Infrastructure in the Management of Land Degradation...
The Role of Spatial Data Infrastructure in the Management of Land Degradation...The Role of Spatial Data Infrastructure in the Management of Land Degradation...
The Role of Spatial Data Infrastructure in the Management of Land Degradation...rsmahabir
 
Advancing the Use of Earth Observation Systems for the Assessment of Sustaina...
Advancing the Use of Earth Observation Systems for the Assessment of Sustaina...Advancing the Use of Earth Observation Systems for the Assessment of Sustaina...
Advancing the Use of Earth Observation Systems for the Assessment of Sustaina...rsmahabir
 
Dengue Fever Epidemiology and Control in the Caribbean: A Status Report (2012)
Dengue Fever Epidemiology and Control in the Caribbean: A Status Report (2012)Dengue Fever Epidemiology and Control in the Caribbean: A Status Report (2012)
Dengue Fever Epidemiology and Control in the Caribbean: A Status Report (2012)rsmahabir
 
Healthy Food Accessibility and Obesity: Case Study of Pennsylvania, USA
Healthy Food Accessibility and Obesity: Case Study of Pennsylvania, USAHealthy Food Accessibility and Obesity: Case Study of Pennsylvania, USA
Healthy Food Accessibility and Obesity: Case Study of Pennsylvania, USArsmahabir
 
Exploratory space-time analysis of dengue incidence in trinidad: a retrospect...
Exploratory space-time analysis of dengue incidence in trinidad: a retrospect...Exploratory space-time analysis of dengue incidence in trinidad: a retrospect...
Exploratory space-time analysis of dengue incidence in trinidad: a retrospect...rsmahabir
 
Remote sensing-derived national land cover land use maps: a comparison for Ma...
Remote sensing-derived national land cover land use maps: a comparison for Ma...Remote sensing-derived national land cover land use maps: a comparison for Ma...
Remote sensing-derived national land cover land use maps: a comparison for Ma...rsmahabir
 
Comparison and integration of spaceborne optical and radar data for mapping i...
Comparison and integration of spaceborne optical and radar data for mapping i...Comparison and integration of spaceborne optical and radar data for mapping i...
Comparison and integration of spaceborne optical and radar data for mapping i...rsmahabir
 
Radar and optical remote sensing data evaluation and fusion; a case study for...
Radar and optical remote sensing data evaluation and fusion; a case study for...Radar and optical remote sensing data evaluation and fusion; a case study for...
Radar and optical remote sensing data evaluation and fusion; a case study for...rsmahabir
 
VDIS: A System for Morphological Detection and Identification of Vehicles in ...
VDIS: A System for Morphological Detection and Identification of Vehicles in ...VDIS: A System for Morphological Detection and Identification of Vehicles in ...
VDIS: A System for Morphological Detection and Identification of Vehicles in ...rsmahabir
 
Climate Change and Forest Management: Adaptation of Geospatial Technologies
Climate Change and Forest Management: Adaptation of Geospatial TechnologiesClimate Change and Forest Management: Adaptation of Geospatial Technologies
Climate Change and Forest Management: Adaptation of Geospatial Technologiesrsmahabir
 
Black holes no more the emergence of volunteer geographic information
Black holes no more  the emergence of volunteer geographic informationBlack holes no more  the emergence of volunteer geographic information
Black holes no more the emergence of volunteer geographic informationrsmahabir
 
An evaluation of Radarsat-2 individual and combined image dates for land use/...
An evaluation of Radarsat-2 individual and combined image dates for land use/...An evaluation of Radarsat-2 individual and combined image dates for land use/...
An evaluation of Radarsat-2 individual and combined image dates for land use/...rsmahabir
 
Radar speckle reduction and derived texture measures for land cover/use class...
Radar speckle reduction and derived texture measures for land cover/use class...Radar speckle reduction and derived texture measures for land cover/use class...
Radar speckle reduction and derived texture measures for land cover/use class...rsmahabir
 
Coral Reefs: Challenges, Opportunities and Evolutionary Strategies for Surviv...
Coral Reefs: Challenges, Opportunities and Evolutionary Strategies for Surviv...Coral Reefs: Challenges, Opportunities and Evolutionary Strategies for Surviv...
Coral Reefs: Challenges, Opportunities and Evolutionary Strategies for Surviv...rsmahabir
 
Authoritative and Volunteered Geographical Information in a Developing Countr...
Authoritative and Volunteered Geographical Information in a Developing Countr...Authoritative and Volunteered Geographical Information in a Developing Countr...
Authoritative and Volunteered Geographical Information in a Developing Countr...rsmahabir
 
Separability Analysis of Integrated Spaceborne Radar and Optical Data: Sudan ...
Separability Analysis of Integrated Spaceborne Radar and Optical Data: Sudan ...Separability Analysis of Integrated Spaceborne Radar and Optical Data: Sudan ...
Separability Analysis of Integrated Spaceborne Radar and Optical Data: Sudan ...rsmahabir
 
Relative value of radar and optical data for land cover/use mapping: Peru exa...
Relative value of radar and optical data for land cover/use mapping: Peru exa...Relative value of radar and optical data for land cover/use mapping: Peru exa...
Relative value of radar and optical data for land cover/use mapping: Peru exa...rsmahabir
 

More from rsmahabir (20)

A Critical Review of High and Very High-Resolution Remote Sensing Approaches ...
A Critical Review of High and Very High-Resolution Remote Sensing Approaches ...A Critical Review of High and Very High-Resolution Remote Sensing Approaches ...
A Critical Review of High and Very High-Resolution Remote Sensing Approaches ...
 
Impact of road networks on the distribution of dengue fever cases in Trinidad...
Impact of road networks on the distribution of dengue fever cases in Trinidad...Impact of road networks on the distribution of dengue fever cases in Trinidad...
Impact of road networks on the distribution of dengue fever cases in Trinidad...
 
The Rabies Epidemic in Trinidad of 1923 to 1937: An Evaluation with a Geograp...
The Rabies Epidemic in Trinidad of 1923 to 1937: An Evaluation with a Geograp...The Rabies Epidemic in Trinidad of 1923 to 1937: An Evaluation with a Geograp...
The Rabies Epidemic in Trinidad of 1923 to 1937: An Evaluation with a Geograp...
 
The Role of Spatial Data Infrastructure in the Management of Land Degradation...
The Role of Spatial Data Infrastructure in the Management of Land Degradation...The Role of Spatial Data Infrastructure in the Management of Land Degradation...
The Role of Spatial Data Infrastructure in the Management of Land Degradation...
 
Advancing the Use of Earth Observation Systems for the Assessment of Sustaina...
Advancing the Use of Earth Observation Systems for the Assessment of Sustaina...Advancing the Use of Earth Observation Systems for the Assessment of Sustaina...
Advancing the Use of Earth Observation Systems for the Assessment of Sustaina...
 
Dengue Fever Epidemiology and Control in the Caribbean: A Status Report (2012)
Dengue Fever Epidemiology and Control in the Caribbean: A Status Report (2012)Dengue Fever Epidemiology and Control in the Caribbean: A Status Report (2012)
Dengue Fever Epidemiology and Control in the Caribbean: A Status Report (2012)
 
Healthy Food Accessibility and Obesity: Case Study of Pennsylvania, USA
Healthy Food Accessibility and Obesity: Case Study of Pennsylvania, USAHealthy Food Accessibility and Obesity: Case Study of Pennsylvania, USA
Healthy Food Accessibility and Obesity: Case Study of Pennsylvania, USA
 
Exploratory space-time analysis of dengue incidence in trinidad: a retrospect...
Exploratory space-time analysis of dengue incidence in trinidad: a retrospect...Exploratory space-time analysis of dengue incidence in trinidad: a retrospect...
Exploratory space-time analysis of dengue incidence in trinidad: a retrospect...
 
Remote sensing-derived national land cover land use maps: a comparison for Ma...
Remote sensing-derived national land cover land use maps: a comparison for Ma...Remote sensing-derived national land cover land use maps: a comparison for Ma...
Remote sensing-derived national land cover land use maps: a comparison for Ma...
 
Comparison and integration of spaceborne optical and radar data for mapping i...
Comparison and integration of spaceborne optical and radar data for mapping i...Comparison and integration of spaceborne optical and radar data for mapping i...
Comparison and integration of spaceborne optical and radar data for mapping i...
 
Radar and optical remote sensing data evaluation and fusion; a case study for...
Radar and optical remote sensing data evaluation and fusion; a case study for...Radar and optical remote sensing data evaluation and fusion; a case study for...
Radar and optical remote sensing data evaluation and fusion; a case study for...
 
VDIS: A System for Morphological Detection and Identification of Vehicles in ...
VDIS: A System for Morphological Detection and Identification of Vehicles in ...VDIS: A System for Morphological Detection and Identification of Vehicles in ...
VDIS: A System for Morphological Detection and Identification of Vehicles in ...
 
Climate Change and Forest Management: Adaptation of Geospatial Technologies
Climate Change and Forest Management: Adaptation of Geospatial TechnologiesClimate Change and Forest Management: Adaptation of Geospatial Technologies
Climate Change and Forest Management: Adaptation of Geospatial Technologies
 
Black holes no more the emergence of volunteer geographic information
Black holes no more  the emergence of volunteer geographic informationBlack holes no more  the emergence of volunteer geographic information
Black holes no more the emergence of volunteer geographic information
 
An evaluation of Radarsat-2 individual and combined image dates for land use/...
An evaluation of Radarsat-2 individual and combined image dates for land use/...An evaluation of Radarsat-2 individual and combined image dates for land use/...
An evaluation of Radarsat-2 individual and combined image dates for land use/...
 
Radar speckle reduction and derived texture measures for land cover/use class...
Radar speckle reduction and derived texture measures for land cover/use class...Radar speckle reduction and derived texture measures for land cover/use class...
Radar speckle reduction and derived texture measures for land cover/use class...
 
Coral Reefs: Challenges, Opportunities and Evolutionary Strategies for Surviv...
Coral Reefs: Challenges, Opportunities and Evolutionary Strategies for Surviv...Coral Reefs: Challenges, Opportunities and Evolutionary Strategies for Surviv...
Coral Reefs: Challenges, Opportunities and Evolutionary Strategies for Surviv...
 
Authoritative and Volunteered Geographical Information in a Developing Countr...
Authoritative and Volunteered Geographical Information in a Developing Countr...Authoritative and Volunteered Geographical Information in a Developing Countr...
Authoritative and Volunteered Geographical Information in a Developing Countr...
 
Separability Analysis of Integrated Spaceborne Radar and Optical Data: Sudan ...
Separability Analysis of Integrated Spaceborne Radar and Optical Data: Sudan ...Separability Analysis of Integrated Spaceborne Radar and Optical Data: Sudan ...
Separability Analysis of Integrated Spaceborne Radar and Optical Data: Sudan ...
 
Relative value of radar and optical data for land cover/use mapping: Peru exa...
Relative value of radar and optical data for land cover/use mapping: Peru exa...Relative value of radar and optical data for land cover/use mapping: Peru exa...
Relative value of radar and optical data for land cover/use mapping: Peru exa...
 

Recently uploaded

THE ROLE OF PHARMACOGNOSY IN TRADITIONAL AND MODERN SYSTEM OF MEDICINE.pptx
THE ROLE OF PHARMACOGNOSY IN TRADITIONAL AND MODERN SYSTEM OF MEDICINE.pptxTHE ROLE OF PHARMACOGNOSY IN TRADITIONAL AND MODERN SYSTEM OF MEDICINE.pptx
THE ROLE OF PHARMACOGNOSY IN TRADITIONAL AND MODERN SYSTEM OF MEDICINE.pptxNandakishor Bhaurao Deshmukh
 
Microphone- characteristics,carbon microphone, dynamic microphone.pptx
Microphone- characteristics,carbon microphone, dynamic microphone.pptxMicrophone- characteristics,carbon microphone, dynamic microphone.pptx
Microphone- characteristics,carbon microphone, dynamic microphone.pptxpriyankatabhane
 
Is RISC-V ready for HPC workload? Maybe?
Is RISC-V ready for HPC workload? Maybe?Is RISC-V ready for HPC workload? Maybe?
Is RISC-V ready for HPC workload? Maybe?Patrick Diehl
 
TOPIC 8 Temperature and Heat.pdf physics
TOPIC 8 Temperature and Heat.pdf physicsTOPIC 8 Temperature and Heat.pdf physics
TOPIC 8 Temperature and Heat.pdf physicsssuserddc89b
 
RESPIRATORY ADAPTATIONS TO HYPOXIA IN HUMNAS.pptx
RESPIRATORY ADAPTATIONS TO HYPOXIA IN HUMNAS.pptxRESPIRATORY ADAPTATIONS TO HYPOXIA IN HUMNAS.pptx
RESPIRATORY ADAPTATIONS TO HYPOXIA IN HUMNAS.pptxFarihaAbdulRasheed
 
BIOETHICS IN RECOMBINANT DNA TECHNOLOGY.
BIOETHICS IN RECOMBINANT DNA TECHNOLOGY.BIOETHICS IN RECOMBINANT DNA TECHNOLOGY.
BIOETHICS IN RECOMBINANT DNA TECHNOLOGY.PraveenaKalaiselvan1
 
Best Call Girls In Sector 29 Gurgaon❤️8860477959 EscorTs Service In 24/7 Delh...
Best Call Girls In Sector 29 Gurgaon❤️8860477959 EscorTs Service In 24/7 Delh...Best Call Girls In Sector 29 Gurgaon❤️8860477959 EscorTs Service In 24/7 Delh...
Best Call Girls In Sector 29 Gurgaon❤️8860477959 EscorTs Service In 24/7 Delh...lizamodels9
 
Call Girls in Mayapuri Delhi 💯Call Us 🔝9953322196🔝 💯Escort.
Call Girls in Mayapuri Delhi 💯Call Us 🔝9953322196🔝 💯Escort.Call Girls in Mayapuri Delhi 💯Call Us 🔝9953322196🔝 💯Escort.
Call Girls in Mayapuri Delhi 💯Call Us 🔝9953322196🔝 💯Escort.aasikanpl
 
Pests of castor_Binomics_Identification_Dr.UPR.pdf
Pests of castor_Binomics_Identification_Dr.UPR.pdfPests of castor_Binomics_Identification_Dr.UPR.pdf
Pests of castor_Binomics_Identification_Dr.UPR.pdfPirithiRaju
 
Grafana in space: Monitoring Japan's SLIM moon lander in real time
Grafana in space: Monitoring Japan's SLIM moon lander  in real timeGrafana in space: Monitoring Japan's SLIM moon lander  in real time
Grafana in space: Monitoring Japan's SLIM moon lander in real timeSatoshi NAKAHIRA
 
Vision and reflection on Mining Software Repositories research in 2024
Vision and reflection on Mining Software Repositories research in 2024Vision and reflection on Mining Software Repositories research in 2024
Vision and reflection on Mining Software Repositories research in 2024AyushiRastogi48
 
GenBio2 - Lesson 1 - Introduction to Genetics.pptx
GenBio2 - Lesson 1 - Introduction to Genetics.pptxGenBio2 - Lesson 1 - Introduction to Genetics.pptx
GenBio2 - Lesson 1 - Introduction to Genetics.pptxBerniceCayabyab1
 
Call Girls in Munirka Delhi 💯Call Us 🔝8264348440🔝
Call Girls in Munirka Delhi 💯Call Us 🔝8264348440🔝Call Girls in Munirka Delhi 💯Call Us 🔝8264348440🔝
Call Girls in Munirka Delhi 💯Call Us 🔝8264348440🔝soniya singh
 
Recombinant DNA technology( Transgenic plant and animal)
Recombinant DNA technology( Transgenic plant and animal)Recombinant DNA technology( Transgenic plant and animal)
Recombinant DNA technology( Transgenic plant and animal)DHURKADEVIBASKAR
 
LIGHT-PHENOMENA-BY-CABUALDIONALDOPANOGANCADIENTE-CONDEZA (1).pptx
LIGHT-PHENOMENA-BY-CABUALDIONALDOPANOGANCADIENTE-CONDEZA (1).pptxLIGHT-PHENOMENA-BY-CABUALDIONALDOPANOGANCADIENTE-CONDEZA (1).pptx
LIGHT-PHENOMENA-BY-CABUALDIONALDOPANOGANCADIENTE-CONDEZA (1).pptxmalonesandreagweneth
 
BUMI DAN ANTARIKSA PROJEK IPAS SMK KELAS X.pdf
BUMI DAN ANTARIKSA PROJEK IPAS SMK KELAS X.pdfBUMI DAN ANTARIKSA PROJEK IPAS SMK KELAS X.pdf
BUMI DAN ANTARIKSA PROJEK IPAS SMK KELAS X.pdfWildaNurAmalia2
 
Behavioral Disorder: Schizophrenia & it's Case Study.pdf
Behavioral Disorder: Schizophrenia & it's Case Study.pdfBehavioral Disorder: Schizophrenia & it's Case Study.pdf
Behavioral Disorder: Schizophrenia & it's Case Study.pdfSELF-EXPLANATORY
 

Recently uploaded (20)

Hot Sexy call girls in Moti Nagar,🔝 9953056974 🔝 escort Service
Hot Sexy call girls in  Moti Nagar,🔝 9953056974 🔝 escort ServiceHot Sexy call girls in  Moti Nagar,🔝 9953056974 🔝 escort Service
Hot Sexy call girls in Moti Nagar,🔝 9953056974 🔝 escort Service
 
THE ROLE OF PHARMACOGNOSY IN TRADITIONAL AND MODERN SYSTEM OF MEDICINE.pptx
THE ROLE OF PHARMACOGNOSY IN TRADITIONAL AND MODERN SYSTEM OF MEDICINE.pptxTHE ROLE OF PHARMACOGNOSY IN TRADITIONAL AND MODERN SYSTEM OF MEDICINE.pptx
THE ROLE OF PHARMACOGNOSY IN TRADITIONAL AND MODERN SYSTEM OF MEDICINE.pptx
 
Microphone- characteristics,carbon microphone, dynamic microphone.pptx
Microphone- characteristics,carbon microphone, dynamic microphone.pptxMicrophone- characteristics,carbon microphone, dynamic microphone.pptx
Microphone- characteristics,carbon microphone, dynamic microphone.pptx
 
Is RISC-V ready for HPC workload? Maybe?
Is RISC-V ready for HPC workload? Maybe?Is RISC-V ready for HPC workload? Maybe?
Is RISC-V ready for HPC workload? Maybe?
 
TOPIC 8 Temperature and Heat.pdf physics
TOPIC 8 Temperature and Heat.pdf physicsTOPIC 8 Temperature and Heat.pdf physics
TOPIC 8 Temperature and Heat.pdf physics
 
RESPIRATORY ADAPTATIONS TO HYPOXIA IN HUMNAS.pptx
RESPIRATORY ADAPTATIONS TO HYPOXIA IN HUMNAS.pptxRESPIRATORY ADAPTATIONS TO HYPOXIA IN HUMNAS.pptx
RESPIRATORY ADAPTATIONS TO HYPOXIA IN HUMNAS.pptx
 
Volatile Oils Pharmacognosy And Phytochemistry -I
Volatile Oils Pharmacognosy And Phytochemistry -IVolatile Oils Pharmacognosy And Phytochemistry -I
Volatile Oils Pharmacognosy And Phytochemistry -I
 
BIOETHICS IN RECOMBINANT DNA TECHNOLOGY.
BIOETHICS IN RECOMBINANT DNA TECHNOLOGY.BIOETHICS IN RECOMBINANT DNA TECHNOLOGY.
BIOETHICS IN RECOMBINANT DNA TECHNOLOGY.
 
Best Call Girls In Sector 29 Gurgaon❤️8860477959 EscorTs Service In 24/7 Delh...
Best Call Girls In Sector 29 Gurgaon❤️8860477959 EscorTs Service In 24/7 Delh...Best Call Girls In Sector 29 Gurgaon❤️8860477959 EscorTs Service In 24/7 Delh...
Best Call Girls In Sector 29 Gurgaon❤️8860477959 EscorTs Service In 24/7 Delh...
 
Call Girls in Mayapuri Delhi 💯Call Us 🔝9953322196🔝 💯Escort.
Call Girls in Mayapuri Delhi 💯Call Us 🔝9953322196🔝 💯Escort.Call Girls in Mayapuri Delhi 💯Call Us 🔝9953322196🔝 💯Escort.
Call Girls in Mayapuri Delhi 💯Call Us 🔝9953322196🔝 💯Escort.
 
Pests of castor_Binomics_Identification_Dr.UPR.pdf
Pests of castor_Binomics_Identification_Dr.UPR.pdfPests of castor_Binomics_Identification_Dr.UPR.pdf
Pests of castor_Binomics_Identification_Dr.UPR.pdf
 
Grafana in space: Monitoring Japan's SLIM moon lander in real time
Grafana in space: Monitoring Japan's SLIM moon lander  in real timeGrafana in space: Monitoring Japan's SLIM moon lander  in real time
Grafana in space: Monitoring Japan's SLIM moon lander in real time
 
Vision and reflection on Mining Software Repositories research in 2024
Vision and reflection on Mining Software Repositories research in 2024Vision and reflection on Mining Software Repositories research in 2024
Vision and reflection on Mining Software Repositories research in 2024
 
GenBio2 - Lesson 1 - Introduction to Genetics.pptx
GenBio2 - Lesson 1 - Introduction to Genetics.pptxGenBio2 - Lesson 1 - Introduction to Genetics.pptx
GenBio2 - Lesson 1 - Introduction to Genetics.pptx
 
Engler and Prantl system of classification in plant taxonomy
Engler and Prantl system of classification in plant taxonomyEngler and Prantl system of classification in plant taxonomy
Engler and Prantl system of classification in plant taxonomy
 
Call Girls in Munirka Delhi 💯Call Us 🔝8264348440🔝
Call Girls in Munirka Delhi 💯Call Us 🔝8264348440🔝Call Girls in Munirka Delhi 💯Call Us 🔝8264348440🔝
Call Girls in Munirka Delhi 💯Call Us 🔝8264348440🔝
 
Recombinant DNA technology( Transgenic plant and animal)
Recombinant DNA technology( Transgenic plant and animal)Recombinant DNA technology( Transgenic plant and animal)
Recombinant DNA technology( Transgenic plant and animal)
 
LIGHT-PHENOMENA-BY-CABUALDIONALDOPANOGANCADIENTE-CONDEZA (1).pptx
LIGHT-PHENOMENA-BY-CABUALDIONALDOPANOGANCADIENTE-CONDEZA (1).pptxLIGHT-PHENOMENA-BY-CABUALDIONALDOPANOGANCADIENTE-CONDEZA (1).pptx
LIGHT-PHENOMENA-BY-CABUALDIONALDOPANOGANCADIENTE-CONDEZA (1).pptx
 
BUMI DAN ANTARIKSA PROJEK IPAS SMK KELAS X.pdf
BUMI DAN ANTARIKSA PROJEK IPAS SMK KELAS X.pdfBUMI DAN ANTARIKSA PROJEK IPAS SMK KELAS X.pdf
BUMI DAN ANTARIKSA PROJEK IPAS SMK KELAS X.pdf
 
Behavioral Disorder: Schizophrenia & it's Case Study.pdf
Behavioral Disorder: Schizophrenia & it's Case Study.pdfBehavioral Disorder: Schizophrenia & it's Case Study.pdf
Behavioral Disorder: Schizophrenia & it's Case Study.pdf
 

APPLICATIONS OF REMOTE SENSING AND GIS TECHNOLOGIES IN FLOOD RISK MANAGEMENT

  • 1. Al-Tahir R., Saeed I. & Mahabir R. 2014. Application of remote sensing and GIS technologies in flood risk management. In: Flooding and Climate Change: Sectorial Impacts and Adaptation Strategies for the Caribbean Region. Chadee DD, Sutherland JM & Agard, JB (Editors). pp. 137-150, Nova Publishers, Hauppauge, New York. 137 Chapter 8 APPLICATIONS OF REMOTE SENSING AND GIS TECHNOLOGIES IN FLOOD RISK MANAGEMENT Raid Al-Tahir, Intesar Saeed and Ron Mahabir The Centre for Caribbean Land and Environmental Appraisal Research (CLEAR) The University of the West Indies, St Augustine, Trinidad and Tobago ABSTRACT Flooding is the most common of all major disasters that regularly affect populations and results in extensive damage to property, infrastructure, natural resources, and even to loss of life. To ensure better outcomes, planning and execution of flood management projects must utilize knowledge on a wide range of factors, most of which are of a spatial nature. Advances in geospatial technologies, specifically remote sensing and Geographic Information Systems (GIS), have enabled the acquisition and analysis of data about the Earth's surface for flood mitigation projects in a faster, more efficient and more accurate manner. Remote sensing and GIS have emerged as powerful tools to deal with various aspects of flood management in prevention, preparedness and relief management of flood disaster. GIS facilitates integration of spatial and non-spatial data such as rainfall and stream flows, river cross sections and profiles, and river basin characteristics, as well as other information such as historical flood maps, infrastructures, land use, and social and economic data. Such data sets are critical for the in-depth analysis and management of floods. Remote sensing technologies have great potential in overcoming the information void in the Caribbean region. The observation, mapping, and representation of Earth’s surface have provided effective and timely information for monitoring floods and their effect. The potential of new air- and space-borne imaging technologies for improving hazard evaluation and risk reduction is continually being explored. They are relatively inexpensive and have the ability to provide information on several parameters that are crucial to flood mapping and monitoring. This chapter examines the use of the new imagery data as an up-to-date and affordable source of information for establishing the necessary information for flood management in the Caribbean region. The chapter also reviews the use of an integrated GIS approach to
  • 2. Raid Al-Tahir, Intesar Saeed and Ron Mahabir fulfil data and analysis needs for planning and emergency operations and how it can become the backbone of emergency management. INTRODUCTION Of the various geohazards that disrupt the natural and man-made environments, flooding is the most common and most costly. In fact, of all natural risks, floods pose the most widely occurring hazard to life today. A flood is commonly defined as any level of flow that exceeds the natural carrying capacity of a watercourse, overflows its banks, and inundates the adjacent low lying lands (OAS 1991). The United States Geological Survey defines a flood as a “relatively high water that overflows the natural or artificial banks of a stream or coastal area that submerges land not normally below water” (USGS 2007). The leading cause of floods is a prolonged heavy rainfall that creates high runoff in rivers, or a build up of surface water in areas of low relief. On the other hand, intense rainfall over short periods from storms and hurricanes may produce rapid runoff and sudden but severe flash floods across river valleys, resulting in insurmountable losses to human life and property compared to any other type of flooding. Coastal areas are also prone to flooding when storms and large waves bring seawater onto the land (Few et al. 2004). Small Island Developing States are especially impacted since a great majority of the population live and work near coastal areas. Other conditions that may cause flooding are those events that occur less frequently but result in major consequences when they occur. These include events such as earthquakes, bursting of reservoirs, failure of dams, dikes and weir gates, and tsunamis. Specific to developing countries, including the Caribbean region, the flooding problem is further intensified by inappropriate land use and environmental degradation in areas that are vulnerable to erosion, rapid water runoff, and slope failure. Poor land-use practices (e.g., slash and burn agriculture, quarrying, deforestation, and rapid urbanization and development) lead to heavy sedimentation in river channels, thus, reducing their carrying capacity. In parallel, the removal of vegetative cover leads to much shorter lag times between rainfall and the water reaching the waterways causing the already reduced channels to overflow, leading to massive floods (Ramlal and Baban 2008). Further upset in flood events is also expected as a result of global climate change, leading to consequent increase in extreme climatic events such as severe dry spells, heavy rainstorms and tidal surges. It is expected that areas most vulnerable will continue to be further devastated (Few et al. 2004; Ramlal and Baban 2008). Such findings are supported by reports made available by the Intergovernmental Panel on Climate Change and related research from scientific bodies with similar interests worldwide. According to the UN World Water Assessment Programme, floods accounted for 15% of all deaths related to natural disasters, and approximately 66 million people suffered flood damage from 1973 to 1997 (WWAP 2006). Persons can be both directly and indirectly impacted by floods. Direct impacts include loss of lives, damage to property, disruption of transportation, communications, health and community services, crop and livestock damage, and interruptions and losses in businesses. The indirect effects of floods are far more damaging and include elements of society that reflect a more in-depth and personal assessment of flooding on the wellbeing of people (Badilla 2008).
  • 3. Applications of Remote Sensing and GIS Technologies in Flood Risk Management 139 Figure 8.1. Total number of reported disasters caused by floods in the World: 1974 – 2003 (Hoyois and Guha-Sapir 2004). Developing countries are disproportionately affected by disasters. Economic losses attributable to natural hazards in developing countries are about 5 times higher per unit of gross domestic product (GDP) than those of more affluent countries. Furthermore, developing countries accounted for over 50% of all disaster fatalities from 1992 to 2001, which translates into approximately 13 times more people die per reported disaster than in developed countries (Van Westen 2002; WWAP 2006). This problem is further exacerbated with knowledge that the magnitude and frequency of floods will continue to increase as indicated by the trend in Figure 8.1 (Badilla 2008; Hoyois and Guha-Sapir 2004). Given the severe negative impacts of floods there is therefore an urgent need to introduce proper management measures to ensure that vulnerable areas are protected and flooding impact is minimized. Whether using structural, non-structural or mixed strategies, improving the capabilities to mitigate and respond to flood hazards would require better understanding and mapping of the hazards, as well as identifying the nature and extent of vulnerability of the areas under consideration. These activities prompt both the need and use of spatial data representative of the disaster and factors that can be used in assisting all phases of a comprehensive disaster management program. This chapter is divided into 4 sections from this point on. Section 2 will review the different phases and activities of a disaster management program, and highlights the specific required spatial datasets within each phase. Section 3 will introduce, in general, the use of Geographic Information Systems (GIS) and remote sensing techniques in flood management, while Section 4 will identify, in greater detail, specific studies and cases for the application of these technologies as they relate to the different phases of disaster management. Finally, section 5 provides conclusions. 2. DISASTER MANAGEMENT ACTIVITIES Disaster management endeavours to reduce or avoid the potential losses from hazards, assure prompt and appropriate assistance to victims of disaster, and achieve rapid and
  • 4. Raid Al-Tahir, Intesar Saeed and Ron Mahabir effective recovery. Activities related to disaster management can be grouped into pre-event activities (mitigation and preparedness), actions during and immediately following an event (rescue and relief), and post-disaster activities (rehabilitation and reconstruction). These phases are related to each other and are typically represented as a cycle since the occurrence of a disaster event will eventually influence the way society is preparing for the next one (Mansor et al. 2004; OAS 1991; Van Westen 2002). The following sections will provide a synopsis of the activities in each phase with the objective of identifying the required spatial data. 2.1. Mitigation Mitigation activities focus on eliminating or reducing the probability of a disaster occurrence and reducing the impact of unavoidable disaster. This phase involves essentially three kinds of studies (OAS 1991): • Natural Hazard Assessments provide information on the probable location and severity of natural hazards and their likelihood of occurring within a specific time period in a given area; • Vulnerability Assessments estimate the degree of loss or damage that would result from the occurrence of a natural hazard of given severity; and • Risk Assessments integrate information from the analysis of an area's hazards and its vulnerability to them, into an estimate of the probability of expected loss from a hazardous event. The effectiveness of disaster mitigation depends on the availability of information related to the hazards and the various sectors affected by them. As such, data collection and analysis is required to identify and evaluate appropriate measures. Hazard assessment studies rely heavily on geologic, geomorphic, and soil maps; climate and hydrological data; topographic maps, aerial photographs, and satellite imagery; as well as historical information on previous occurrences of the hazard. Vulnerability assessments, on the other hand, need to incorporate and analyse information on human population, capital facilities and resources, and economic activities (OAS 1991). 2.2. Preparedness The goal of disaster preparedness is to develop plans that minimize the loss of life and damage to property during a natural event. Disaster preparedness promotes the development of a system for monitoring known hazards, a warning system, emergency and evacuation plans, and emergency routes. Additionally, this phase includes a number of efforts aimed at increasing the amount of information disseminated to the public and at promoting cooperation between the public and the authorities in case of an emergency (Johnson 2000; OAS 1991).
  • 5. Applications of Remote Sensing and GIS Technologies in Flood Risk Management 141 2.3. Rescue and Relief Following the occurrence of the disaster, activities in this phase are designed to provide emergency assistance for victims that include search and rescue, emergency shelter, medical care, and mass feeding. They also seek to stabilize the situation and reduce the probability of secondary damage (Johnson 2000). The success of these activities is heavily dependent on real time information with respect to service routes and up-to-date information on the location and resource availability at the various critical facilities. 2.4. Post-Disaster Rehabilitation and Reconstruction Post-disaster activities are necessary to return all systems to a state of normalcy or at least to a state that is better than that immediately following the occurrence of a disaster. These activities have a short-term goal of restoring vital life support systems to minimum operating standards. Additionally, this phase includes long-term rehabilitation activities to re-establish the functions of public services, business, and commerce, to repair housing and other structures, and to return production facilities to operation (Johnson 2000; OAS 1991). Investigations at the post-disaster phase will re-examine the qualitative and quantitative aspects of natural hazards, often improving on information produced by modelling and conjecture, by indicating areas where development should be extremely limited or should not take place (OAS 1991). 3. ROLE OF GEOSPATIAL TECHNOLOGIES IN FLOOD MANAGEMENT An effective flood management program, and all its phases, depends on a wide range of parameters and large volumes of accurate, relevant, and timely geoinformation. Besides, geographical data and tools are an absolute necessity if scientific understanding is to be translated into effective evidence-based and place-based policy (Murphy et al. 2010). As indicated in the previous section, the required physical information includes topography and terrain, soil types, watershed/catchments, land cover and forestry, and the intensity of the triggering factors. Ultimately, flood risk management requires socio-economic data (housing location, valuation data, demographic structure, census information) as well as land use information, administrative boundaries, development pressure, and environmental constraints. However, there is a severe shortage of reliable and compatible data sets generally in the whole Caribbean region. Information needed for accurate planning is often outdated, non- existent, or very expensive and time consuming to collect (Al-Tahir et al. 2006). Without such information, the investigation of flood susceptibility, and the formation of proper national planning policies in many Caribbean island states will be both difficult and error prone. Modern geospatial technologies, especially in the disciplines of photogrammetry, remote sensing, and spatial information science, can assist in crisis management through observation,
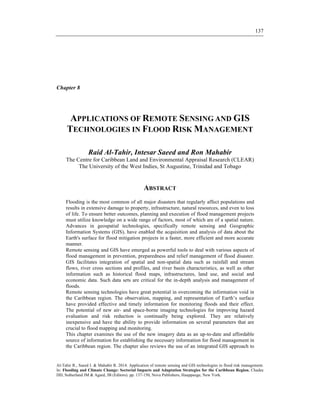
  • 6. Raid Al-Tahir, Intesar Saeed and Ron Mahabir mapping, and analysing relevant information in each of the critical disaster management phases (Altan and Kemper 2010). Geospatial data and tools have a key role in the saving of lives, the limitation of damage, and the reduction in the costs to society of dealing with emergencies. Recent improvements in computer software and hardware have allowed remote sensing and GIS to provide the way forward in collecting and managing relevant data sets, and in developing management scenarios to evaluate mitigation strategies (Ehlers 2004). 3.1. The Role of GIS Flooding is a dynamic process and exhibits spatial characteristics in the sense that floods occur at a particular location at which various contributing factors for the event exist. For example, typical flood conditions include areas gently sloping or basins, heavy rainfall, saturated soil and blocked channels (Alkema 2004). The primary function of GIS is to store and link multiple digital databases and many different themed layers of information, graphically display that information as maps, and to examine how the layers interrelate. These layers, such as those depicted in Figure 8.2, would carry the key elements needed for flood hazard management (GAO 2004). This information may come from many sources, including remote sensing, GPS, censuses, soil samples, stream gage systems, and weather stations. Additionally, historical data help in identifying where flood may occur since areas most commonly flooded are expected to flood again. Having acquired and stored the required data, GIS based analysis is then conducted to determine the amount of influence of each of the factors and their impacts in different scenarios. GIS provides an enabling technology by means of presenting a feasible solution, providing tools and methods that support all phases of flood management. Specifically, GIS is used for locating critical and vulnerable assets, planning, mitigation activities, assisting in response, and aiding in recovery management (Khanna et al. 2006). Table 1 lists various common applications of GIS in hazard management in general. Table 8.1. Common applications of GIS in hazard management (Marfai 2003) Function Potential Applications Data display • Aid in the analysis of spatial distribution of socio-economic infrastructure and natural hazard phenomena. • Use of thematic maps to enhance reports and/or presentations. • Link with other databases for more specific information. Land information storage and retrieval Filing, maintaining, and updating land related data (e.g., land ownership, records of previous natural events, permissible uses, etc.) Zone and district management • Maintain and update district maps, such as zoning of floodplain maps. • Determine and enforce adequate land-use regulation and building codes Site selection Identification of potential sites for particular uses Hazard impact assessment Identification of geographically determined hazard impacts Development/land suitability modelling Analysis of suitability of particular parcels for development.
  • 7. Applications of Remote Sensing and GIS Technologies in Flood Risk Management 143 Figure 8.2. GIS Layers for Flood Mapping (GAO 2004). By overlaying or intersecting different spatial layers, flood-prone areas can be identified, thereby enabling more effective mitigation and response to flooding events. GIS is also used to present flood-related information visually in 2D or 3D such that it might be more intuitively understood, particularly by a lay audience. GIS-generated maps provide an effective means of informing the public or news media on evacuation routes, on the extent and impact of a flood when it occurs, and on the government’s response efforts (Shanley et al. 2006). This information can be disseminated with the use of web technologies, creating interactive maps that can be queried and updated in real time, and linked to additional information. 3.2. The Role of Remote Sensing Remote sensing is another advancing technology that has benefited flood modelling and flood risk assessment in providing a cost effective means of acquiring accurate spatial and temporal data (Khanna et al. 2006). Remote sensing of the environment involves the measurement of electromagnetic radiation reflected from or emitted by the Earth’s surface and relating these measurements to the types of land cover and habitat in the area being observed by the sensor (Al-Tahir et al. 2006). Observing Earth’s surface using sensors on
  • 8. Raid Al-Tahir, Intesar Saeed and Ron Mahabir board various space and air platforms has evolved into a multinational enterprise producing a large amount of digital data on various physical parameters that characterize the earth system (Murphy et al. 2010). Remote sensing continues to expand making use of new kinds of sensors that exploit different parts of the electromagnetic spectrum, and achieve finer levels of spatial, temporal, or spectral resolution (Murphy et al. 2010). Considerable advances in remote sensing technology have occurred both in acquiring digital aerial photography and high resolution satellite data. Parallel to this, new techniques have been developed for improved processing and extraction of spatial information from these new data sets (Ehlers 2004). The distinction between aerial photography and satellite remote sensing is based on the fact that each of them provides some capabilities that cannot be achieved by the other. Such comparative capabilities include ground coverage, repeatability of observations, spectral ranges, and geometry for three dimensional mapping (Li 1998). Aerial photo data are of immense value, especially when long term spatial data is required, such as in the case of hydrology and flooding (Rango et al. 2008) considering that aerial photography extends back into the mid 1940s in most of the Caribbean states. Satellites on the other hand have been around for a much shorter period, with the early images of the earth’s surface collected in the 1970s. The principal advantages in using satellite images stems from their higher spectral resolution. Information from earth observation platforms, combined with other relevant data in GIS, have triggered advancements in flood modelling and demonstrated their utility in providing historical, recent, and repetitive data for a wide range of applications in disaster management. Earth observation techniques are used for mapping geomorphologic elements, historical events and sequential inundation phases, including duration, depth of inundation, and direction of current to indicate which areas are potentially vulnerable (Altan and Kemper 2010; Van Westen 2002). Moreover, images of an area can be analyzed together with various land cover input parameters, essential for use and development of hydrological modelling for risk analysis. High resolution images offer great opportunities to identify individual structures and natural features as well as their functions that are important for the assessment of their vulnerability and value. This is a very critical aspect in monitoring the increasing risks and impacts of floods, especially for urban areas that experience fast and uncontrolled expansion into hazardous areas (Alkema 2004). Because of its availability and temporal resolution, high resolution imagery provides a critical tool for monitoring floods before, during and after the event, supporting a much more in depth analysis of the hazard and hydrological models. Digital elevation model (DEM) (or alternatively, digital terrain model; DTM) is essential for flood management and hydrological modelling. DEM is used for deriving critical information sets such as possible sinks, flow direction, and rate of flow of floods. Such data is yet another data set that can only be provided effectively by remote sensing. Aerial surveys using airborne cameras and/or airborne LIDAR sensors are able to deliver a high density digital terrain model. DEM can also be extracted from space- borne sources such as satellite stereo images of SPOT, or radar data such as those collected by the Shuttle Radar Terrain Measurement (SRTM) data. Using DEM in combination with other data in a GIS analysis basin boundary, drainage network, area, and elevation can be extracted, and risk estimations can be carried out (Badilla 2008). The resolution of the DEM is critical since this will dictate the smallest structural features (e.g. rivers) that can be reconstructed (Alkema 2004).
  • 9. Applications of Remote Sensing and GIS Technologies in Flood Risk Management 145 4. APPLICATIONS OF INTEGRATED GEOSPATIAL TECHNOLOGIES IN FLOOD RISK MANAGEMENT The following sections will review some specific cases where remote sensing and GIS have provided the tools for data collection and analysis in support of pre-disaster preparedness programs, in-disaster response activities, and post-disaster reconstruction. 4.1. Disaster Mitigation and Preparedness The most promising application of remote sensing is its use for risk analysis as a function of hazard and vulnerability assessments. The mapping of areas affected by floods is essential for both planning and the assessment of incurred damages as a result of the disaster. Achieving this will require mapping flooded areas before and after flood waters recede. Satellite and aerial remote sensing provides a suitable alternative to traditional field surveying techniques for producing flood inundation maps. Besides, they offer the possibility of validating the output of developed models by comparing the observed extent of the flood with the modelled prediction (Alkema 2004; Wilson and Atkinson 2003). Due to its advantageous synoptic view of the hazard, geospatial imagery can be added into the GIS as a layer after being georeferenced. The extent of flooding is then delineated and further superimposed onto additional spatial variables for analysis. Also, images representing the extent of flooding can be collected at different time intervals in order to monitor both the progression and recession of the flood inundation within a short period of time which can be used for planning and organizing mitigation or response operations effectively (Khanna et al. 2006). Flood susceptibility mapping and risk area delineation is another task that can benefit from an integrated use of GIS and remote sensing. In a study carried out in Malaysia, a GIS and remote sensing-based flood susceptibility model was prepared using the known extent of flooded areas (Pradhan 2009). Historical flooded areas extracted from RADARSAT images, and terrain characteristics extracted from the DEM (e.g., slope, aspect, flow direction), soil, soil texture, land cover, and precipitation information were updated to enable the quantification of flood associated attributes. A flood susceptibility map was then produced using a logistic regression model that assessed all these factors. Most studies typically assess flood risks purely in terms of economic damage while neglecting the social and economic impacts, leaving the map to assess the risk. One may face a challenging task when incorporating several factors in identifying both potential areas to be flooded and the associated level of risk should the hazard be realized. This becomes an issue of concern since different factors exert different levels of influence based on present situation and their interactions within the environment. In this event weights must be given to the different criteria for indicating the level of impact that each risk criterion has on flooding. In studies by Meyer et al. (2009) and Wallingford (2007), a multi-criteria approach towards flood-risk management is given. GIS provides an optimum environment for providing different possibilities for multi-criteria analysis of spatial problems such as floods. Hydrological models are used as another approach in flood hazard mapping in parallel with the use of historical events as the main indicator. A study by Kafle et al. (2006)
  • 10. Raid Al-Tahir, Intesar Saeed and Ron Mahabir integrated flood simulation modelling with remote sensing and GIS data for flood hazard mapping in the Baghmati River, Nepal. Dry season satellite images were used to update the existing land use map in the flood affected areas. Following this, a hydrologic model was developed in combination with a digital elevation model, and was used for delineating the inundation area extent, and estimating the flood depths in areas where images capturing the peak flood events were not available. Consequently, flood hazard maps were prepared for a 50-year flood followed by designing a flood-hazard ranking system by combining flood extent, flood depth, land-use types and population. A specific large segment of the river bank was subsequently identified as the main spilling reach for structural countermeasures (Kafle et al. 2006). It is evident from all previous discussions that digital elevation model (DEM) plays a very essential role in hydraulic models and risk analysis. As such, several studies have focused on the varying means for acquiring elevation data, and the impact of their resolution and accuracy on the analysis. Such a study was conducted by Wilson and Atkinson (2003) for the use of LiDAR, stereo photogrammetry, and ERS interferometric SAR (InSAR) elevation data for flood inundation modelling. Each dataset was used to predict flood inundation for a 60 day event during a series of major flooding of the Avon River, England, that occurred in autumn 2000. Predictions using each elevation dataset were then compared to aerial photography of the flooding acquired close to the flood peak. The most accurate prediction of inundation was obtained using the LiDAR data (after the removal of above surface features), followed by photogrammetric data (Wilson and Atkinson 2003). In another study, concerns over the suitability of using a coarse resolution of DEM (50 metre) to reconstruct small structural features of small rivers, especially those with narrow banks like Onga River on Kyushu Island in Japan were investigated (Mori 2007). To achieve the goals for this study, a 2-meter meshed DEM was generated using the airborne laser system with a vertical resolution of 0.1 metre. For estimating flooded areas around the Onga River, 3D topographic maps and 1-meter contour lines were created using the DEM data in the GIS system. The study concluded that the higher resolution DEM was the key for providing precise water levels and, hence, more accurate estimations of the flooded area. 4.2. During and Post-Disaster Applications During the event of flooding, the integrated use of remote sensing and GIS has been effectively applied in issuing warnings (such as cyclone tracking), appraising the extent of damage, and providing alternative evacuation routes during rescue and relief efforts. Developed evacuation plans need to be rapidly updated in response to new images and information over the affected population as well as the damaged routes and shelters. Figure 8.3 depicts such a GIS and remote sensing approach to dynamic response to a disaster. Such an approach, though, depends on a rich source of accurate and up-to-date GIS and auxiliary data, and satellite imagery. In some cases particular resources, including human and technology needed to execute the system may not be available due to either financial limitations or lack of political will. Such is usually the case for developing countries.
  • 11. Applications of Remote Sensing and GIS Technologies in Flood Risk Management 147 Figure 8 3. GIS evacuation plan (Naghdi et al. 2008). One example in this respect is the island of Haiti where in January 2010 an earthquake of magnitude 7.0 struck resulting in massive destruction to property and killing over 100,000 persons. Relief efforts would have failed if not for the quick thinking of government and private organizations worldwide making available vast amounts of up-to-date mid- to high- resolution satellite imagery of the island. Using these images, relief organizations were able to better plan their routes using visual analysis as well as integrated GIS technologies and become more effective in their approach. The technologies of remote sensing and also GIS play a critical role in the post-disaster and rehabilitation phase. In addition to offering rapid flood monitoring and assessment, satellite images of real flood events and information from the ground are useful for actual flood damage assessment, future flood mitigation planning, and validation of hydraulic analysis (Altan and Kemper 2010). Such an integrated approach was used in the city of Muscat, Oman that was hit by a cyclone (Azaz 2007). GIS and satellite images were used to organize the damage information and the post-disaster census information, in addition to evaluating sites for reconstruction. In this study, two high-resolution satellite images (IKONOS) were utilized; one image before the cyclone and one after. The two images were geometrically corrected, and a change detection technique was then applied to identify and assess the damage (Azaz 2007). Another study developed a methodology to combine the spectral, spatial and contextual information captured by IKONOS images to produce an accurate property damage map after flooding that affected villages in the southern part of the Netherlands in 1995 (van der Sande et al. 2003). The detailed land cover map, water depth, and known relations between water depth and property damage were all contributed to the creation of this map. The study confirmed that maps derived from high spatial resolution geospatial imagery are most accurate for flood simulations and actual property damage assessment (van der Sande et al. 2003).
  • 12. Raid Al-Tahir, Intesar Saeed and Ron Mahabir The results of the two previous studies emphasize the importance of using remote sensing and GIS in the damage assessment phase as part of an effective disaster management plan. However, there is usually an overwhelming cloud cover in the aftermath of a flood, particularly in the Caribbean islands. Thus, it is very difficult to obtain clear satellite image in the visible and near infared region. Having the capability to penetrate clouds and rain, radar images would thus be a better alternative in such cases. In fact, radar imagery was utilized to promptly obtain flood extent and assess flood damage in aftermath of the flood disaster in China along Changjiang River in 1998 (Yang et al. 2002). A RADARSAT image obtained after the flood was used for determining the flood extent while optical satellite images (LANDSAT) were used to provide the land cover status before the flood. 5. CONCLUSION Flooding is the most common and most predominantly occurring geohazard in today’s world. It accounts for a substantial proportion of human and economic distress with both direct and indirect impacts. Management of flood disaster can be successful only when detailed knowledge is obtained about the character and magnitude of the flood as well as the vulnerability of the people, residential properties, infrastructure, agricultural crops, and economic activities in the potentially vulnerable area. This chapter has presented the use of Earth observation and Geographic Information Systems as enabling technologies for assisting in a comprehensive disaster management system. Having reviewed several cases for their applications, these technologies have emerged as powerful tools for dealing with various aspects of flood prevention, preparedness, relief, and recovery efforts of flood disaster. Earth observation and GIS techniques can significantly contribute to improving the efforts in modelling flood events, developing proper flood-mitigation strategies, and providing relevant agencies with important information for alleviating flood damage. They can supplement or complement other structural and non-structural measures in flood management systems. Extensive use of these technologies can prospectively create long term databases on flood proneness, risk assessment and relief management. REFERENCES Alkema, D. (2004). RS and GIS applications in flood forecasting. Proceedings of the National Workshop on Flood Disaster Management: Space Inputs. India. 57-59. Al-Tahir, R., Baban, S. & Ramlal, B. (2006). Utilizing emerging geo-imaging technologies for the management of tropical coastal environments. West Indian Journal of Engineering, 29 (1), 11-21. Altan, O. & Kemper G. (2010). Spatial Information for disaster management using examples from Istanbul. In M. Konecny et al. (eds.), Geographic Information and Cartography for Risk and Crisis Management, Lecture Notes in Geoinformation and Cartography, Springer-Verlag Berlin.
  • 13. Applications of Remote Sensing and GIS Technologies in Flood Risk Management 149 Azaz, L. (2007). Using remote sensing and GIS for damage assessment after flooding, the case of Muscat, Oman after Gonu tropical cyclone: Urban planning perspective. Proceedings of 15th International Conference on Urban Planning and Regional Development in the Information Society. Vienna, http://programm.corp.at/cdrom2010/ papers2010/CORP2010_182.pdf Badilla, R. A. (2008). Flood Modelling in Pasig-Marikina River Basin. Thesis. International Institute for Geo-Information Science and Earth Observation, Netherlands. Ehlers, M. (2004). Remote sensing for GIS applications: New sensors and analysis methods. In Ehlers, M., Kaufmann, H., and Michel (eds.), Remote Sensing for Environmental Monitoring, GIS Applications, and Geology III, Proc. of SPIE, Vol. 5239, 1-13. Few, R., Ahern, M., Matthies, F. & Kovats, S. (2004). Floods, Health and Climate Change: A Strategic Review. Tyndall Centre Working Paper 63. Hoyois, P. & Guha-Sapir, D. (2004). Disasters caused by flood: Preliminary data for a 30 year assessment of their occurrence and human impact. Health and Flood Risk Workshop. University of East Anglia. UK. http://www.em-dat.net/documents/working_paper/ 30yearsoffloods3.pdf Johnson, R. (2000). GIS Technology for Disasters and Emergency Management. ESRI White Paper. ESRI. Kafle T., Hazarika, M., Shrestha, K., Prathumchai, K. & Samarakoon, L. (2006). Integration of remote sensing and GIS with flood simulation model for flood hazard mapping in the Bagmati River, Nepal. Proceedings of the 5th International Symposium on New Technologies for Urban Safety of Mega Cities in Asia, Phuket, Thailand. Khanna, R. K., Agrawal, C. K. & Kumar, P. (2006). Remote Sensing and GIS applications in flood management. Proceedings of the India Disaster Management Congress, New Delhi. pp. 11. Li, R. (1998). Potential of high-resolution satellite imagery for national mapping products. Photogrammetric Engineering and Remote Sensing, 64(12), 1165-1169. Mansor, S., Abu Shariah, M., Billa, L., Setiawan, I. & Jabar, F. (2004). Spatial technology for natural risk management. Disaster Prevention and Management. Volume 13, Number 5, 364-373. Marfai, M.A. (2003). GIS Modelling of River and Tidal Flood Hazards in a Waterfront City. Case study: Semarang City, Central Java, Indonesia. MSc. Thesis, International Institute for Geo-Information Science and Earth Observation, Netherlands. Available online: http://www.itc.nl/Pub/Home/library/Academic_output (Last accessed on 10 May 2010) Meyer, V., Haase, D. & Scheuer, S. (2009). A Multicriteria Flood Risk Assessment and Mapping Approach. In: Flood Risk Management: Research and Practice. Allsop, W., Samuels, P., Harrop, J. and Huntington, S. (Editors). Taylor and Francis Group, London, pp. 1687-1693. Mori, M. (2007). GIS analysis of river flooding by high-resolution (2m) DEM. Proceedings of the Annual Conference of the Remote Sensing &Photogrammetry Society. Newcastle upon Tyne. UK Murphy, A., Colleton, N., Downs, R., Goodchild, M., Hanson, S., Lawson, V., Macdonald, G., Magilligan, F., Moseley, W., Polsky, C., Seto, K. & Wright, D. (2010). Understanding the Changing Planet: Strategic Directions for the Geographical Sciences. National Research Council. The National Academies Press. Washington, D.C.
  • 14. Raid Al-Tahir, Intesar Saeed and Ron Mahabir Naghdi, K., Mansourian, A., Valadanzoej, M. & Saadatseresht, M. (2008). Evacuation planning in earthquake disasters using RS & GIS. The International Archives of the Photogrammetry, Remote Sensing and Spatial Information Sciences. Vol. XXXVII. Part B4. pp. 1671-1676 Organization of American States (OAS) (1991). Primer on Natural Hazard Management in Integrated Regional Development Planning. Organization of American States, Washington, D.C. http://www.oas.org/osde/publications/Unit/oea66e/begin.htm. Plate, E. J. (2007). Flood Risk Management for Setting Priorities in Decision Making. In: Extreme Hydrological Events: New Concepts for Security. Vasiliev, O.F., Van Gelder, P.H.A.J.M., Plate, E.J. and Bolgov, M.V. (eds). Vol. 78, part 1, Springer Netherlands, New York, 21-44. Pradhan, B. (2009). Flood susceptible mapping and risk area delineation using logistic regression, GIS and remote sensing. Journal of Spatial Hydrology. Vol. 9, No.2, 1-18. Ramlal, B. & Baban, S. (2008). Developing a GIS based integrated approach to flood management in Trinidad, West Indies. Journal of Environmental Management, 88 (4), 1131–1140. Rango, A., Laliberte A. & Winters, C. (2008). Role of aerial photos in compiling a long-term remote sensing data set. J. Appl. Remote Sens., Vol. 2, Issue 1 Shanley, L. A., Bellovary, T., Lulloff, A. & Schwoegler-Boos, P. A. L. (2006). GIS Data Sharing and Flood Hazards in Wisconsin. Wisconsin Land Information Association, Wisconsin. Available online: www.wlia.org/resources/datasharingfloods.pdf. Last accessed 15 May 2010. United States General Accounting Office (GAO) (2004). Flood Map Modernization. Report GAO-04-417. http://www.gao.gov/cgi-bin/getrpt?GAO-04-417. USGS. (2007). Science Topics. Floods. The United States Geological Survey. Available online: http://www.usgs.gov/ (Last accessed on 25 April 2010). van der Sande, C. J., de Jong, S. M. & de Roo A. P. J. (2003). A segmentation and classification approach of IKONOS-2 imagery for land cover mapping to assist flood risk and flood damage assessment. International Journal of Applied Earth Observation and Geoinformation, Volume 4, Issue 3, Pages 217-229 Van Westen, C. J. (2002). Remote Sensing and GIS for natural disaster management. In A. Skidmore (ed.), Environmental Modelling with GIS and Remote Sensing. Taylor & Francis, London. Wallingford, H. R. (2007). GIS-based Multicriteria Analysis as Decision Support in Flood Risk Management. Report number T10-07-07, FLOODsite Consortium, UK. Available on: www.floodsite.net (Last accessed on 25 April 2010) Wilson, M. D. & Atkinson, P. M. (2003). A comparison of remotely sensed elevation data sets for flood inundation modelling. Proceedings 7th International Conference on GeoComputation, Southampton, UK (on CD-ROM). World Water Assessment Programme (WWAP) (2006). The 2nd UN World Water Development Report: Water, a Shared Responsibility. UNESCO and Berghahn Books. Paris and New York. Yang, C., Huang, H., Wei, Y., Zhu H. & Zhuo, J. (2002). Rapidly Assessing the Flood Disaster by Using Remote Sensing and GIS. Proc. of IGARSS, Canada, 2880-2882.