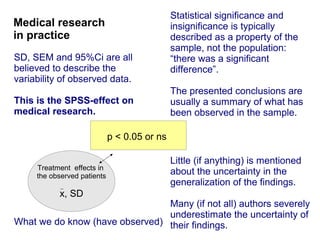
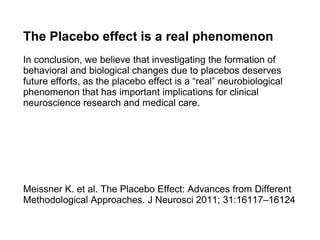
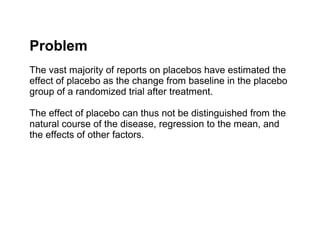
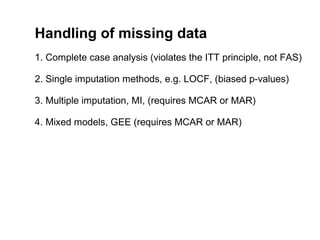
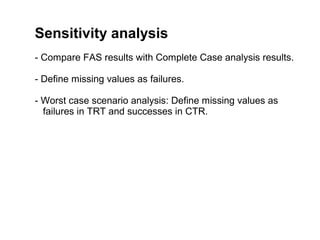
The SPSS-effect
on medical research
    Jonas Ranstam
Generalization
Medical research studies are typically performed for
the benefit of other subjects than the participants.
Medical research                 What we want to know (but never will)
and generalization

                                      Treatment effects in new patients

                                                   μ, σ


                      ^ (95% CI: μ - μ )
                      μ           ll  ul


    Treatment effects in
                                The best estimate and its uncertainty
    the observed patients
                                The uncertainty can in some cases
          x, SD                 also be presented as a probability
                                value
What we do know (have observed)
Medical research
in practice


                            p < 0.05 or ns

                                             Some weird stuff that no one
    Treatment effects in
    the observed patients                    understands but is necessary
                                             for getting manuscripts
          x, SD                              accepted

What we do know (have observed)
Statistical significance and
Medical research                              insignificance is typically
in practice                                   described as a property of the
                                              sample, not the population:
SD, SEM and 95%Ci are all                     “there was a significant
believed to describe the                      difference”.
variability of observed data.
                                              The presented conclusions are
This is the SPSS-effect on                    usually a summary of what has
medical research.                             been observed in the sample.

                             p < 0.05 or ns

                                              Little (if anything) is mentioned
     Treatment effects in
     the observed patients
                                              about the uncertainty in the
                                              generalization of the findings.
           x, SD
                                Many (if not all) authors severely
                                underestimate the uncertainty of
What we do know (have observed) their findings.
Statistics is about much more than
statistical significance

Important phenomena are neglected


Examples:

- Regression-to-the-mean (RTM)
- Consequences of missing data
The placebo effect and
regression to the mean
The Placebo effect is a real phenomenon
In conclusion, we believe that investigating the formation of
behavioral and biological changes due to placebos deserves
future efforts, as the placebo effect is a “real” neurobiological
phenomenon that has important implications for clinical
neuroscience research and medical care.


Meissner K. et al. The Placebo Effect: Advances from Different
Methodological Approaches. J Neurosci 2011; 31:16117–16124
Problem
The vast majority of reports on placebos have estimated the
effect of placebo as the change from baseline in the placebo
group of a randomized trial after treatment.

The effect of placebo can thus not be distinguished from the
natural course of the disease, regression to the mean, and
the effects of other factors.
Systematic review of the placebo effect
114 trials - 8525 patients

We included studies if patients were assigned randomly to a
placebo group or an untreated group (often there was also a
third group that received active treatment).
Publication bias?
There was significant heterogeneity among the trials with
continuous outcomes (P<0.001). The magnitude of the
effect of placebo decreased with increasing sample size
(P=0.05), indicating a possible bias related to the effects
of small trials.
Conclusion
In conclusion, we found little evidence that placebos in
general have powerful clinical effects.

Placebos had no significant pooled effect on subjective or
objective binary or continuous objective outcomes.

We found significant effects of placebo on continuous
subjective outcomes and for the treatment of pain but
also bias related to larger effects in small trials.

The use of placebo outside the aegis of a controlled,
properly designed clinical trial cannot be recommended.
Regression to the mean (RTM)
When an extreme group is selected from a population based
on the measurement of a particular variable, and a second
measurement is taken for the same group, the second mean
will be closer to the population mean than the first
measurement.
RTM
Any measurement taken consists of two components: the
‘true’ value plus a random error component. It is the random
error component that contributes to RTM. If the value of the
random error component is large, then the magnitude of the
corresponding RTM effects are increased.
Hypothetical example: SF-36 PF

Baseline: mean = 80, SD = 17
Follow up: mean = 80, SD = 17
p ≈ 1.0
Hypothetical example: SF-36 PF

Baseline: mean = 48.7, SD = 8.6
Follow up: mean = 59.2, SD = 16.7
p < 0.001
RTM - Easy to quantify
                     (for Normally distributed endpoints)


Barnett AG, van der Pols JC, Dobson AJ. Regression to the mean: what it is and how to deal with it. Int J
Epidemiol 2005;34:215–220
Hypothetical example of RTM in SF-36 PF

          Mean = 80, SD = 17, cut off = 60

           r     RTM
          0.0    28.4
          0.1    25.5
          0.2    22.7
          0.3    19.9
          0.4    17.0
          0.5    14.2
          0.6    11.3
          0.7     8.5
          0.8     5.7
          0.9     2.8
          1.0     0
RTM

Evaluation of a single groups’ development
over time should be avoided, or at least
include a comparison with the expected
RTM effect.
Examples
Diagnostic tests

New treatments

Public health efforts

Health care management

Clinical audits
Hospital comparisons
If one were a policy maker alert to the possibilities of using
RTM to ‘prove’ an initiative, one might target hospitals at
the bottom of the league table with an initiative, extra
resources, for example. RTM, combined with a floor effect,
will ensure that such a policy can be ‘proven’ to work.


Morton V, Torgerson DJ. Regression to the mean:
treatment effect without the intervention. J Eval Clin Pract
2005;11:59-65.
The consequences of
   missing values
A Randomized Trial

                                            Inclusion/exclusion criteria


                           RANDOMIZATION


                       TRT             CTR
                       TRT
                     baseline         baseline


Lost to follow up                                      Lost to follow up


  Missing data         TRT              CTR         Missing data
                     Follow up        Follow up
Study populations
Intention-to-treat (ITT)

Patients are analyzed according to randomization outcome
irrespective of received treatment or any protocol violation.

Per-protocol (PP)

The subgroup of the ITT population that has been treated
according to the study protocol.

Full Analysis Set (FAS)

The ITT population with exclusion of missing data.
Consequence of missing data
Precision

- reduced power
- variability

Validity

- comparability of treatment groups
- the representativity of the results
Missing data definitions
Missing outcome values

MCAR (missing completely at random)
- independent of both observed and unobserved variables.

MAR (missing at random)
- depend only on observed variables.

MNAR (missing not at random)
- depend on unobserved variables.
Handling of missing data
1. Complete case analysis (violates the ITT principle, not FAS)

2. Single imputation methods, e.g. LOCF, (biased p-values)

3. Multiple imputation, MI, (requires MCAR or MAR)

4. Mixed models, GEE (requires MCAR or MAR)
Sensitivity analysis
- Compare FAS results with Complete Case analysis results.

- Define missing values as failures.

- Worst case scenario analysis: Define missing values as
  failures in TRT and successes in CTR.

The SPSS-effect on medical research

  • 1.
    The SPSS-effect on medicalresearch Jonas Ranstam
  • 2.
    Generalization Medical research studiesare typically performed for the benefit of other subjects than the participants.
  • 3.
    Medical research What we want to know (but never will) and generalization Treatment effects in new patients μ, σ ^ (95% CI: μ - μ ) μ ll ul Treatment effects in The best estimate and its uncertainty the observed patients The uncertainty can in some cases x, SD also be presented as a probability value What we do know (have observed)
  • 4.
    Medical research in practice p < 0.05 or ns Some weird stuff that no one Treatment effects in the observed patients understands but is necessary for getting manuscripts x, SD accepted What we do know (have observed)
  • 5.
    Statistical significance and Medicalresearch insignificance is typically in practice described as a property of the sample, not the population: SD, SEM and 95%Ci are all “there was a significant believed to describe the difference”. variability of observed data. The presented conclusions are This is the SPSS-effect on usually a summary of what has medical research. been observed in the sample. p < 0.05 or ns Little (if anything) is mentioned Treatment effects in the observed patients about the uncertainty in the generalization of the findings. x, SD Many (if not all) authors severely underestimate the uncertainty of What we do know (have observed) their findings.
  • 6.
    Statistics is aboutmuch more than statistical significance Important phenomena are neglected Examples: - Regression-to-the-mean (RTM) - Consequences of missing data
  • 7.
    The placebo effectand regression to the mean
  • 8.
    The Placebo effectis a real phenomenon In conclusion, we believe that investigating the formation of behavioral and biological changes due to placebos deserves future efforts, as the placebo effect is a “real” neurobiological phenomenon that has important implications for clinical neuroscience research and medical care. Meissner K. et al. The Placebo Effect: Advances from Different Methodological Approaches. J Neurosci 2011; 31:16117–16124
  • 11.
    Problem The vast majorityof reports on placebos have estimated the effect of placebo as the change from baseline in the placebo group of a randomized trial after treatment. The effect of placebo can thus not be distinguished from the natural course of the disease, regression to the mean, and the effects of other factors.
  • 13.
    Systematic review ofthe placebo effect 114 trials - 8525 patients We included studies if patients were assigned randomly to a placebo group or an untreated group (often there was also a third group that received active treatment).
  • 16.
    Publication bias? There wassignificant heterogeneity among the trials with continuous outcomes (P<0.001). The magnitude of the effect of placebo decreased with increasing sample size (P=0.05), indicating a possible bias related to the effects of small trials.
  • 17.
    Conclusion In conclusion, wefound little evidence that placebos in general have powerful clinical effects. Placebos had no significant pooled effect on subjective or objective binary or continuous objective outcomes. We found significant effects of placebo on continuous subjective outcomes and for the treatment of pain but also bias related to larger effects in small trials. The use of placebo outside the aegis of a controlled, properly designed clinical trial cannot be recommended.
  • 18.
    Regression to themean (RTM) When an extreme group is selected from a population based on the measurement of a particular variable, and a second measurement is taken for the same group, the second mean will be closer to the population mean than the first measurement.
  • 19.
    RTM Any measurement takenconsists of two components: the ‘true’ value plus a random error component. It is the random error component that contributes to RTM. If the value of the random error component is large, then the magnitude of the corresponding RTM effects are increased.
  • 20.
    Hypothetical example: SF-36PF Baseline: mean = 80, SD = 17 Follow up: mean = 80, SD = 17 p ≈ 1.0
  • 21.
    Hypothetical example: SF-36PF Baseline: mean = 48.7, SD = 8.6 Follow up: mean = 59.2, SD = 16.7 p < 0.001
  • 22.
    RTM - Easyto quantify (for Normally distributed endpoints) Barnett AG, van der Pols JC, Dobson AJ. Regression to the mean: what it is and how to deal with it. Int J Epidemiol 2005;34:215–220
  • 23.
    Hypothetical example ofRTM in SF-36 PF Mean = 80, SD = 17, cut off = 60 r RTM 0.0 28.4 0.1 25.5 0.2 22.7 0.3 19.9 0.4 17.0 0.5 14.2 0.6 11.3 0.7 8.5 0.8 5.7 0.9 2.8 1.0 0
  • 24.
    RTM Evaluation of asingle groups’ development over time should be avoided, or at least include a comparison with the expected RTM effect.
  • 25.
    Examples Diagnostic tests New treatments Publichealth efforts Health care management Clinical audits
  • 26.
    Hospital comparisons If onewere a policy maker alert to the possibilities of using RTM to ‘prove’ an initiative, one might target hospitals at the bottom of the league table with an initiative, extra resources, for example. RTM, combined with a floor effect, will ensure that such a policy can be ‘proven’ to work. Morton V, Torgerson DJ. Regression to the mean: treatment effect without the intervention. J Eval Clin Pract 2005;11:59-65.
  • 27.
    The consequences of missing values
  • 28.
    A Randomized Trial Inclusion/exclusion criteria RANDOMIZATION TRT CTR TRT baseline baseline Lost to follow up Lost to follow up Missing data TRT CTR Missing data Follow up Follow up
  • 29.
    Study populations Intention-to-treat (ITT) Patientsare analyzed according to randomization outcome irrespective of received treatment or any protocol violation. Per-protocol (PP) The subgroup of the ITT population that has been treated according to the study protocol. Full Analysis Set (FAS) The ITT population with exclusion of missing data.
  • 30.
    Consequence of missingdata Precision - reduced power - variability Validity - comparability of treatment groups - the representativity of the results
  • 31.
    Missing data definitions Missingoutcome values MCAR (missing completely at random) - independent of both observed and unobserved variables. MAR (missing at random) - depend only on observed variables. MNAR (missing not at random) - depend on unobserved variables.
  • 32.
    Handling of missingdata 1. Complete case analysis (violates the ITT principle, not FAS) 2. Single imputation methods, e.g. LOCF, (biased p-values) 3. Multiple imputation, MI, (requires MCAR or MAR) 4. Mixed models, GEE (requires MCAR or MAR)
  • 33.
    Sensitivity analysis - CompareFAS results with Complete Case analysis results. - Define missing values as failures. - Worst case scenario analysis: Define missing values as failures in TRT and successes in CTR.