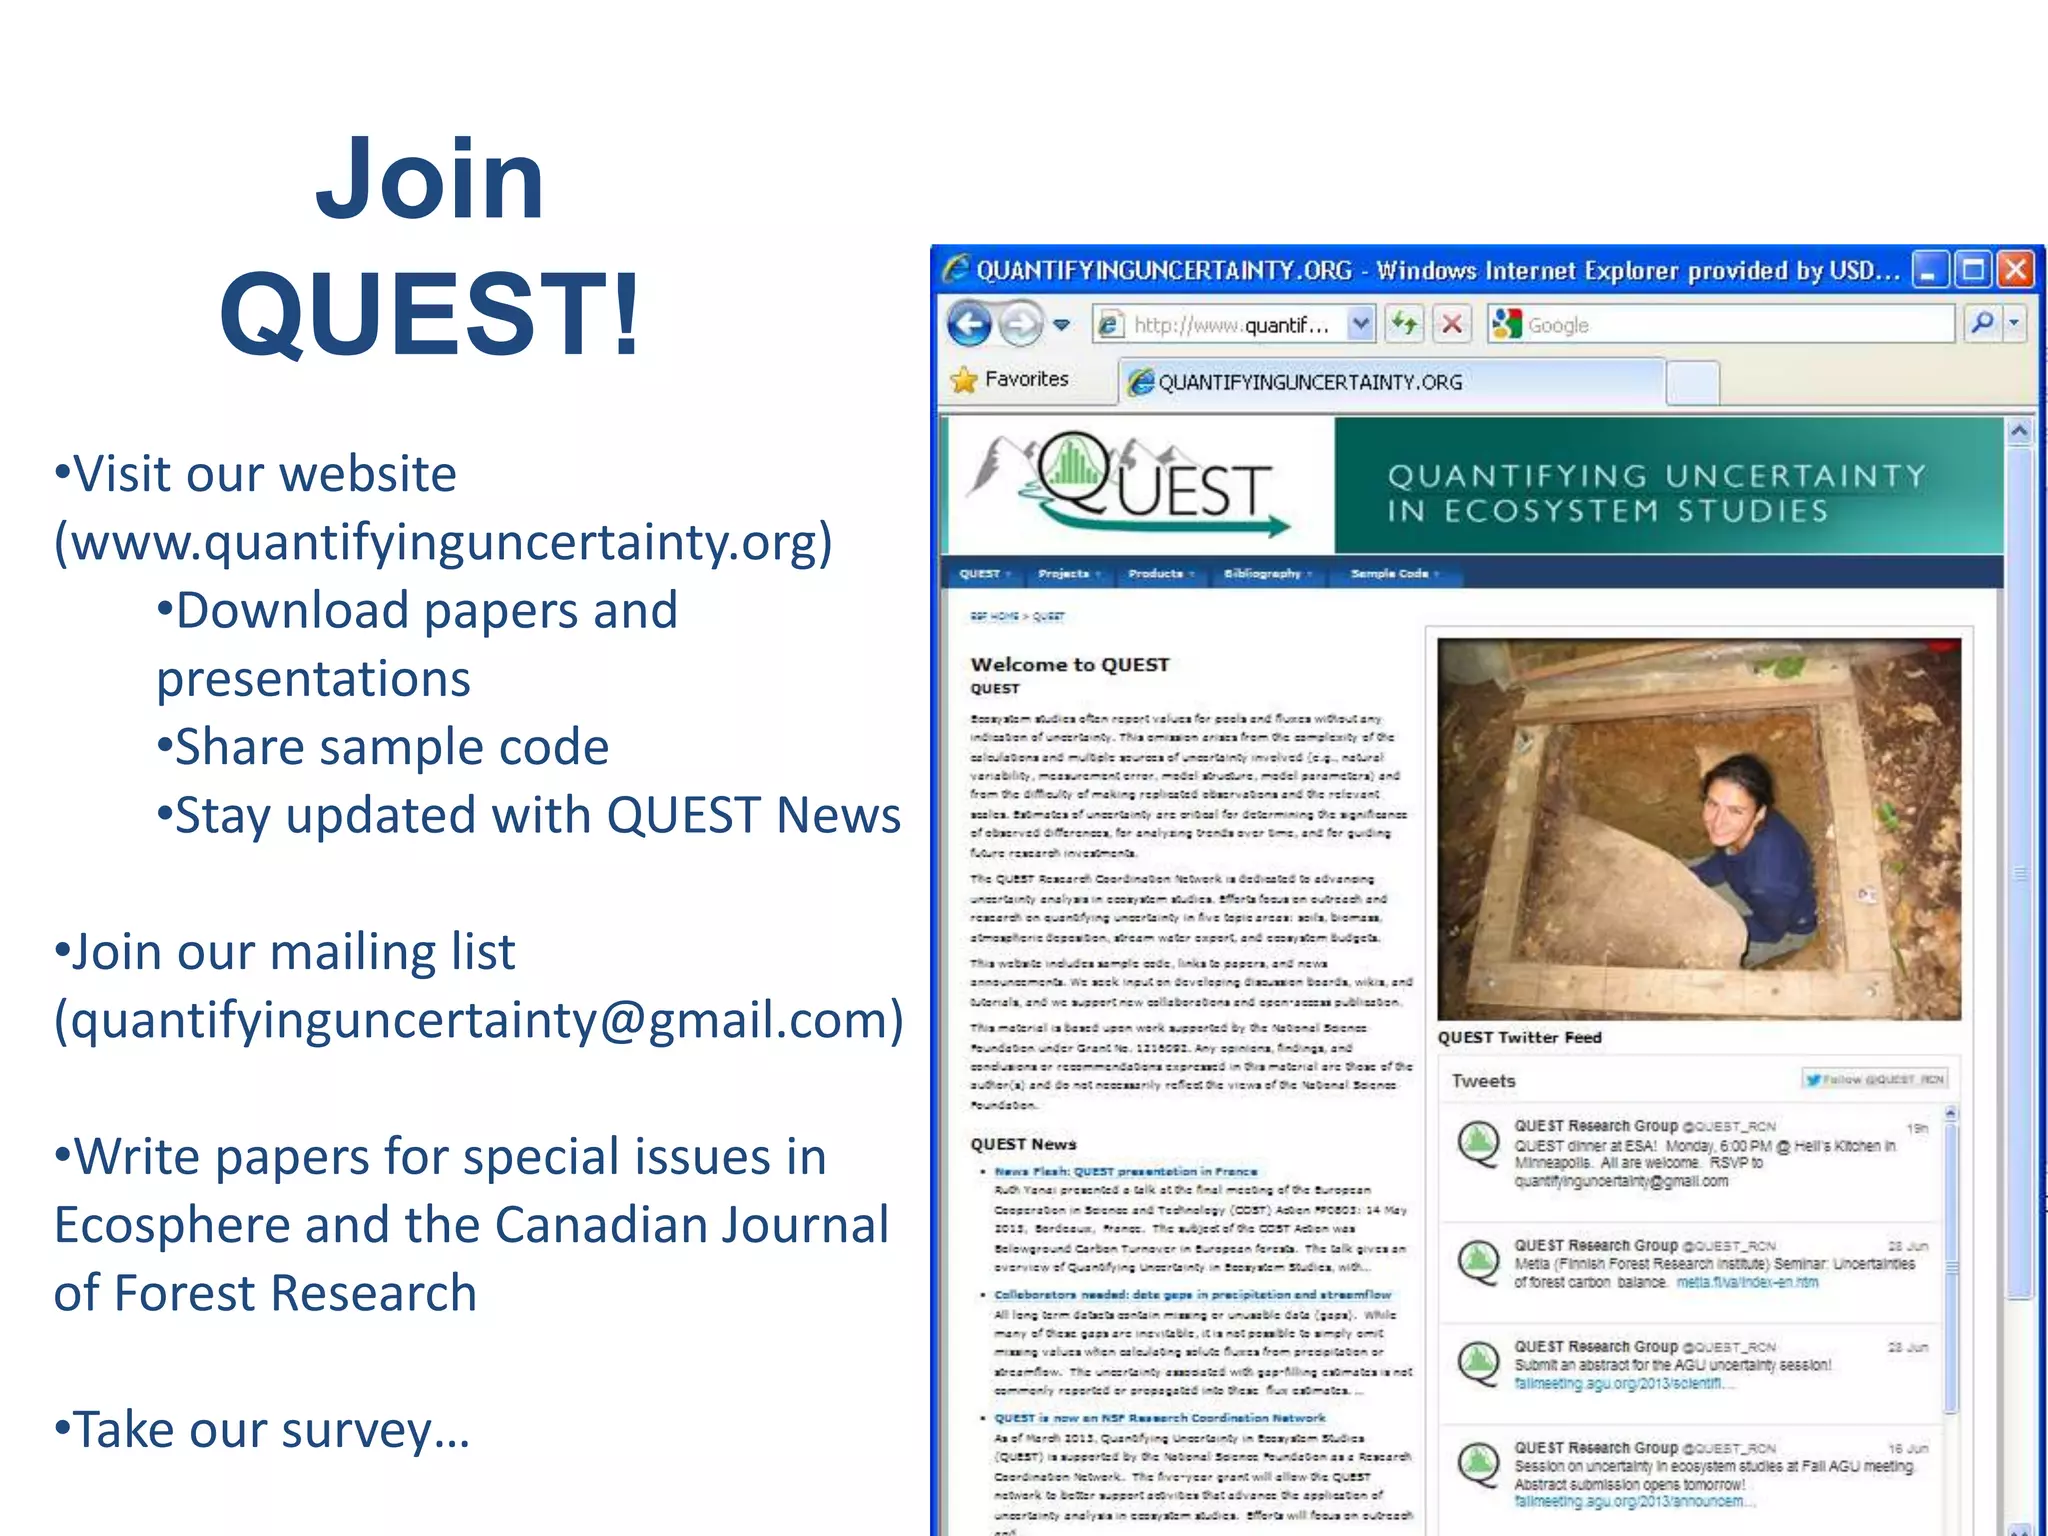
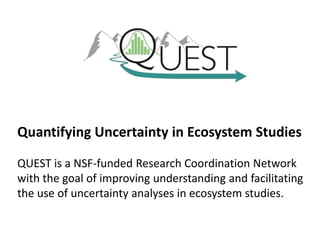
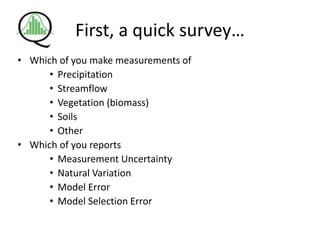
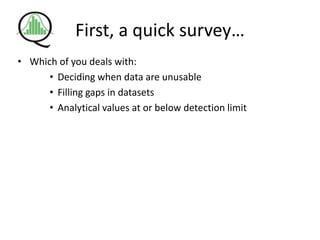
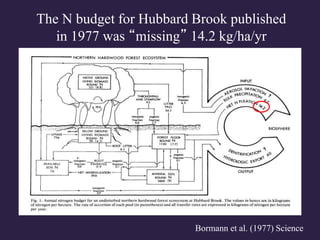
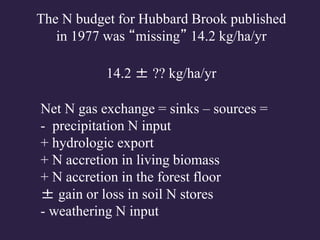
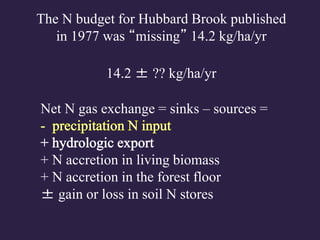
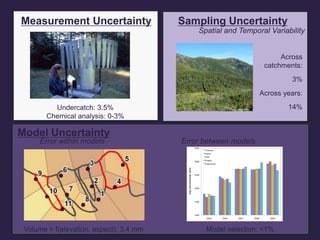
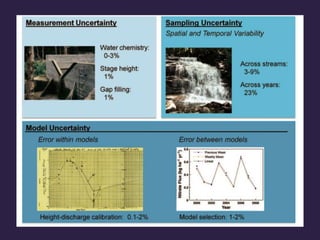
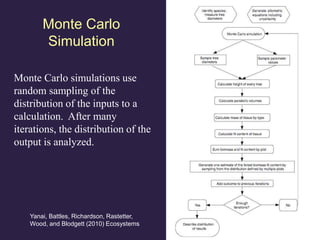
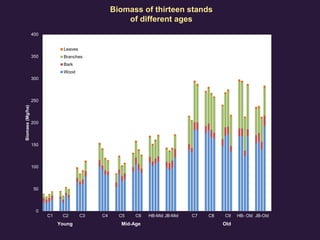
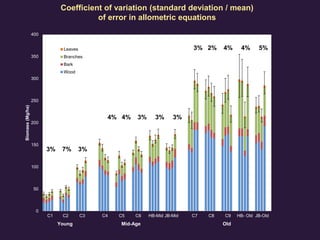
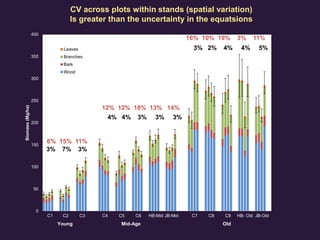
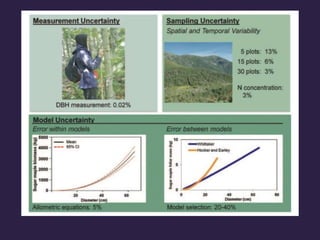
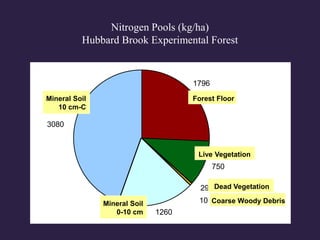
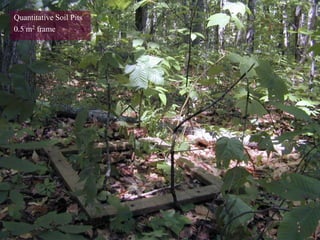
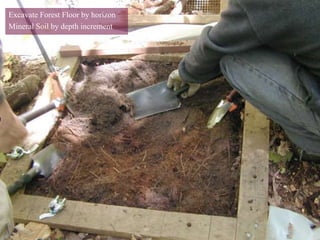
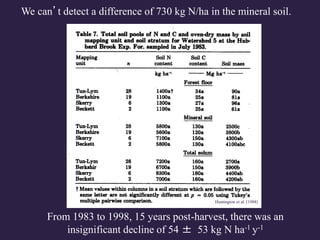
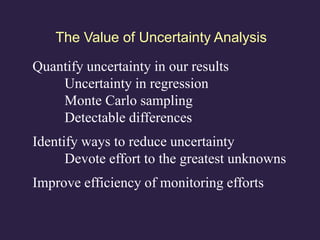
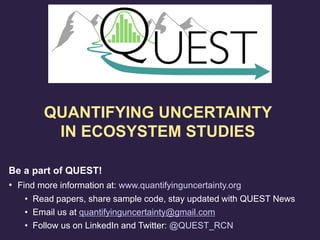
•Visit our website
(www.quantifyinguncertainty.org)
•Download papers and
presentations
•Share sample code
•Stay updated with QUEST News
•Join our mailing list
(quantifyinguncertainty@gmail.com)
•Write papers for special issues in
Ecosphere and the Canadian Journal
of Forest Research
•Take our survey…
Join
QUEST!
Quantifying Uncertainty in Ecosystem Studies
QUEST is a NSF-funded Research Coordination Network
with the goal of improving understanding and facilitating
the use of uncertainty analyses in ecosystem studies.
First, a quick survey…
• Which of you make measurements of
• Precipitation
• Streamflow
• Vegetation (biomass)
• Soils
• Other
• Which of you reports
• Measurement Uncertainty
• Natural Variation
• Model Error
• Model Selection Error
First, a quick survey…
• Which of you deals with:
• Deciding when data are unusable
• Filling gaps in datasets
• Analytical values at or below detection limit
About this Working Group
Brief Presentations, each followed by discussion
• Ruth Yanai: intro to QUEST: uncertainty in ecosystem budgets
• Craig See: Streamflow Gaps: Why they occur and what we can do about it
• John Campbell: Uncertainty in net hydrologic flux of calcium
• Melissa Slater: Spatial patterns of precipitation in complex terrain
• Josh Roberti: Connecting uncertainty estimates and QA/QC methods
• Carrie Levine: Bayesian hierarchical analysis of demographic processes
Discussion of more general issues
Take our survey! Tweeted at www.quantifyinguncertainty.org
A Brief History of QUEST
1983 Yanai started at HBR: Ecosystem Budgets have no Error
2008 Yanai commits to addressing error in a symposium.
Ed Rastetter helps.
2009 Battles and Richardson join in publication of “Error for
Dummies” paper in Ecosystems (Yanai et al. 2010)
2010 Hubbard Brook Committee of Scientists addresses
uncertainty. Mark Green and John Campbell join.
2011 John Campbell names QUEST. Carrie Levine designs the
logo
2011, 2012 LTER Working Groups address streamflow, precipitation
2013 QUEST funded by NSF as an RCN for 5 years
2012 - Sessions at LTER ASM, ESA, AGU, ESA, IUFRO, ASM…
UNCERTAINTY
Natural Variability
Spatial Variability
Temporal Variability
Knowledge Uncertainty
Measurement Error
Model Error
Types of uncertainty commonly
encountered in ecosystem studies
Adapted from Harmon et al. (2007)
Bormann et al. (1977) Science
How can we assign confidence in ecosystem
nutrient fluxes?
Bormann et al. (1977) Science
The N budget for Hubbard Brook published
in 1977 was “missing” 14.2 kg/ha/yr
Net N gas exchange = sinks – sources =
- precipitation N input
+ hydrologic export
+ N accretion in living biomass
+ N accretion in the forest floor
± gain or loss in soil N stores
- weathering N input
The N budget for Hubbard Brook published
in 1977 was “missing” 14.2 kg/ha/yr
14.2 ± ?? kg/ha/yr
Net N gas exchange = sinks – sources =
+ N accretion in living biomass
+ N accretion in the forest floor
± gain or loss in soil N stores
The N budget for Hubbard Brook published
in 1977 was “missing” 14.2 kg/ha/yr
14.2 ± ?? kg/ha/yr
Measurement Uncertainty Sampling Uncertainty
Spatial and Temporal Variability
Model Uncertainty
Error within models Error between models
Volume = f(elevation, aspect): 3.4 mm
Undercatch: 3.5%
Chemical analysis: 0-3%
Model selection: <1%
Across
catchments:
3%
Across years:
14%
We tested the effect of sampling intensity by sequentially omitting
individual precipitation gauges.
Estimates of annual precipitation volume varied little until five or more
of the eleven precipitation gauges were ignored.
Net N gas exchange = sinks – sources =
- precipitation N input (± 1.3)
+ hydrologic export
+ N accretion in living biomass
+ N accretion in the forest floor
± gain or loss in soil N stores
The N budget for Hubbard Brook published
in 1977 was “missing” 14.2 kg/ha/yr
14.2 ± ?? kg/ha/yr
Net N gas exchange = sinks – sources =
- precipitation N input (± 1.3)
+ N accretion in living biomass
+ N accretion in the forest floor
± gain or loss in soil N stores
The N budget for Hubbard Brook published
in 1977 was “missing” 14.2 kg/ha/yr
14.2 ± ?? kg/ha/yr
Net N gas exchange = sinks – sources =
- precipitation N input (± 1.3)
+ hydrologic export (± 0.5)
+ N accretion in living biomass
+ N accretion in the forest floor
± gain or loss in soil N stores
The N budget for Hubbard Brook published
in 1977 was “missing” 14.2 kg/ha/yr
14.2 ± ?? kg/ha/yr
Net N gas exchange = sinks – sources =
- precipitation N input (± 1.3)
+ hydrologic export (± 0.5)
+ N accretion in living biomass
+ N accretion in the forest floor
± gain or loss in soil N stores
The N budget for Hubbard Brook published
in 1977 was “missing” 14.2 kg/ha/yr
14.2 ± ?? kg/ha/yr
Monte Carlo
Simulation
Yanai, Battles, Richardson, Rastetter,
Wood, and Blodgett (2010) Ecosystems
Monte Carlo simulations use
random sampling of the
distribution of the inputs to a
calculation. After many
iterations, the distribution of the
output is analyzed.
0
50
100
150
200
250
300
350
400
Biomass(Mg/ha)
Leaves
Branches
Bark
Wood
C1 C2 C3 C4 C5 C6 HB-Mid JB-Mid C7 C8 C9 HB- Old JB-Old
Young Mid-Age Old
Biomass of thirteen stands
of different ages
0
50
100
150
200
250
300
350
400
Biomass(Mg/ha)
Leaves
Branches
Bark
Wood
C1 C2 C3 C4 C5 C6 HB-Mid JB-Mid C7 C8 C9 HB- Old JB-Old
3% 7% 3%
4% 4% 3% 3% 3%
3% 2% 4% 4% 5%
Coefficient of variation (standard deviation / mean)
of error in allometric equations
Young Mid-Age Old
0
50
100
150
200
250
300
350
400
Biomass(Mg/ha)
Leaves
Branches
Bark
Wood
C1 C2 C3 C4 C5 C6 HB-Mid JB-Mid C7 C8 C9 HB- Old JB-Old
Young Mid-Age Old
3% 7% 3%
4% 4% 3% 3% 3%
3% 2% 4% 4% 5%
CV across plots within stands (spatial variation)
Is greater than the uncertainty in the equatsions
6% 15% 11%
12% 12% 18% 13% 14%
16% 10% 19% 3% 11%
Net N gas exchange = sinks – sources =
- precipitation N input (± 1.3)
+ hydrologic export (± 0.5)
+ N accretion in living biomass (± 1)
+ N accretion in the forest floor
± gain or loss in soil N stores
The N budget for Hubbard Brook published
in 1977 was “missing” 14.2 kg/ha/yr
14.2 ± ?? kg/ha/yr
Net N gas exchange = sinks – sources =
- precipitation N input (± 1.3)
+ hydrologic export (± 0.5)
+ N accretion in living biomass (± 1)
+ N accretion in the forest floor
± gain or loss in soil N stores
The N budget for Hubbard Brook published
in 1977 was “missing” 14.2 kg/ha/yr
14.2 ± ?? kg/ha/yr
Oi
Oe
Oa
E
Bh
Bs
Forest
Floor
Mineral
Soil
}
}
Excavation of a forest
floor block (10 x 10 cm)
Nitrogen in the Forest Floor
Hubbard Brook Experimental Forest
y = 0.0002x - 0.1619
R2
= 0.0109
0
0.05
0.1
0.15
0.2
0.25
1975 1980 1985 1990 1995 2000 2005
ForestFloorN(kg/m2)
Nitrogen in the Forest Floor
Hubbard Brook Experimental Forest
y = 0.0002x - 0.1619
R2
= 0.0109
0
0.05
0.1
0.15
0.2
0.25
1975 1980 1985 1990 1995 2000 2005
ForestFloorN(kg/m2)
The change is insignificant (P = 0.84).
The uncertainty in the slope is ± 22 kg/ha/yr.
Net N gas exchange = sinks – sources =
- precipitation N input (± 1.3)
+ hydrologic export (± 0.5)
+ N accretion in living biomass (± 1)
+ N accretion in the forest floor (± 22)
± gain or loss in soil N stores
The N budget for Hubbard Brook published
in 1977 was “missing” 14.2 kg/ha/yr
14.2 ± ?? kg/ha/yr
Nitrogen Pools (kg/ha)
Hubbard Brook Experimental Forest
1796
29
10
1260
750
3080
Forest Floor
Live Vegetation
Coarse Woody Debris
Mineral Soil
10 cm-C
Dead Vegetation
Mineral Soil
0-10 cm
Quantitative Soil Pits
0.5 m2 frame
Excavate Forest Floor by horizon
Mineral Soil by depth increment
We can’t detect a difference of 730 kg N/ha in the mineral soil.
From 1983 to 1998, 15 years post-harvest, there was an
insignificant decline of 54 ± 53 kg N ha-1 y-1
Huntington et al. (1988)
Net N gas exchange = sinks – sources =
- precipitation N input (± 1.3)
+ hydrologic export (± 0.5)
+ N accretion in living biomass (± 1)
+ N accretion in the forest floor (± 22)
± gain or loss in soil N stores (± 53)
The N budget for Hubbard Brook published
in 1977 was “missing” 14.2 kg/ha/yr
14.2 ± ?? kg/ha/yr
Net N gas exchange = sinks – sources =
- precipitation N input (± 1.3)
+ hydrologic export (± 0.5)
+ N accretion in living biomass (± 1)
+ N accretion in the forest floor (± 22)
± gain or loss in soil N stores (± 53)
The N budget for Hubbard Brook published
in 1977 was “missing” 14.2 kg/ha/yr
14.2 ± 57 kg/ha/yr
The Value of Uncertainty Analysis
Quantify uncertainty in our results
Uncertainty in regression
Monte Carlo sampling
Detectable differences
Identify ways to reduce uncertainty
Devote effort to the greatest unknowns
Improve efficiency of monitoring efforts
Be a part of QUEST!
• Find more information at: www.quantifyinguncertainty.org
• Read papers, share sample code, stay updated with QUEST News
• Email us at quantifyinguncertainty@gmail.com
• Follow us on LinkedIn and Twitter: @QUEST_RCN
QUANTIFYING UNCERTAINTY
IN ECOSYSTEM STUDIES

Yanai quest asm 2015 part 1

  • 1.
    •Visit our website (www.quantifyinguncertainty.org) •Downloadpapers and presentations •Share sample code •Stay updated with QUEST News •Join our mailing list (quantifyinguncertainty@gmail.com) •Write papers for special issues in Ecosphere and the Canadian Journal of Forest Research •Take our survey… Join QUEST!
  • 2.
    Quantifying Uncertainty inEcosystem Studies QUEST is a NSF-funded Research Coordination Network with the goal of improving understanding and facilitating the use of uncertainty analyses in ecosystem studies.
  • 3.
    First, a quicksurvey… • Which of you make measurements of • Precipitation • Streamflow • Vegetation (biomass) • Soils • Other • Which of you reports • Measurement Uncertainty • Natural Variation • Model Error • Model Selection Error
  • 4.
    First, a quicksurvey… • Which of you deals with: • Deciding when data are unusable • Filling gaps in datasets • Analytical values at or below detection limit
  • 5.
    About this WorkingGroup Brief Presentations, each followed by discussion • Ruth Yanai: intro to QUEST: uncertainty in ecosystem budgets • Craig See: Streamflow Gaps: Why they occur and what we can do about it • John Campbell: Uncertainty in net hydrologic flux of calcium • Melissa Slater: Spatial patterns of precipitation in complex terrain • Josh Roberti: Connecting uncertainty estimates and QA/QC methods • Carrie Levine: Bayesian hierarchical analysis of demographic processes Discussion of more general issues Take our survey! Tweeted at www.quantifyinguncertainty.org
  • 6.
    A Brief Historyof QUEST 1983 Yanai started at HBR: Ecosystem Budgets have no Error 2008 Yanai commits to addressing error in a symposium. Ed Rastetter helps. 2009 Battles and Richardson join in publication of “Error for Dummies” paper in Ecosystems (Yanai et al. 2010) 2010 Hubbard Brook Committee of Scientists addresses uncertainty. Mark Green and John Campbell join. 2011 John Campbell names QUEST. Carrie Levine designs the logo 2011, 2012 LTER Working Groups address streamflow, precipitation 2013 QUEST funded by NSF as an RCN for 5 years 2012 - Sessions at LTER ASM, ESA, AGU, ESA, IUFRO, ASM…
  • 7.
    UNCERTAINTY Natural Variability Spatial Variability TemporalVariability Knowledge Uncertainty Measurement Error Model Error Types of uncertainty commonly encountered in ecosystem studies Adapted from Harmon et al. (2007)
  • 8.
    Bormann et al.(1977) Science How can we assign confidence in ecosystem nutrient fluxes?
  • 9.
    Bormann et al.(1977) Science The N budget for Hubbard Brook published in 1977 was “missing” 14.2 kg/ha/yr
  • 10.
    Net N gasexchange = sinks – sources = - precipitation N input + hydrologic export + N accretion in living biomass + N accretion in the forest floor ± gain or loss in soil N stores - weathering N input The N budget for Hubbard Brook published in 1977 was “missing” 14.2 kg/ha/yr 14.2 ± ?? kg/ha/yr
  • 11.
    Net N gasexchange = sinks – sources = + N accretion in living biomass + N accretion in the forest floor ± gain or loss in soil N stores The N budget for Hubbard Brook published in 1977 was “missing” 14.2 kg/ha/yr 14.2 ± ?? kg/ha/yr
  • 12.
    Measurement Uncertainty SamplingUncertainty Spatial and Temporal Variability Model Uncertainty Error within models Error between models Volume = f(elevation, aspect): 3.4 mm Undercatch: 3.5% Chemical analysis: 0-3% Model selection: <1% Across catchments: 3% Across years: 14%
  • 14.
    We tested theeffect of sampling intensity by sequentially omitting individual precipitation gauges. Estimates of annual precipitation volume varied little until five or more of the eleven precipitation gauges were ignored.
  • 15.
    Net N gasexchange = sinks – sources = - precipitation N input (± 1.3) + hydrologic export + N accretion in living biomass + N accretion in the forest floor ± gain or loss in soil N stores The N budget for Hubbard Brook published in 1977 was “missing” 14.2 kg/ha/yr 14.2 ± ?? kg/ha/yr
  • 16.
    Net N gasexchange = sinks – sources = - precipitation N input (± 1.3) + N accretion in living biomass + N accretion in the forest floor ± gain or loss in soil N stores The N budget for Hubbard Brook published in 1977 was “missing” 14.2 kg/ha/yr 14.2 ± ?? kg/ha/yr
  • 18.
    Net N gasexchange = sinks – sources = - precipitation N input (± 1.3) + hydrologic export (± 0.5) + N accretion in living biomass + N accretion in the forest floor ± gain or loss in soil N stores The N budget for Hubbard Brook published in 1977 was “missing” 14.2 kg/ha/yr 14.2 ± ?? kg/ha/yr
  • 19.
    Net N gasexchange = sinks – sources = - precipitation N input (± 1.3) + hydrologic export (± 0.5) + N accretion in living biomass + N accretion in the forest floor ± gain or loss in soil N stores The N budget for Hubbard Brook published in 1977 was “missing” 14.2 kg/ha/yr 14.2 ± ?? kg/ha/yr
  • 20.
    Monte Carlo Simulation Yanai, Battles,Richardson, Rastetter, Wood, and Blodgett (2010) Ecosystems Monte Carlo simulations use random sampling of the distribution of the inputs to a calculation. After many iterations, the distribution of the output is analyzed.
  • 21.
    0 50 100 150 200 250 300 350 400 Biomass(Mg/ha) Leaves Branches Bark Wood C1 C2 C3C4 C5 C6 HB-Mid JB-Mid C7 C8 C9 HB- Old JB-Old Young Mid-Age Old Biomass of thirteen stands of different ages
  • 22.
    0 50 100 150 200 250 300 350 400 Biomass(Mg/ha) Leaves Branches Bark Wood C1 C2 C3C4 C5 C6 HB-Mid JB-Mid C7 C8 C9 HB- Old JB-Old 3% 7% 3% 4% 4% 3% 3% 3% 3% 2% 4% 4% 5% Coefficient of variation (standard deviation / mean) of error in allometric equations Young Mid-Age Old
  • 23.
    0 50 100 150 200 250 300 350 400 Biomass(Mg/ha) Leaves Branches Bark Wood C1 C2 C3C4 C5 C6 HB-Mid JB-Mid C7 C8 C9 HB- Old JB-Old Young Mid-Age Old 3% 7% 3% 4% 4% 3% 3% 3% 3% 2% 4% 4% 5% CV across plots within stands (spatial variation) Is greater than the uncertainty in the equatsions 6% 15% 11% 12% 12% 18% 13% 14% 16% 10% 19% 3% 11%
  • 25.
    Net N gasexchange = sinks – sources = - precipitation N input (± 1.3) + hydrologic export (± 0.5) + N accretion in living biomass (± 1) + N accretion in the forest floor ± gain or loss in soil N stores The N budget for Hubbard Brook published in 1977 was “missing” 14.2 kg/ha/yr 14.2 ± ?? kg/ha/yr
  • 26.
    Net N gasexchange = sinks – sources = - precipitation N input (± 1.3) + hydrologic export (± 0.5) + N accretion in living biomass (± 1) + N accretion in the forest floor ± gain or loss in soil N stores The N budget for Hubbard Brook published in 1977 was “missing” 14.2 kg/ha/yr 14.2 ± ?? kg/ha/yr
  • 27.
  • 28.
    Excavation of aforest floor block (10 x 10 cm)
  • 29.
    Nitrogen in theForest Floor Hubbard Brook Experimental Forest y = 0.0002x - 0.1619 R2 = 0.0109 0 0.05 0.1 0.15 0.2 0.25 1975 1980 1985 1990 1995 2000 2005 ForestFloorN(kg/m2)
  • 30.
    Nitrogen in theForest Floor Hubbard Brook Experimental Forest y = 0.0002x - 0.1619 R2 = 0.0109 0 0.05 0.1 0.15 0.2 0.25 1975 1980 1985 1990 1995 2000 2005 ForestFloorN(kg/m2) The change is insignificant (P = 0.84). The uncertainty in the slope is ± 22 kg/ha/yr.
  • 31.
    Net N gasexchange = sinks – sources = - precipitation N input (± 1.3) + hydrologic export (± 0.5) + N accretion in living biomass (± 1) + N accretion in the forest floor (± 22) ± gain or loss in soil N stores The N budget for Hubbard Brook published in 1977 was “missing” 14.2 kg/ha/yr 14.2 ± ?? kg/ha/yr
  • 32.
    Net N gasexchange = sinks – sources = - precipitation N input (± 1.3) + hydrologic export (± 0.5) + N accretion in living biomass (± 1) + N accretion in the forest floor (± 22) ± gain or loss in soil N stores The N budget for Hubbard Brook published in 1977 was “missing” 14.2 kg/ha/yr 14.2 ± ?? kg/ha/yr
  • 33.
    Nitrogen Pools (kg/ha) HubbardBrook Experimental Forest 1796 29 10 1260 750 3080 Forest Floor Live Vegetation Coarse Woody Debris Mineral Soil 10 cm-C Dead Vegetation Mineral Soil 0-10 cm
  • 34.
  • 35.
    Excavate Forest Floorby horizon Mineral Soil by depth increment
  • 36.
    We can’t detecta difference of 730 kg N/ha in the mineral soil. From 1983 to 1998, 15 years post-harvest, there was an insignificant decline of 54 ± 53 kg N ha-1 y-1 Huntington et al. (1988)
  • 37.
    Net N gasexchange = sinks – sources = - precipitation N input (± 1.3) + hydrologic export (± 0.5) + N accretion in living biomass (± 1) + N accretion in the forest floor (± 22) ± gain or loss in soil N stores (± 53) The N budget for Hubbard Brook published in 1977 was “missing” 14.2 kg/ha/yr 14.2 ± ?? kg/ha/yr
  • 38.
    Net N gasexchange = sinks – sources = - precipitation N input (± 1.3) + hydrologic export (± 0.5) + N accretion in living biomass (± 1) + N accretion in the forest floor (± 22) ± gain or loss in soil N stores (± 53) The N budget for Hubbard Brook published in 1977 was “missing” 14.2 kg/ha/yr 14.2 ± 57 kg/ha/yr
  • 39.
    The Value ofUncertainty Analysis Quantify uncertainty in our results Uncertainty in regression Monte Carlo sampling Detectable differences Identify ways to reduce uncertainty Devote effort to the greatest unknowns Improve efficiency of monitoring efforts
  • 40.
    Be a partof QUEST! • Find more information at: www.quantifyinguncertainty.org • Read papers, share sample code, stay updated with QUEST News • Email us at quantifyinguncertainty@gmail.com • Follow us on LinkedIn and Twitter: @QUEST_RCN QUANTIFYING UNCERTAINTY IN ECOSYSTEM STUDIES