This document provides an overview of forest ecology concepts across 10 units. It covers topics such as the definition of forest ecology, components and functions of forest ecosystems, biomass and productivity in forest ecosystems. Some key points:
- Forest ecology is the study of forest ecosystems, which consist of biotic components (plants, animals) interacting with abiotic components (soil, climate) of the environment.
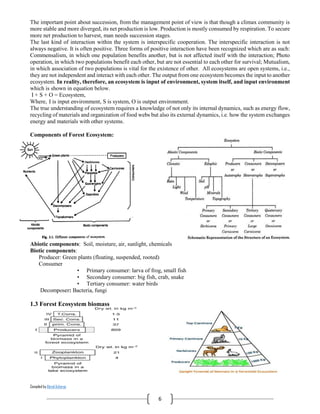
- A forest ecosystem's structure includes its vertical (canopy layers) and horizontal (patchiness) organization. Its functions include energy flow, nutrient cycling, and self-regulation.
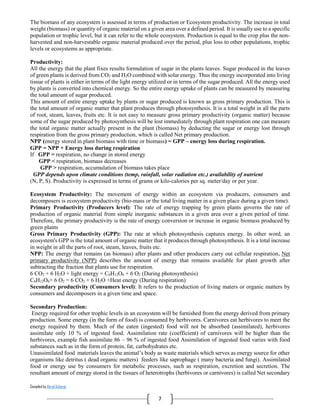
- Primary productivity refers to energy captured by plants through photosynthesis. Net primary productivity is the energy remaining after plant respiration. Secondary productivity


![Compiled by Abiral Acharya
44
Nutrient Return (Decomposition)
Decomposition of litter and the release of nutrients is often the critical link in the forest biogeochemical cycle.
The variation in rate of decomposition based on:
• The activity of soil fauna
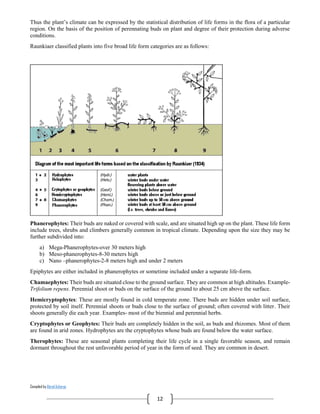
• Soil microbes
• Environment
• Litter quality (physical and chemical)
Decomposition involves a variety of organisms:
• Microfauna & microflora [<100 μm]– bacteria and fungi; nematodes, protozoa
• Mesafauna [100 μm – 2mm] – mites, tapeworms
• Macrofauna [2-20 mm] - millipedes
• Megafauna [> 20 mm]- earthworms, snails
Decomposition of plant litter involves the physical, biological and chemical processes that reduce litter to carbon
dioxide, ammonia, water and mineral nutrients. It is a key process and major determinant in nutrient cycling of
terrestrial ecosystem.
Leaf litter of fast growing species, which is also more palatable to generalist herbivores; decompose more readily
than those produced by slow growing species (which is less palatable to generalist herbivores with high C/N ratio).
Litter decomposition is positively related with the turnover of fungal species in litter over the period.
In addition to microorganisms, termites also have important roles in decomposition of woody debris, particularly
in Sal forests.
Entire process of decomposition can be divided into two stages: physical breakdown of litter to smaller pieces by
detritivore; and mineralization by saprophytic microorganism into inorganic molecules.
In terms of nutrient dynamics, decomposition of litter involves following three sequential phases:
1. Initial release phase: by leaching
2. Net immobilization phase: nutrients are imported into the residual materials through microbial activities.
3. Net release phase: absolute decline in the nutrient mass of decomposing litter.
If decomposition is too low
• Most nutrients removed from active circulation for a long time
• Nutrient cycling , forest productivity are reduced
• Excessive accumulation of litter leads to undesirable properties in the forest floor, eg may be excessively
wet, acidic, remain cold through the growing season
• Leads to poor root development
• Poor tree nutrition
• Slow tree growth
If decomposition is too high
• May release nutrients before soils and plants can retain them
o May be leached out of rooting zone
• Nitrogen may be lost by denitrification.
• Causes loss of Soil Organic Matter (SOM) which leads to development of undesirable physical and
chemical soil conditions. Can cause changes in
o Fertility
o Soil moisture status
o Resistance to erosion and other soil damage
Rate of litter decomposition varies enormously:](https://image.slidesharecdn.com/advanceforestecology-abiralacharya-200202090909/85/Advance-Forest-ecology-45-320.jpg)