December 2009 Montgomery County Basic Supply And Demand
•
0 likes•78 views


Recommended
Recommended
More Related Content
What's hot
What's hot (12)
Similar to December 2009 Montgomery County Basic Supply And Demand
Similar to December 2009 Montgomery County Basic Supply And Demand (20)
More from Prudential Fox & Roach, Realtors
More from Prudential Fox & Roach, Realtors (20)
Recently uploaded
Recently uploaded (20)
December 2009 Montgomery County Basic Supply And Demand
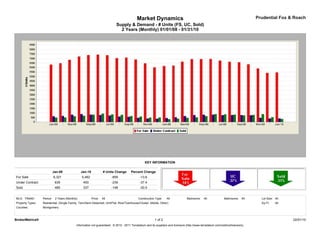
- 1. Market Dynamics Prudential Fox & Roach Supply & Demand - # Units (FS, UC, Sold) 2 Years (Monthly) 01/01/08 - 01/31/10 KEY INFORMATION Jan-08 Jan-10 # Units Change Percent Change For Sale 6,321 5,462 -859 -13.6 Under Contract 639 400 -239 -37.4 Sold 485 337 -148 -30.5 MLS: TReND Period: 2 Years (Monthly) Price: All Construction Type: All Bedrooms: All Bathrooms: All Lot Size: All Property Types: Residential: (Single Family, Twin/Semi-Detached, Unit/Flat, Row/Townhouse/Cluster, Mobile, Other) Sq Ft: All Counties: Montgomery BrokerMetrics® 1 of 2 02/01/10 Information not guaranteed. © 2010 - 2011 Terradatum and its suppliers and licensors (http://www.terradatum.com/metrics/licensors).
- 2. Market Dynamics Prudential Fox & Roach Supply & Demand - # Units (FS, UC, Sold) 2 Years (Monthly) 01/01/08 - 01/31/10 FOR SALE UNDER CONTRACT SOLD EXPIRED NEW LISTINGS Time Period # Properties Average DOM # Properties Average DOM # Properties Average DOM # Properties Average DOM # Properties Jan-10 5,462 160 400 91 337 87 563 206 1,154 Dec-09 5,406 193 393 97 526 89 705 212 568 Nov-09 5,900 201 466 91 872 81 596 202 889 Oct-09 6,352 207 746 76 781 90 595 221 1,112 Sep-09 6,582 214 762 83 733 84 580 184 1,286 Aug-09 6,633 223 765 90 815 83 572 186 1,149 Jul-09 6,767 227 756 86 849 84 527 188 1,222 Jun-09 6,943 233 818 89 873 81 580 209 1,313 May-09 6,931 237 811 84 647 87 490 200 1,304 Apr-09 6,925 239 767 86 513 86 531 163 1,468 Mar-09 6,647 248 658 84 462 101 532 192 1,460 Feb-09 6,212 263 528 97 366 99 497 219 1,205 Jan-09 6,159 270 444 101 311 86 708 209 1,115 Dec-08 6,019 277 359 94 498 82 616 205 558 Nov-08 6,461 267 384 86 484 77 616 166 757 Oct-08 6,887 256 460 80 602 76 723 158 1,071 Sep-08 7,094 248 573 73 661 71 705 155 1,339 Aug-08 7,033 247 604 71 793 67 674 174 1,136 Jul-08 7,355 238 713 76 837 66 745 177 1,436 Jun-08 7,425 236 768 67 928 62 738 194 1,528 May-08 7,374 231 816 65 805 73 661 151 1,674 Apr-08 7,211 227 876 65 687 79 635 149 1,818 Mar-08 6,850 230 813 74 632 82 644 168 1,629 Feb-08 6,472 236 673 77 494 89 578 177 1,510 Jan-08 6,321 237 639 84 485 79 720 167 1,546 BrokerMetrics® 2 of 2 02/01/10 Information not guaranteed. © 2010 - 2011 Terradatum and its suppliers and licensors (http://www.terradatum.com/metrics/licensors).