More Related Content
Similar to April Chester County Basic Supply and Demand
Similar to April Chester County Basic Supply and Demand (16)
More from Prudential Fox & Roach, Realtors
More from Prudential Fox & Roach, Realtors (20)
April Chester County Basic Supply and Demand
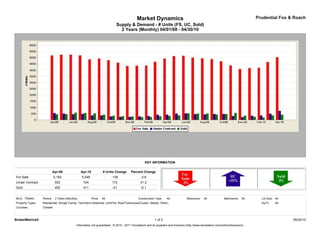
- 1. Market Dynamics Prudential Fox & Roach
Supply & Demand - # Units (FS, UC, Sold)
2 Years (Monthly) 04/01/08 - 04/30/10
KEY INFORMATION
Apr-08 Apr-10 # Units Change Percent Change
For Sale 5,182 5,046 -136 -2.6
Under Contract 552 724 172 31.2
Sold 452 411 -41 -9.1
MLS: TReND Period: 2 Years (Monthly) Price: All Construction Type: All Bedrooms: All Bathrooms: All Lot Size: All
Property Types: Residential: (Single Family, Twin/Semi-Detached, Unit/Flat, Row/Townhouse/Cluster, Mobile, Other) Sq Ft: All
Counties: Chester
BrokerMetrics® 1 of 2 05/24/10
Information not guaranteed. © 2010 - 2011 Terradatum and its suppliers and licensors (http://www.terradatum.com/metrics/licensors).
- 2. Market Dynamics Prudential Fox & Roach
Supply & Demand - # Units (FS, UC, Sold)
2 Years (Monthly) 04/01/08 - 04/30/10
FOR SALE UNDER CONTRACT SOLD EXPIRED NEW LISTINGS
Time Period # Properties Average DOM # Properties Average DOM # Properties Average DOM # Properties Average DOM # Properties
Apr-10 5,046 174 724 81 411 92 420 246 1,248
Mar-10 4,653 207 502 90 363 89 353 218 1,081
Feb-10 4,194 239 363 85 196 102 259 256 694
Jan-10 4,168 255 337 99 248 87 331 213 786
Dec-09 4,092 274 224 91 341 86 486 203 399
Nov-09 4,381 270 311 79 556 81 377 207 556
Oct-09 4,718 264 477 85 477 83 416 205 748
Sep-09 4,892 264 480 82 430 92 442 207 803
Aug-09 4,951 266 448 82 508 77 414 199 805
Jul-09 5,016 267 469 84 510 80 401 195 836
Jun-09 5,154 266 529 86 530 85 445 196 913
May-09 5,125 270 508 83 366 93 376 225 976
Apr-09 4,933 276 420 87 317 103 364 199 1,017
Mar-09 4,670 285 413 100 297 105 341 218 939
Feb-09 4,374 299 318 95 238 92 325 230 752
Jan-09 4,354 304 290 107 225 93 442 195 708
Dec-08 4,331 307 239 97 282 88 446 189 406
Nov-08 4,604 296 245 86 300 86 434 181 518
Oct-08 4,801 289 283 82 337 81 432 193 720
Sep-08 4,936 281 354 80 418 75 501 173 905
Aug-08 4,872 279 364 75 522 76 477 173 702
Jul-08 5,185 268 484 80 551 71 531 197 886
Jun-08 5,244 264 457 72 579 67 488 209 953
May-08 5,243 258 512 65 459 79 440 167 1,113
Apr-08 5,182 258 552 77 452 80 500 201 1,195
BrokerMetrics® 2 of 2 05/24/10
Information not guaranteed. © 2010 - 2011 Terradatum and its suppliers and licensors (http://www.terradatum.com/metrics/licensors).