More Related Content
Similar to Montgomery County Basic Supply And Demand
Similar to Montgomery County Basic Supply And Demand (20)
More from Prudential Fox & Roach, Realtors
More from Prudential Fox & Roach, Realtors (20)
Montgomery County Basic Supply And Demand
- 1. Market Dynamics Prudential Fox & Roach
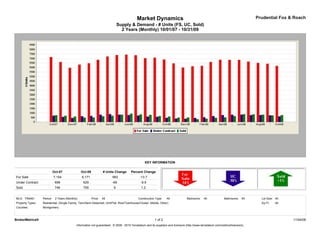
Supply & Demand - # Units (FS, UC, Sold)
2 Years (Monthly) 10/01/07 - 10/31/09
KEY INFORMATION
Oct-07 Oct-09 # Units Change Percent Change
For Sale 7,154 6,171 -983 -13.7
Under Contract 698 629 -69 -9.9
Sold 746 755 9 1.2
MLS: TReND Period: 2 Years (Monthly) Price: All Construction Type: All Bedrooms: All Bathrooms: All Lot Size: All
Property Types: Residential: (Single Family, Twin/Semi-Detached, Unit/Flat, Row/Townhouse/Cluster, Mobile, Other) Sq Ft: All
Counties: Montgomery
BrokerMetrics® 1 of 2 11/04/09
Information not guaranteed. © 2009 - 2010 Terradatum and its suppliers and licensors (http://www.terradatum.com/metrics/licensors).
- 2. Market Dynamics Prudential Fox & Roach
Supply & Demand - # Units (FS, UC, Sold)
2 Years (Monthly) 10/01/07 - 10/31/09
FOR SALE UNDER CONTRACT SOLD EXPIRED NEW LISTINGS
Time Period # Properties Average DOM # Properties Average DOM # Properties Average DOM # Properties Average DOM # Properties
Oct-09 6,171 155 629 74 755 92 647 210 1,091
Sep-09 6,421 171 738 81 730 85 603 178 1,278
Aug-09 6,503 189 764 90 814 82 596 179 1,148
Jul-09 6,652 199 761 86 850 83 536 182 1,221
Jun-09 6,842 210 818 89 872 81 593 205 1,311
May-09 6,837 217 810 82 648 87 496 195 1,300
Apr-09 6,855 222 768 86 512 86 550 156 1,467
Mar-09 6,613 232 658 85 462 102 567 183 1,458
Feb-09 6,184 249 529 97 366 99 500 215 1,205
Jan-09 6,135 259 445 101 311 86 711 210 1,114
Dec-08 5,996 269 360 95 498 81 615 202 549
Nov-08 6,450 260 385 87 484 77 618 166 751
Oct-08 6,884 251 462 80 602 76 723 158 1,071
Sep-08 7,091 243 573 73 661 71 705 155 1,339
Aug-08 7,030 242 604 71 793 67 674 174 1,136
Jul-08 7,352 234 713 76 837 66 745 177 1,436
Jun-08 7,422 232 768 67 928 62 738 194 1,528
May-08 7,373 227 818 64 805 73 661 151 1,674
Apr-08 7,210 224 876 65 687 79 635 149 1,818
Mar-08 6,848 227 813 74 632 82 643 168 1,629
Feb-08 6,470 234 673 76 494 89 578 177 1,510
Jan-08 6,319 235 639 84 485 79 720 167 1,546
Dec-07 5,964 242 448 79 601 71 743 163 636
Nov-07 6,609 227 562 71 693 68 719 143 1,031
Oct-07 7,154 216 698 71 746 65 878 148 1,539
BrokerMetrics® 2 of 2 11/04/09
Information not guaranteed. © 2009 - 2010 Terradatum and its suppliers and licensors (http://www.terradatum.com/metrics/licensors).