More Related Content
Similar to July 2010 Bucks County Basic Supply and Demand
Similar to July 2010 Bucks County Basic Supply and Demand (16)
More from Prudential Fox & Roach, Realtors
More from Prudential Fox & Roach, Realtors (20)
July 2010 Bucks County Basic Supply and Demand
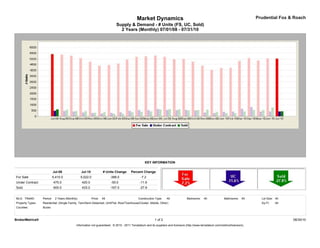
- 1. Market Dynamics Prudential Fox & Roach
Supply & Demand - # Units (FS, UC, Sold)
2 Years (Monthly) 07/01/08 - 07/31/10
KEY INFORMATION
Jul-08 Jul-10 # Units Change Percent Change
For Sale 5,410.0 5,022.0 -388.0 -7.2
Under Contract 475.0 420.0 -55.0 -11.6
Sold 600.0 433.0 -167.0 -27.8
MLS: TReND Period: 2 Years (Monthly) Price: All Construction Type: All Bedrooms: All Bathrooms: All Lot Size: All
Property Types: Residential: (Single Family, Twin/Semi-Detached, Unit/Flat, Row/Townhouse/Cluster, Mobile, Other) Sq Ft: All
Counties: Bucks
BrokerMetrics® 1 of 2 08/30/10
Information not guaranteed. © 2010 - 2011 Terradatum and its suppliers and licensors (http://www.terradatum.com/metrics/licensors).
- 2. Market Dynamics Prudential Fox & Roach
Supply & Demand - # Units (FS, UC, Sold)
2 Years (Monthly) 07/01/08 - 07/31/10
FOR SALE UNDER CONTRACT SOLD EXPIRED NEW LISTINGS
Time Period # Properties Average DOM # Properties Average DOM # Properties Average DOM # Properties Average DOM # Properties
Jul-10 5,022 138 420 87 433 84 447 189 822
Jun-10 5,052 134 422 86 762 70 430 187 945
May-10 4,851 132 404 72 543 88 340 177 926
Apr-10 5,065 127 797 80 543 82 343 193 1,293
Mar-10 4,816 135 654 82 422 103 390 195 1,229
Feb-10 4,219 146 412 92 275 101 220 195 764
Jan-10 4,191 149 394 103 270 96 342 207 922
Dec-09 4,040 164 278 99 369 92 493 229 403
Nov-09 4,400 154 325 96 579 85 438 221 558
Oct-09 4,763 143 514 88 551 88 407 176 795
Sep-09 4,991 140 566 88 509 86 457 198 950
Aug-09 4,974 141 530 92 608 85 403 193 799
Jul-09 5,175 137 554 84 623 80 446 195 928
Jun-09 5,290 133 634 82 601 86 409 186 968
May-09 5,212 132 533 82 425 90 357 208 986
Apr-09 5,176 131 551 88 391 97 399 185 1,091
Mar-09 4,940 135 470 91 363 92 385 179 1,062
Feb-09 4,596 139 359 96 230 98 359 171 854
Jan-09 4,461 144 293 97 228 92 426 198 825
Dec-08 4,400 146 249 99 363 91 515 177 450
Nov-08 4,746 133 290 87 317 75 506 159 575
Oct-08 5,066 122 324 84 448 68 571 148 853
Sep-08 5,268 117 416 76 457 70 639 151 919
Aug-08 5,371 113 460 68 573 66 562 155 1,020
Jul-08 5,410 109 475 73 600 68 584 143 1,056
BrokerMetrics® 2 of 2 08/30/10
Information not guaranteed. © 2010 - 2011 Terradatum and its suppliers and licensors (http://www.terradatum.com/metrics/licensors).