2010 March Chester County Basic Supply and Demand Analysis
•
0 likes•34 views

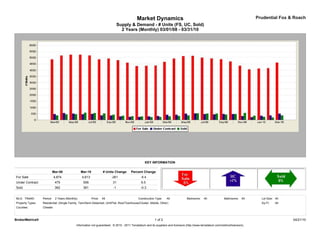
Over a two-year period from March 2008 to March 2010 in Chester County: - The number of homes for sale decreased by 261 units (-5.4%), while the number of homes under contract increased by 31 units (6.5%). The number of homes sold decreased slightly by 1 unit (-0.3%). - In March 2010 specifically, there were 4,613 homes for sale with an average time on market of 186 days, 506 homes under contract averaging 88 days, and 361 homes sold averaging 89 days. - 1,077 new listings were added in March 2010.

Recommended
Recommended
More Related Content
What's hot
What's hot (15)
Similar to 2010 March Chester County Basic Supply and Demand Analysis
Similar to 2010 March Chester County Basic Supply and Demand Analysis (14)
More from Prudential Fox & Roach, Realtors
More from Prudential Fox & Roach, Realtors (20)
Recently uploaded
Recently uploaded (20)
2010 March Chester County Basic Supply and Demand Analysis
- 1. Market Dynamics Prudential Fox & Roach Supply & Demand - # Units (FS, UC, Sold) 2 Years (Monthly) 03/01/08 - 03/31/10 KEY INFORMATION Mar-08 Mar-10 # Units Change Percent Change For Sale 4,874 4,613 -261 -5.4 Under Contract 475 506 31 6.5 Sold 362 361 -1 -0.3 MLS: TReND Period: 2 Years (Monthly) Price: All Construction Type: All Bedrooms: All Bathrooms: All Lot Size: All Property Types: Residential: (Single Family, Twin/Semi-Detached, Unit/Flat, Row/Townhouse/Cluster, Mobile, Other) Sq Ft: All Counties: Chester BrokerMetrics® 1 of 2 04/21/10 Information not guaranteed. © 2010 - 2011 Terradatum and its suppliers and licensors (http://www.terradatum.com/metrics/licensors).
- 2. Market Dynamics Prudential Fox & Roach Supply & Demand - # Units (FS, UC, Sold) 2 Years (Monthly) 03/01/08 - 03/31/10 FOR SALE UNDER CONTRACT SOLD EXPIRED NEW LISTINGS Time Period # Properties Average DOM # Properties Average DOM # Properties Average DOM # Properties Average DOM # Properties Mar-10 4,613 186 506 88 361 89 357 215 1,077 Feb-10 4,160 222 364 86 196 102 260 256 694 Jan-10 4,137 240 337 102 245 88 334 212 785 Dec-09 4,066 261 223 93 340 86 491 204 399 Nov-09 4,361 259 312 79 556 81 382 206 556 Oct-09 4,700 256 474 85 475 82 421 205 740 Sep-09 4,882 257 480 82 430 92 442 207 803 Aug-09 4,945 260 449 82 508 77 417 199 805 Jul-09 5,013 262 470 84 510 80 403 195 835 Jun-09 5,153 262 528 85 530 85 447 196 913 May-09 5,125 266 509 82 366 93 376 225 976 Apr-09 4,933 273 420 87 317 103 364 199 1,017 Mar-09 4,670 282 413 100 297 105 341 218 939 Feb-09 4,374 297 318 95 238 92 325 230 752 Jan-09 4,354 302 290 107 225 93 442 195 708 Dec-08 4,331 304 239 97 282 88 446 189 406 Nov-08 4,604 294 245 86 300 86 434 181 518 Oct-08 4,801 288 283 82 337 81 432 193 720 Sep-08 4,936 279 354 80 418 75 501 173 905 Aug-08 4,872 277 364 75 522 76 477 173 702 Jul-08 5,185 267 484 80 551 71 531 197 886 Jun-08 5,244 263 457 72 579 67 488 209 953 May-08 5,243 257 512 65 459 79 440 167 1,113 Apr-08 5,182 257 552 77 452 80 500 201 1,195 Mar-08 4,874 261 475 80 362 96 412 185 1,148 BrokerMetrics® 2 of 2 04/21/10 Information not guaranteed. © 2010 - 2011 Terradatum and its suppliers and licensors (http://www.terradatum.com/metrics/licensors).