More Related Content
Similar to Delaware county basic supply and demand
Similar to Delaware county basic supply and demand (17)
More from Prudential Fox & Roach, Realtors
More from Prudential Fox & Roach, Realtors (20)
Delaware county basic supply and demand
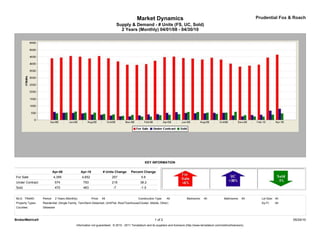
- 1. Market Dynamics Prudential Fox & Roach
Supply & Demand - # Units (FS, UC, Sold)
2 Years (Monthly) 04/01/08 - 04/30/10
KEY INFORMATION
Apr-08 Apr-10 # Units Change Percent Change
For Sale 4,395 4,652 257 5.8
Under Contract 574 793 219 38.2
Sold 470 463 -7 -1.5
MLS: TReND Period: 2 Years (Monthly) Price: All Construction Type: All Bedrooms: All Bathrooms: All Lot Size: All
Property Types: Residential: (Single Family, Twin/Semi-Detached, Unit/Flat, Row/Townhouse/Cluster, Mobile, Other) Sq Ft: All
Counties: Delaware
BrokerMetrics® 1 of 2 05/24/10
Information not guaranteed. © 2010 - 2011 Terradatum and its suppliers and licensors (http://www.terradatum.com/metrics/licensors).
- 2. Market Dynamics Prudential Fox & Roach
Supply & Demand - # Units (FS, UC, Sold)
2 Years (Monthly) 04/01/08 - 04/30/10
FOR SALE UNDER CONTRACT SOLD EXPIRED NEW LISTINGS
Time Period # Properties Average DOM # Properties Average DOM # Properties Average DOM # Properties Average DOM # Properties
Apr-10 4,652 151 793 75 463 83 365 188 1,208
Mar-10 4,449 178 656 84 373 93 349 213 1,177
Feb-10 3,940 213 367 84 236 92 301 230 709
Jan-10 3,868 229 346 97 248 99 291 199 764
Dec-09 3,802 248 255 87 334 84 443 221 411
Nov-09 4,015 247 313 96 577 87 311 187 556
Oct-09 4,302 244 506 88 515 88 337 202 739
Sep-09 4,437 243 510 86 431 74 364 202 909
Aug-09 4,308 250 468 81 514 77 312 195 732
Jul-09 4,373 250 474 85 569 91 323 200 788
Jun-09 4,413 253 494 87 569 83 334 209 748
May-09 4,516 251 553 86 403 92 298 197 827
Apr-09 4,478 252 499 83 360 99 290 206 959
Mar-09 4,217 262 413 95 337 98 285 194 874
Feb-09 3,981 271 393 103 233 102 245 182 742
Jan-09 3,921 276 316 103 236 87 366 209 640
Dec-08 3,935 276 252 89 350 79 402 184 402
Nov-08 4,173 266 256 80 286 77 384 172 505
Oct-08 4,393 256 307 78 392 79 418 152 706
Sep-08 4,551 246 362 76 421 76 502 157 934
Aug-08 4,380 243 383 73 514 65 380 169 739
Jul-08 4,509 235 462 69 503 60 406 179 904
Jun-08 4,556 228 498 58 594 68 453 201 1,005
May-08 4,452 224 509 73 517 66 392 165 999
Apr-08 4,395 220 574 68 470 79 368 157 1,153
BrokerMetrics® 2 of 2 05/24/10
Information not guaranteed. © 2010 - 2011 Terradatum and its suppliers and licensors (http://www.terradatum.com/metrics/licensors).