Downloaded 40 times
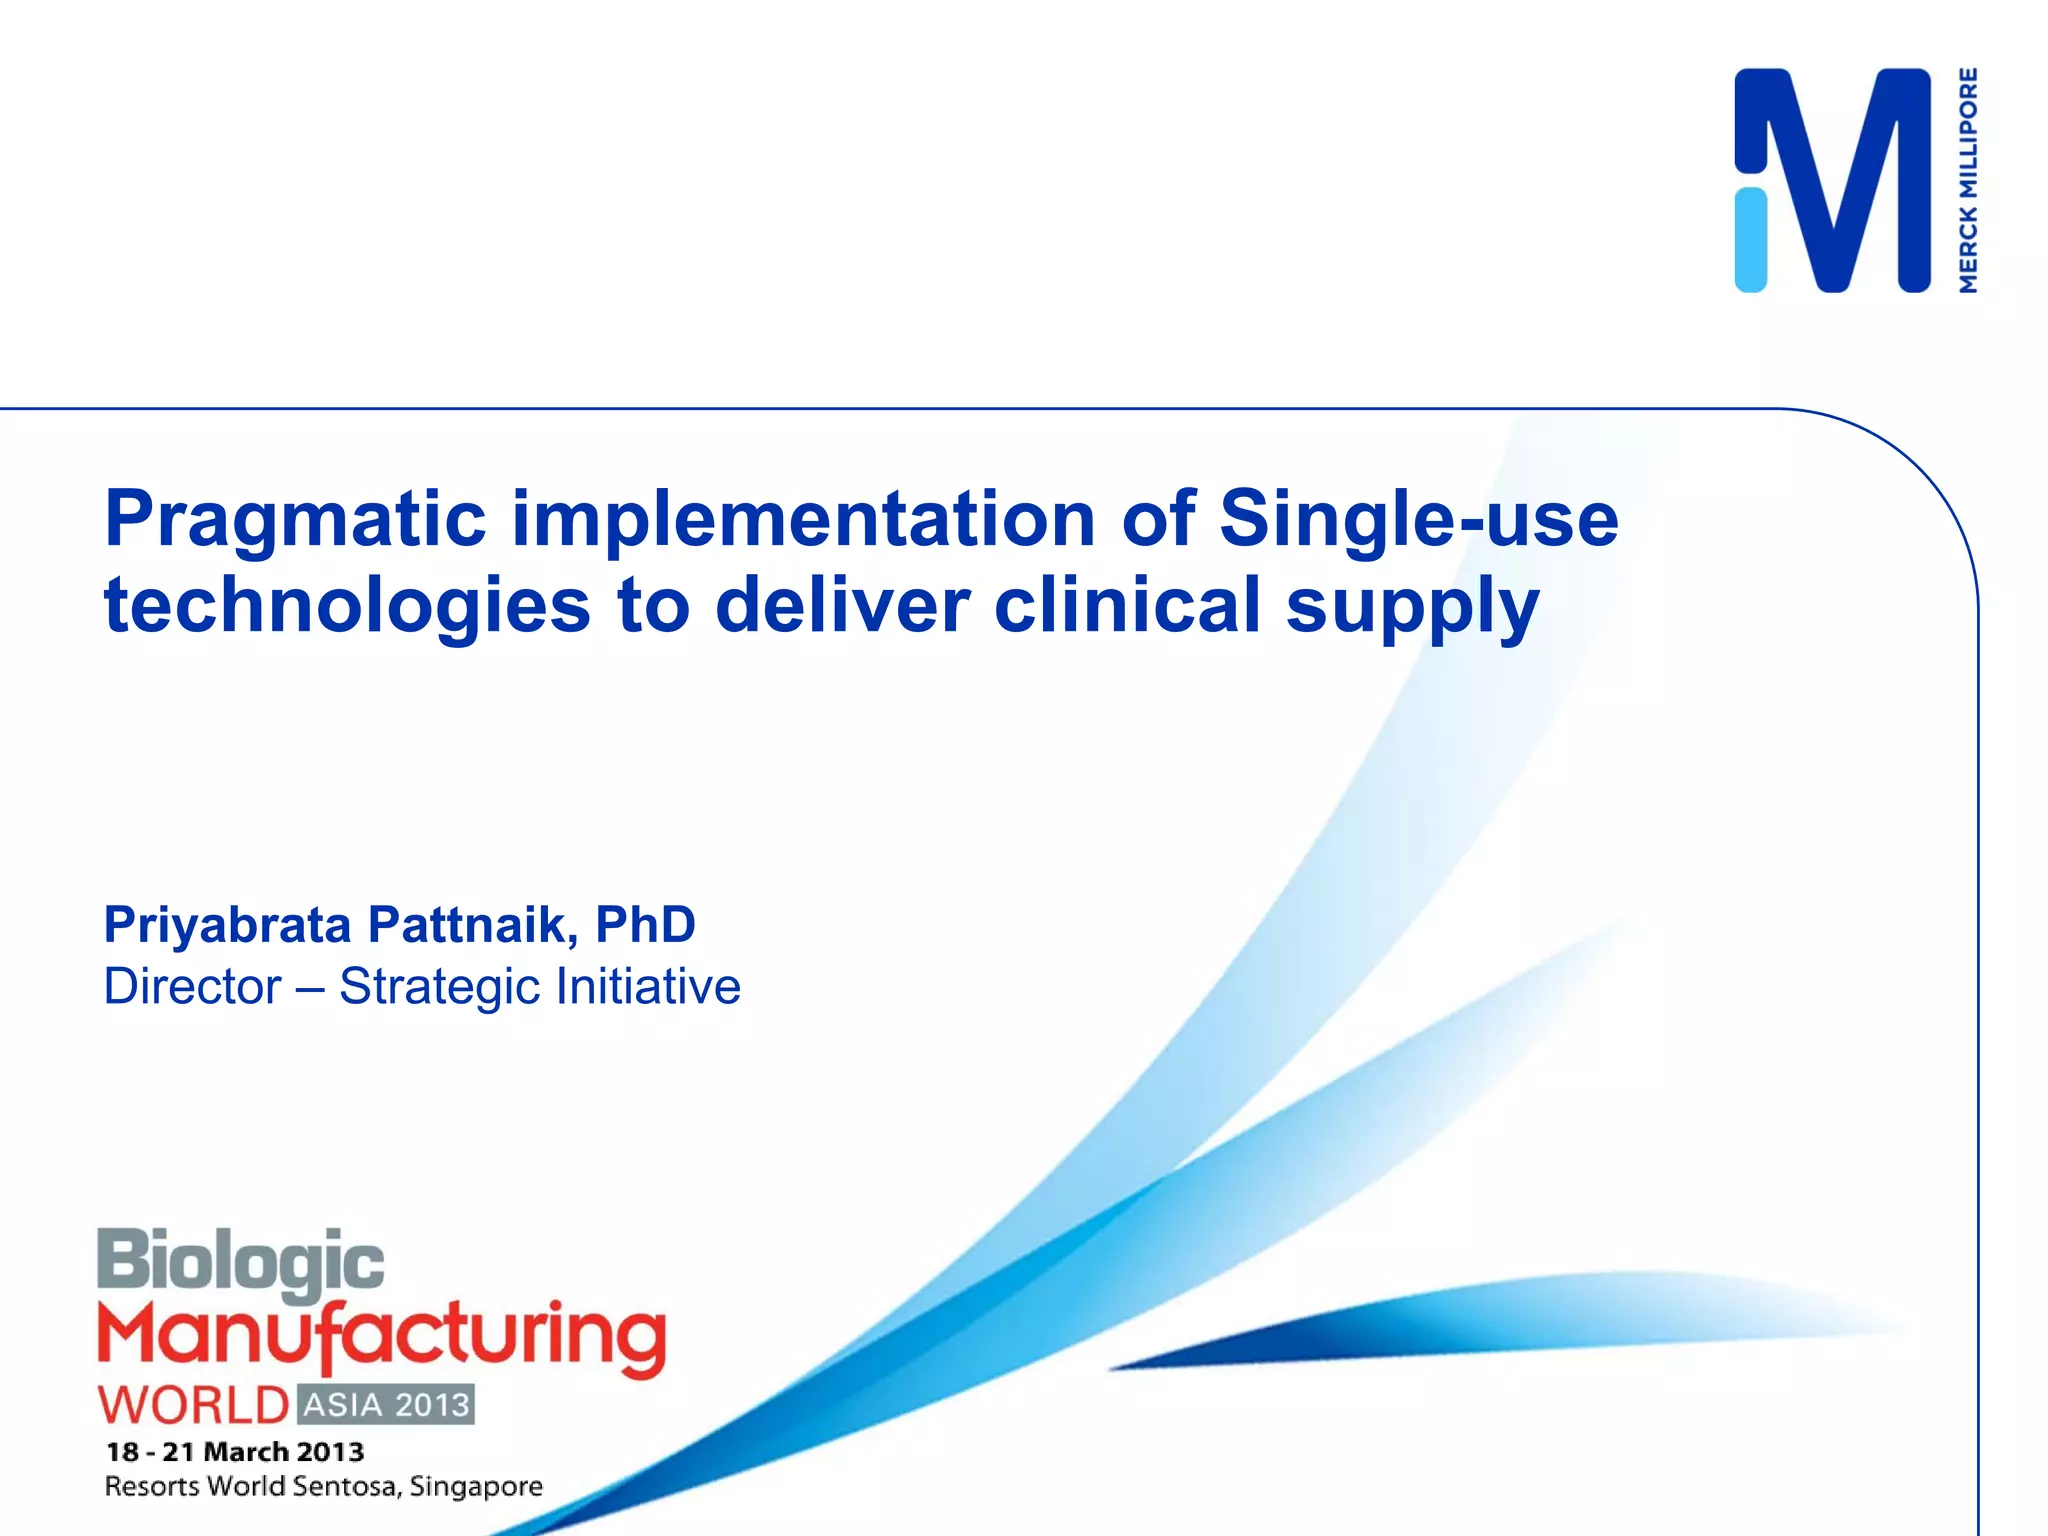
![Proof of Principle
Pilot Scale
[100L bioreactor]
Bench Scale
Millistak
D0HC + X0HC
ProSep Ultra Plus
Selection
Millistak X0HC
Tool
e
Fractogel SO3
y
e
y
ChromaSorb
Sizing
Viresolve Pro+
Tool
P3 UltraCel
Template
10](https://image.slidesharecdn.com/pragmaticimplementationofsingle-usetechnologiestodeliverclinicalsupply-130319102625-phpapp02/75/Pragmatic-implementation-of-single-use-technologies-to-deliver-clinical-supply-10-2048.jpg)
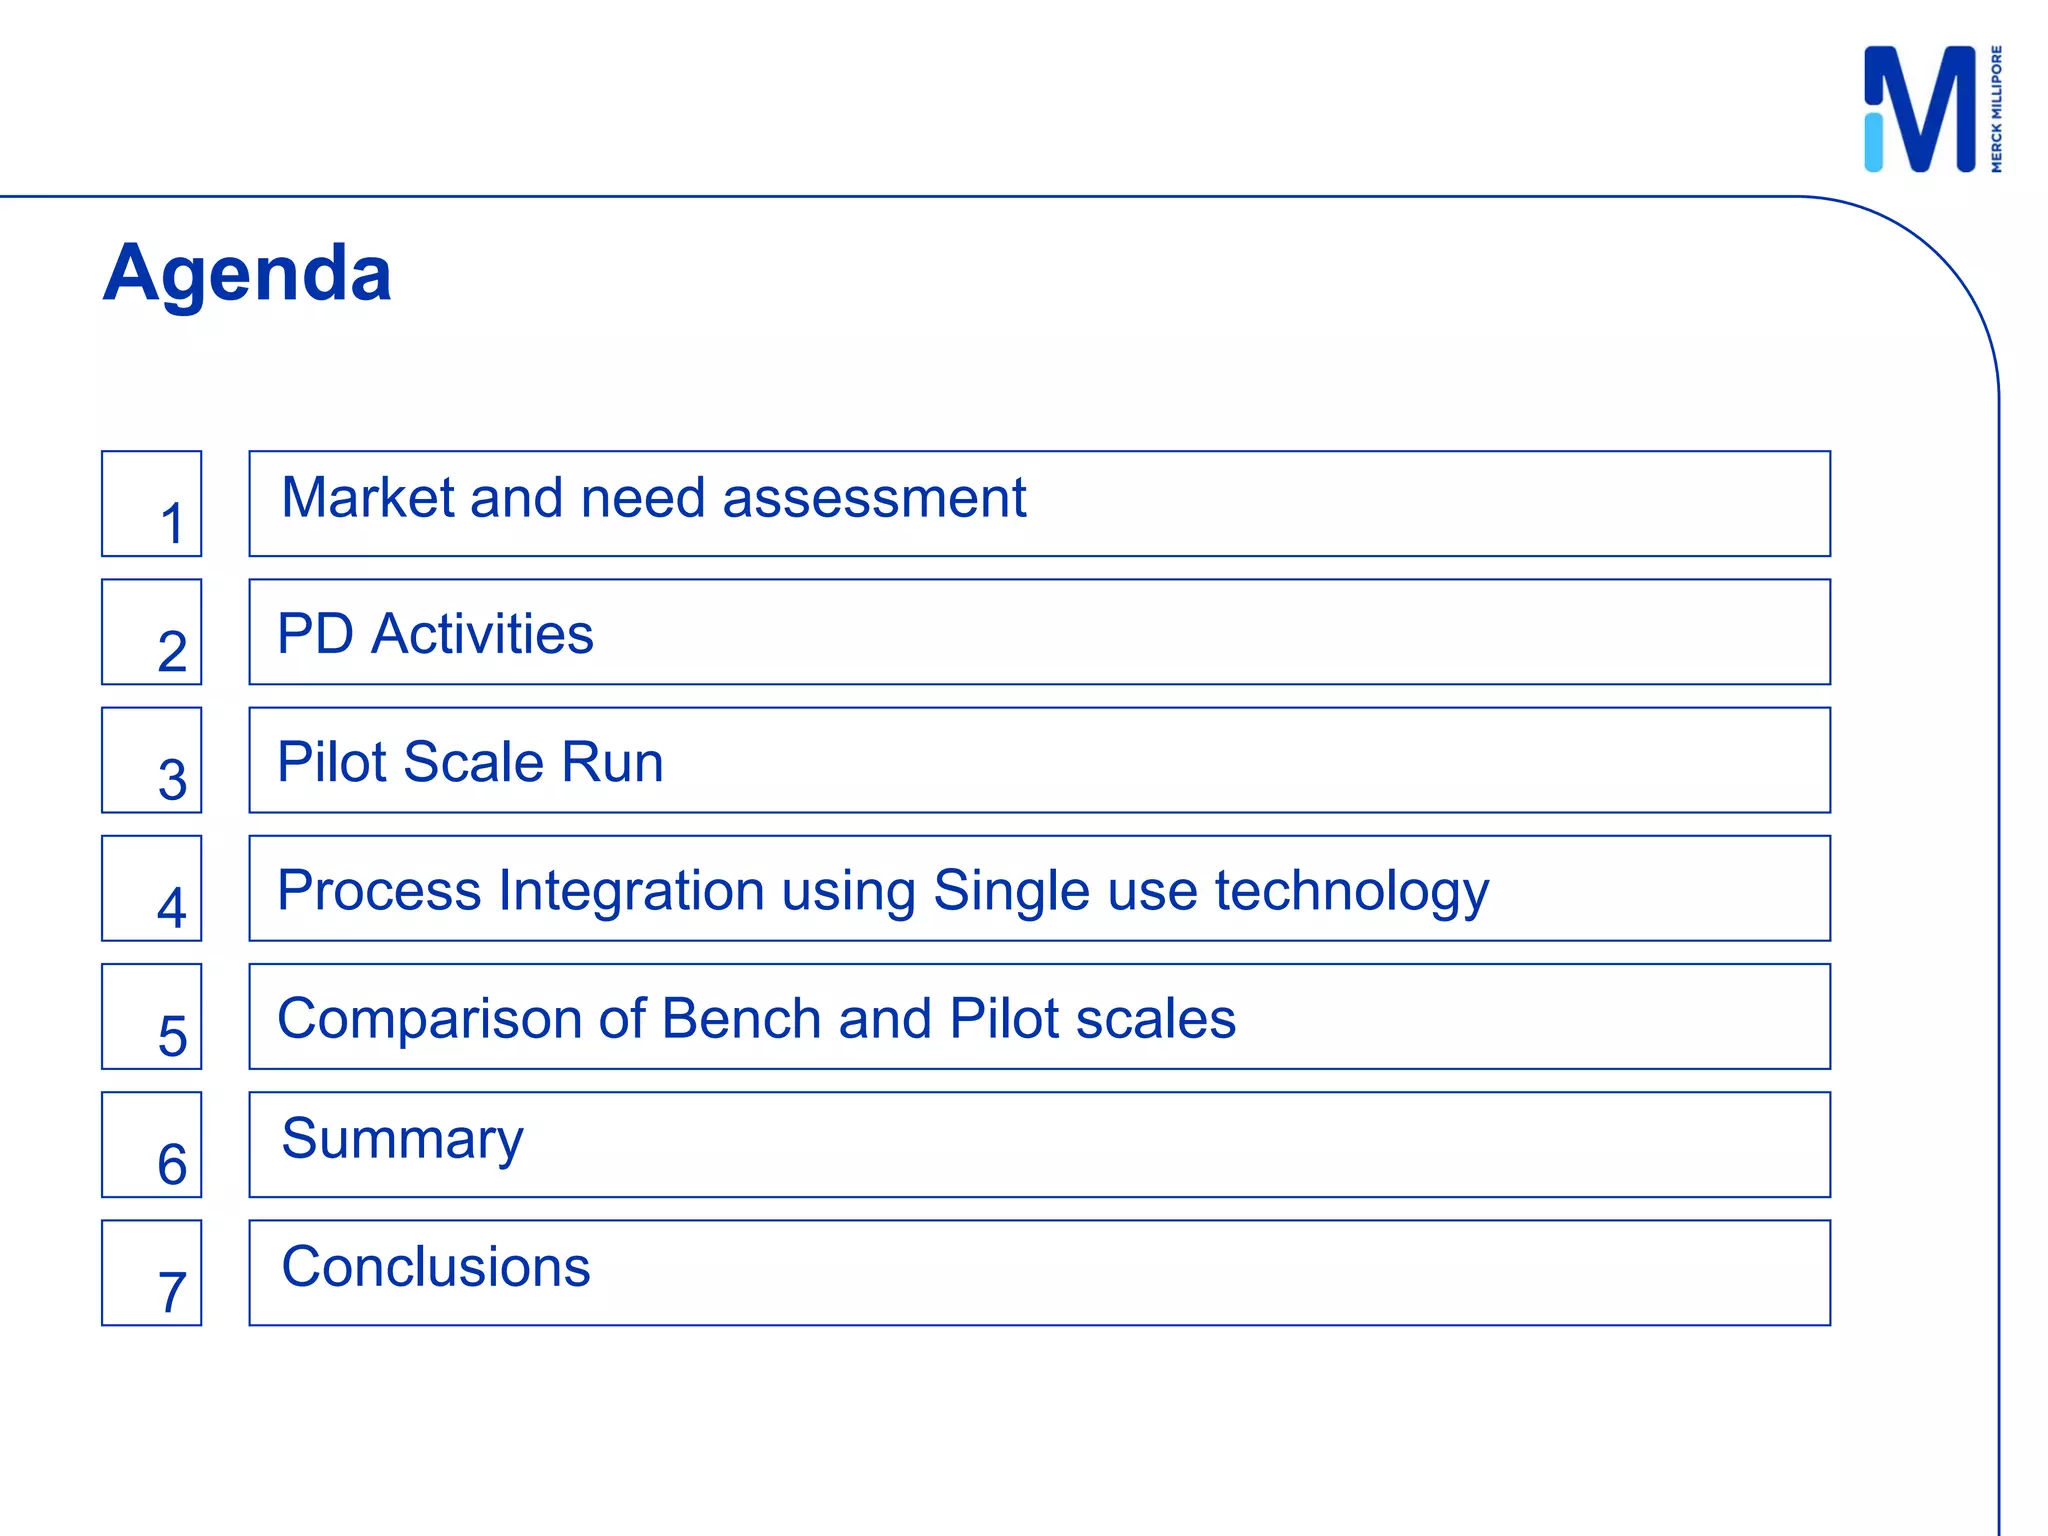
![Cost of Pilot Scale Runs - Summary
Units Utilized
Hardware
MIX sytems 2
Drum dollies 6
200L Bioreactor 1
Buffer systems 1
Chrom systems 1
Non-chrom systems [ CLF, VF, TFF ] 3
Systems/Hardware Cost ~ $2.0M
Disposables
MIX Bags 15
2D and 3D bags 22
Sterile filters 8
Devices 11
Single use flow paths 11
Total cost of disposables* ~ $50k
23 * Excludes chrom resins and TFF membranes](https://image.slidesharecdn.com/pragmaticimplementationofsingle-usetechnologiestodeliverclinicalsupply-130319102625-phpapp02/75/Pragmatic-implementation-of-single-use-technologies-to-deliver-clinical-supply-23-2048.jpg)
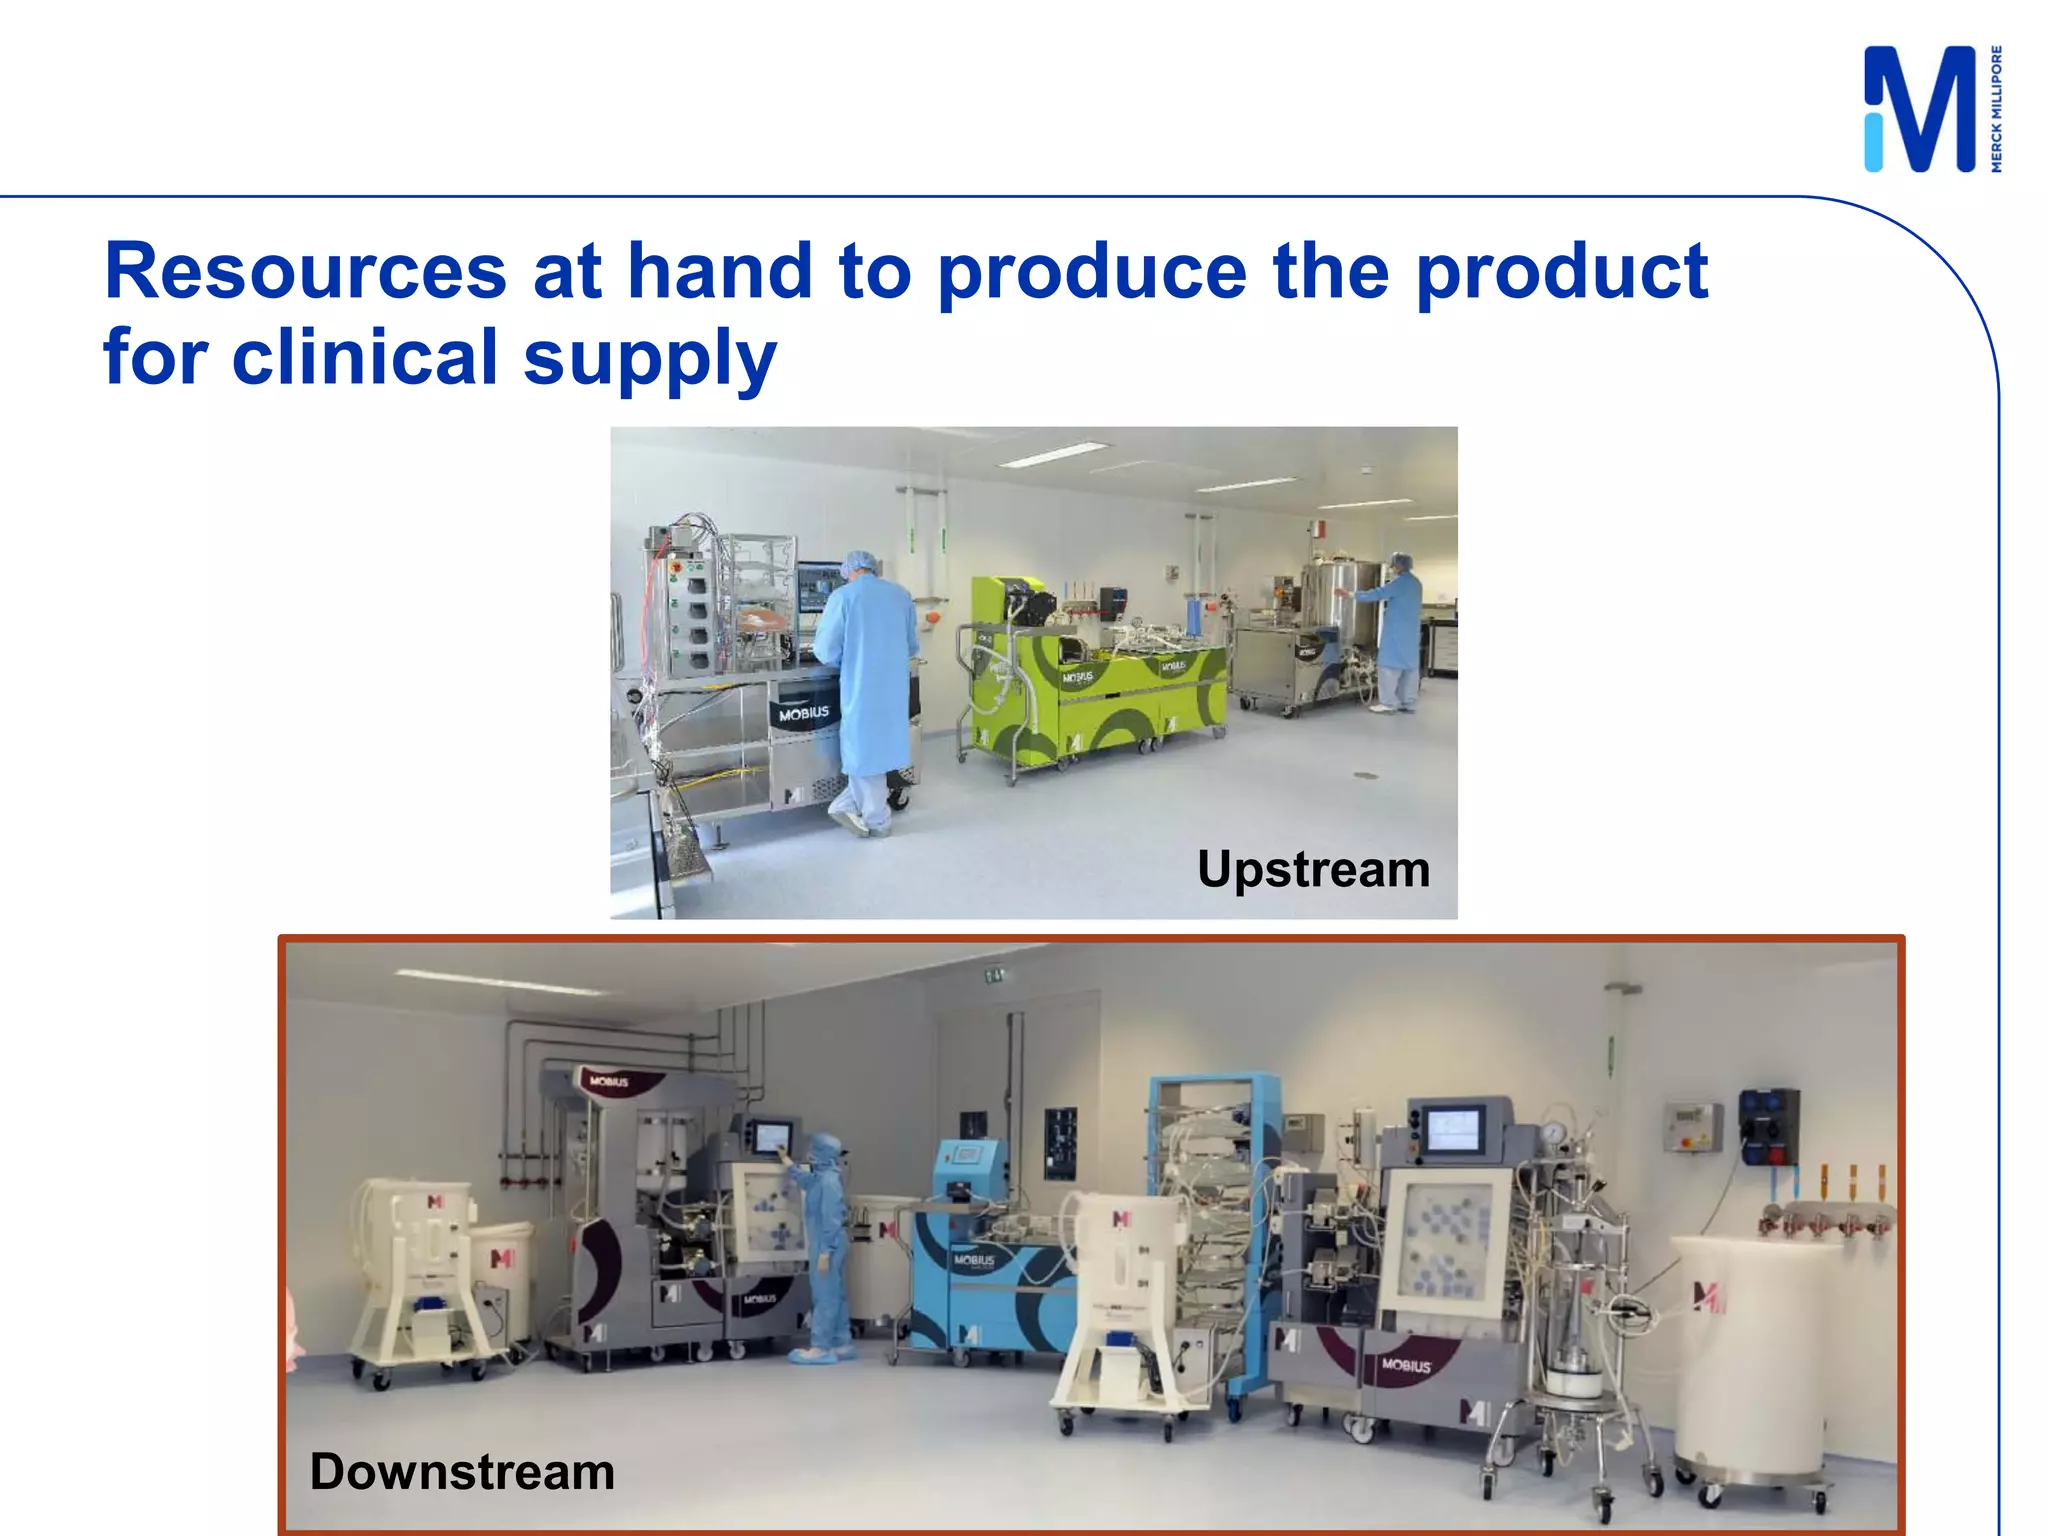
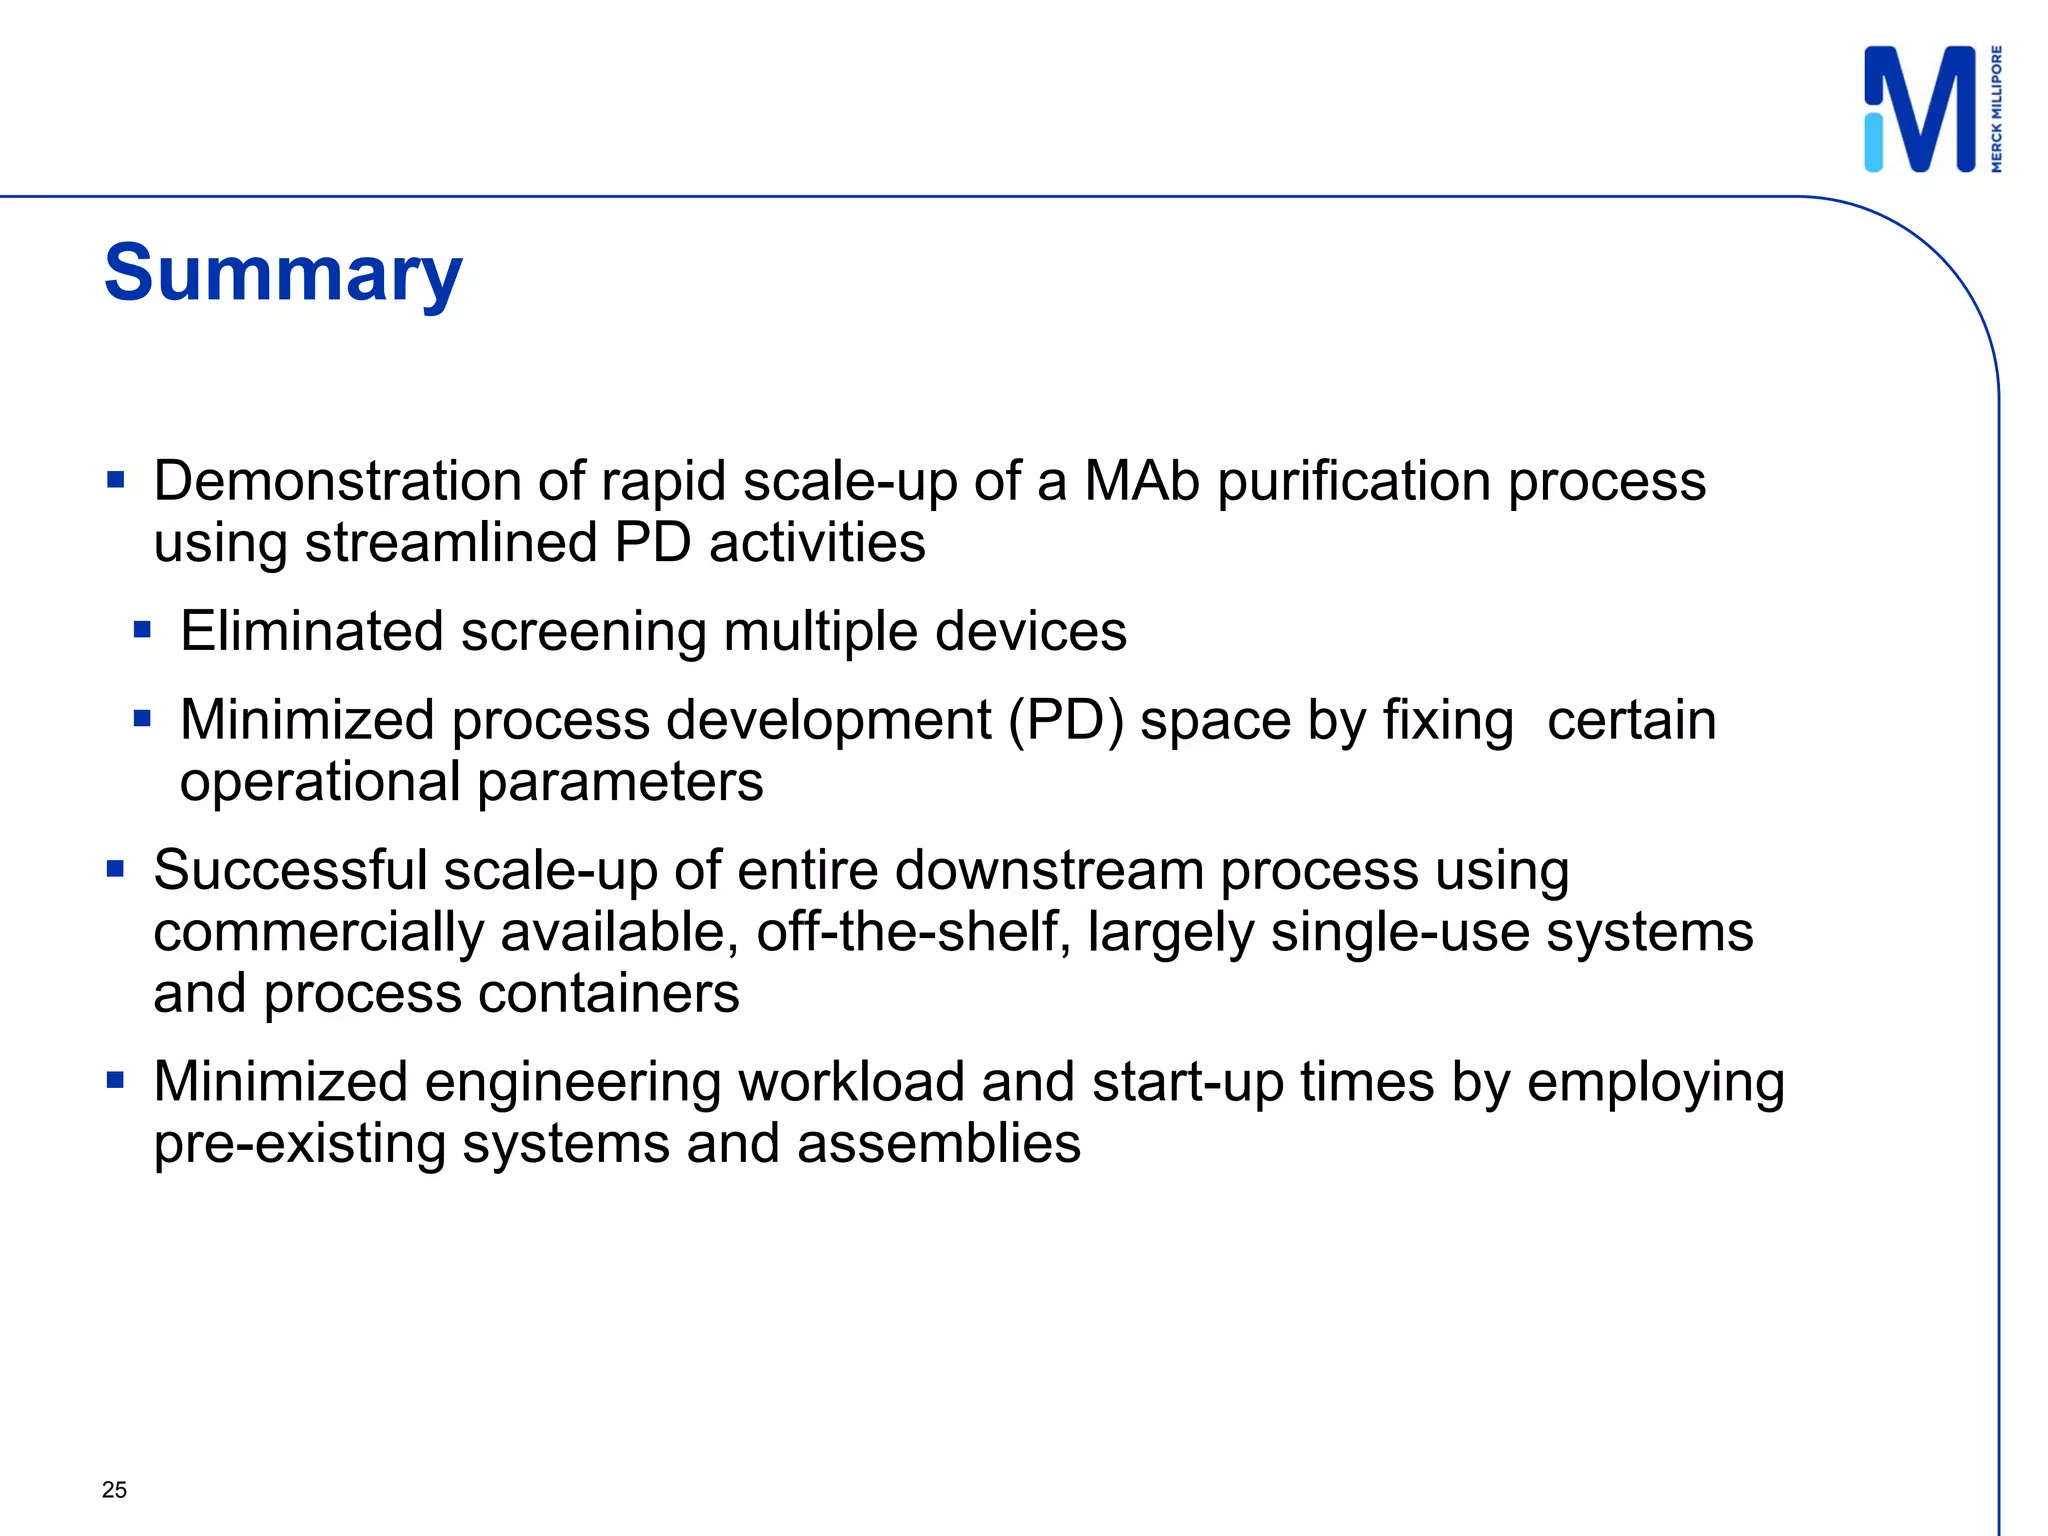


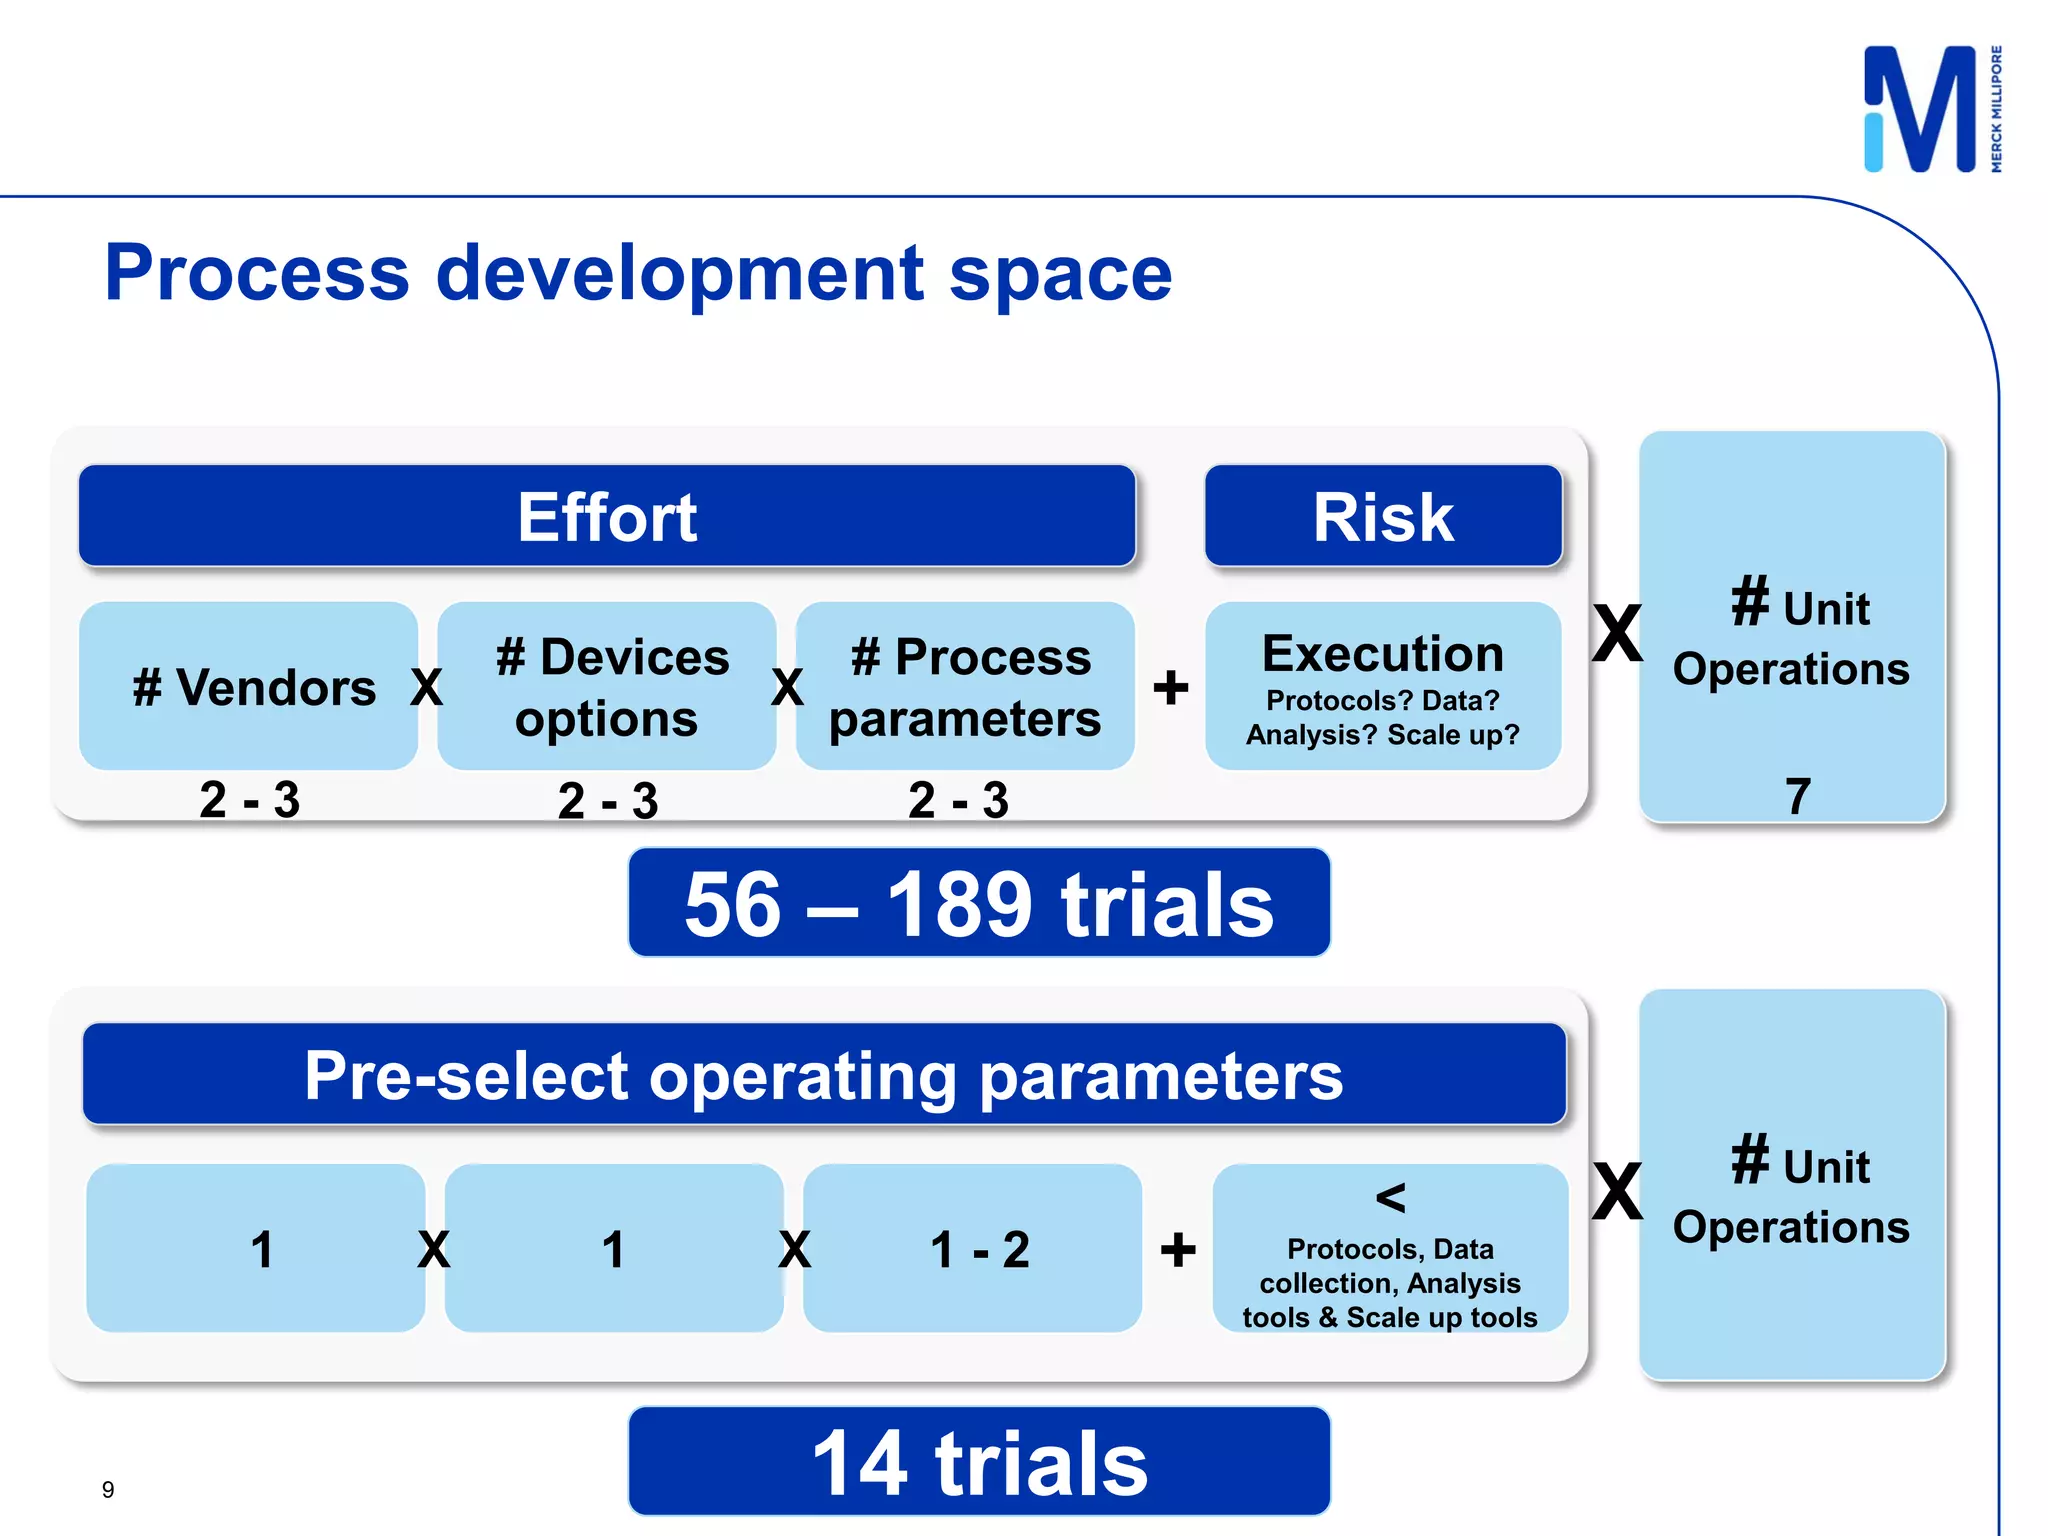
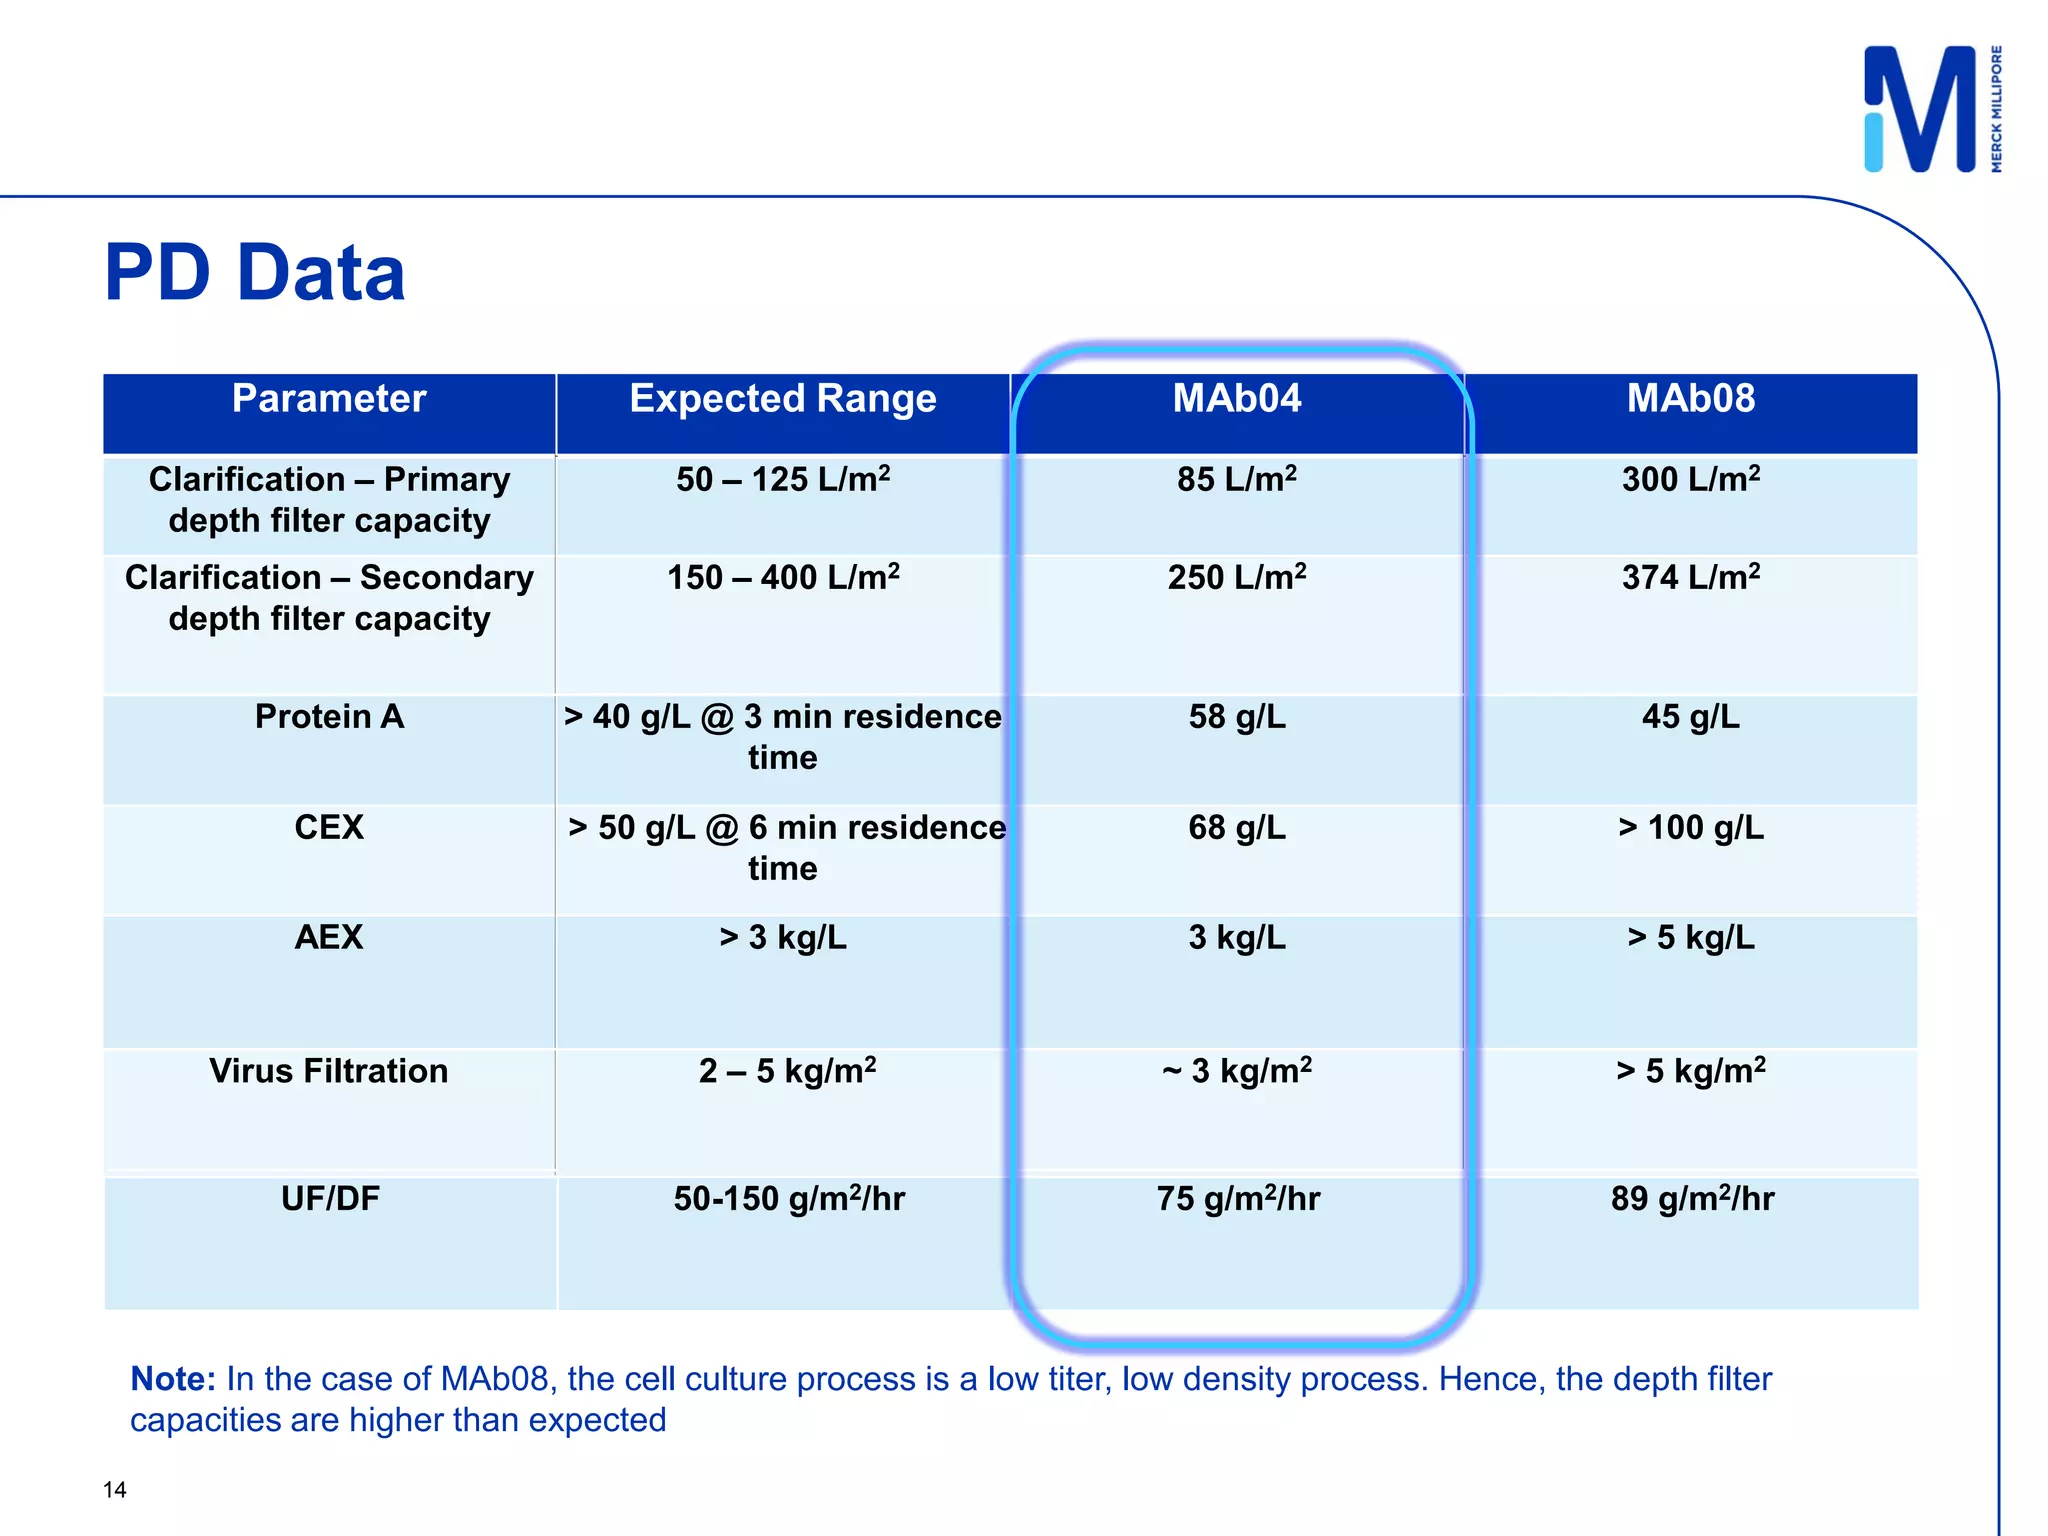
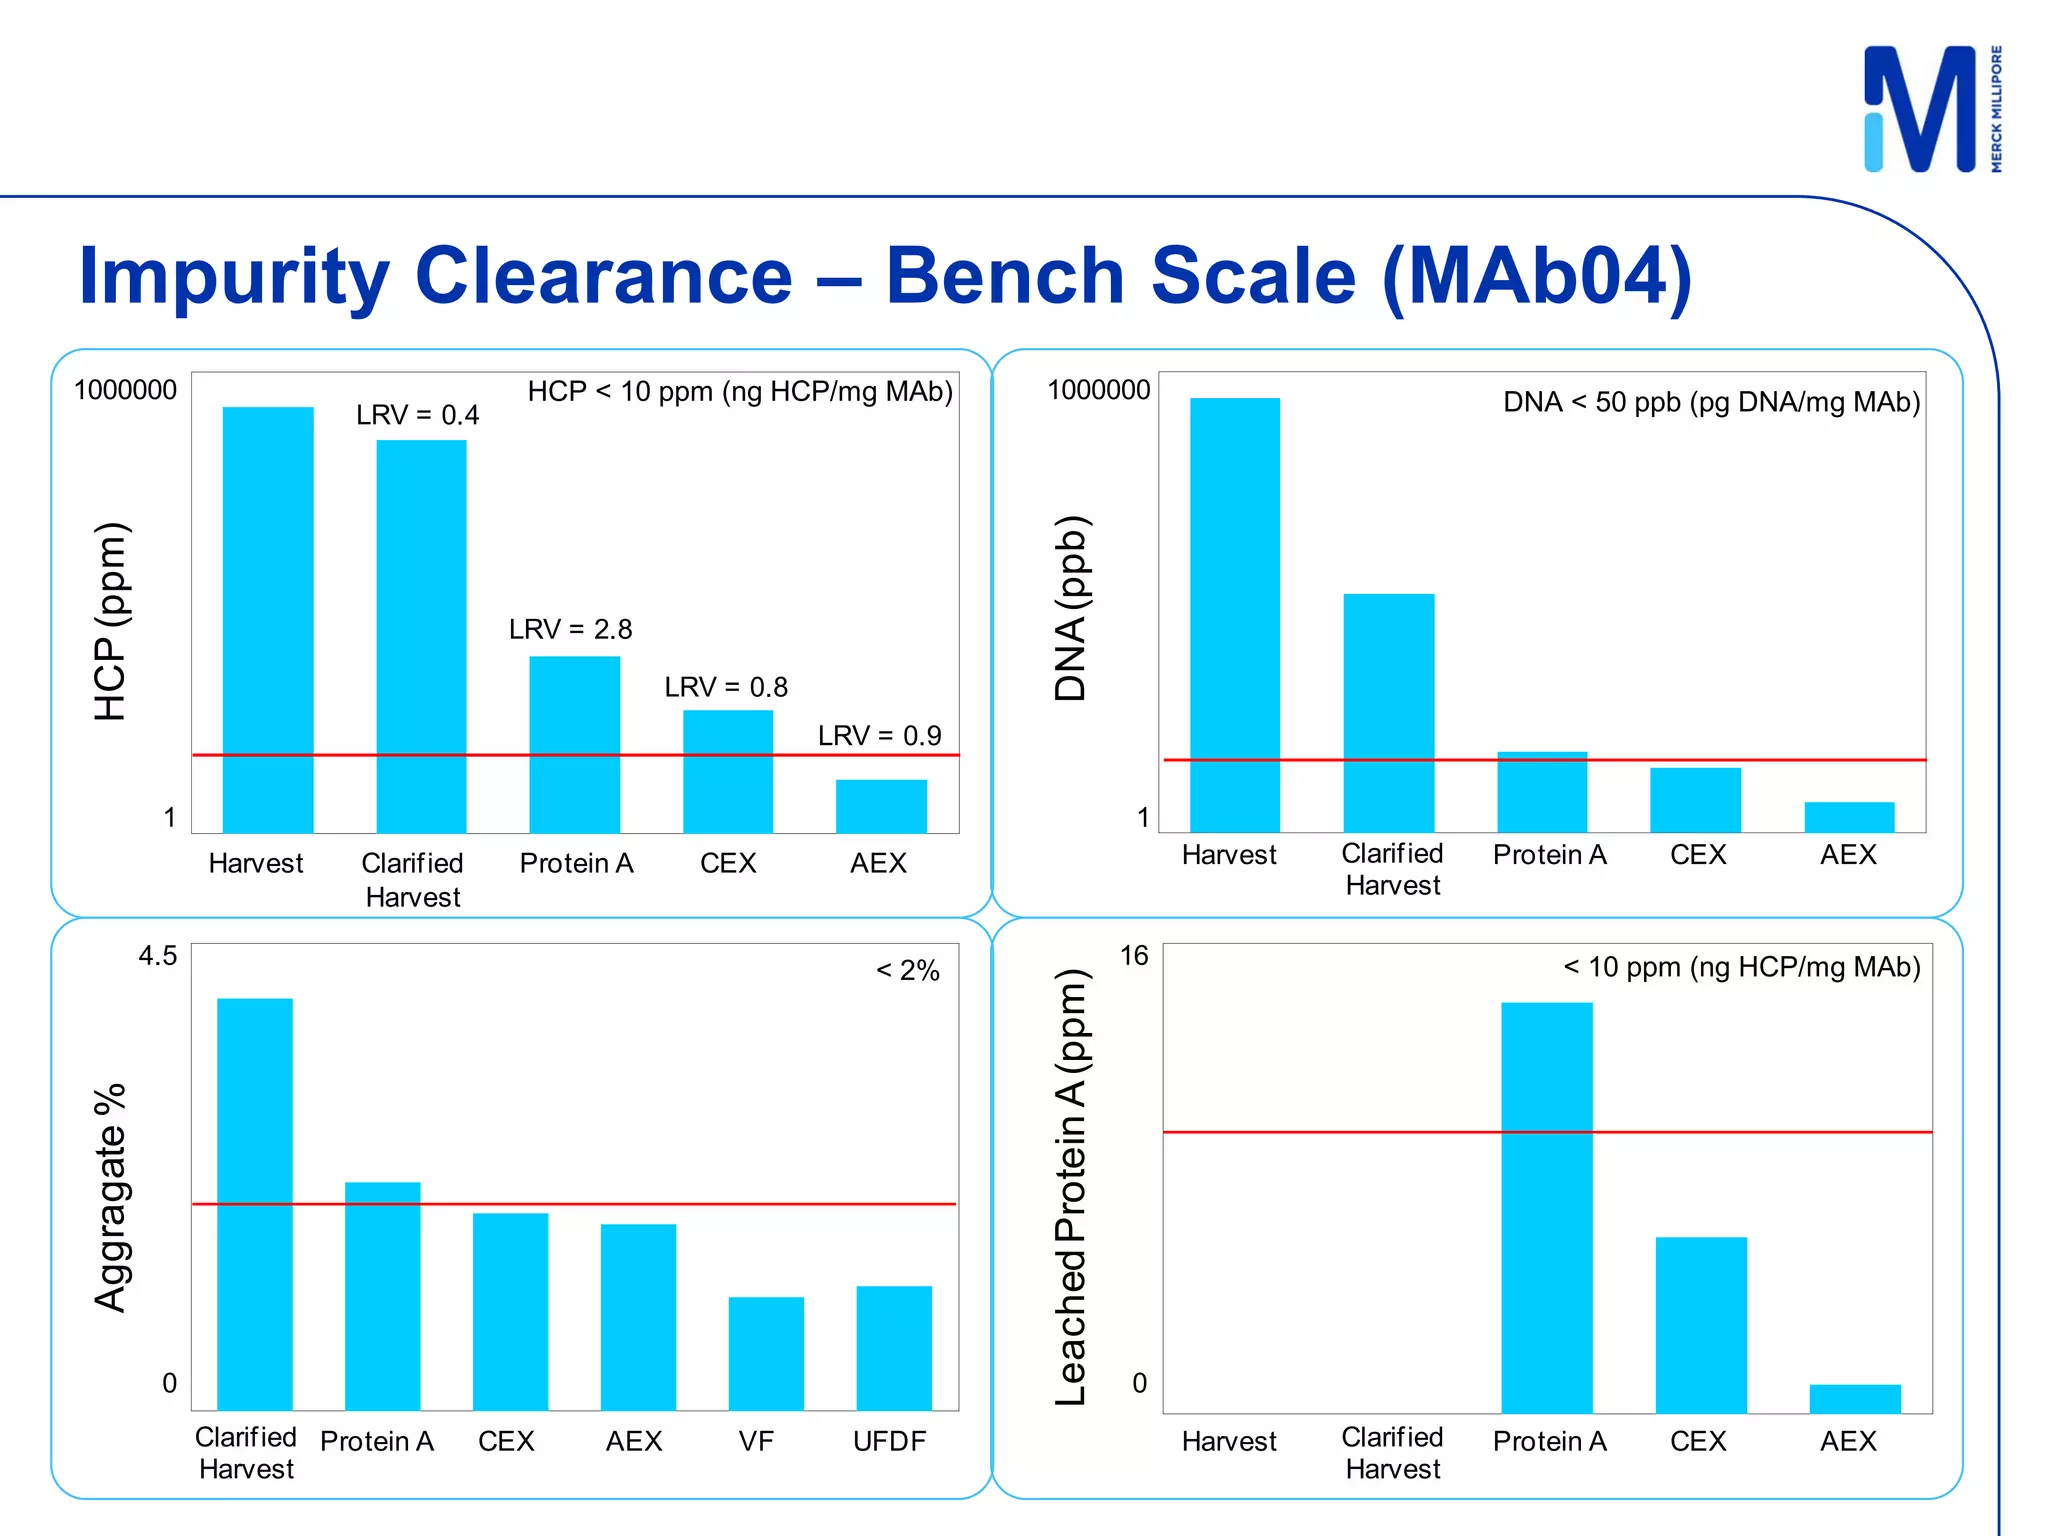
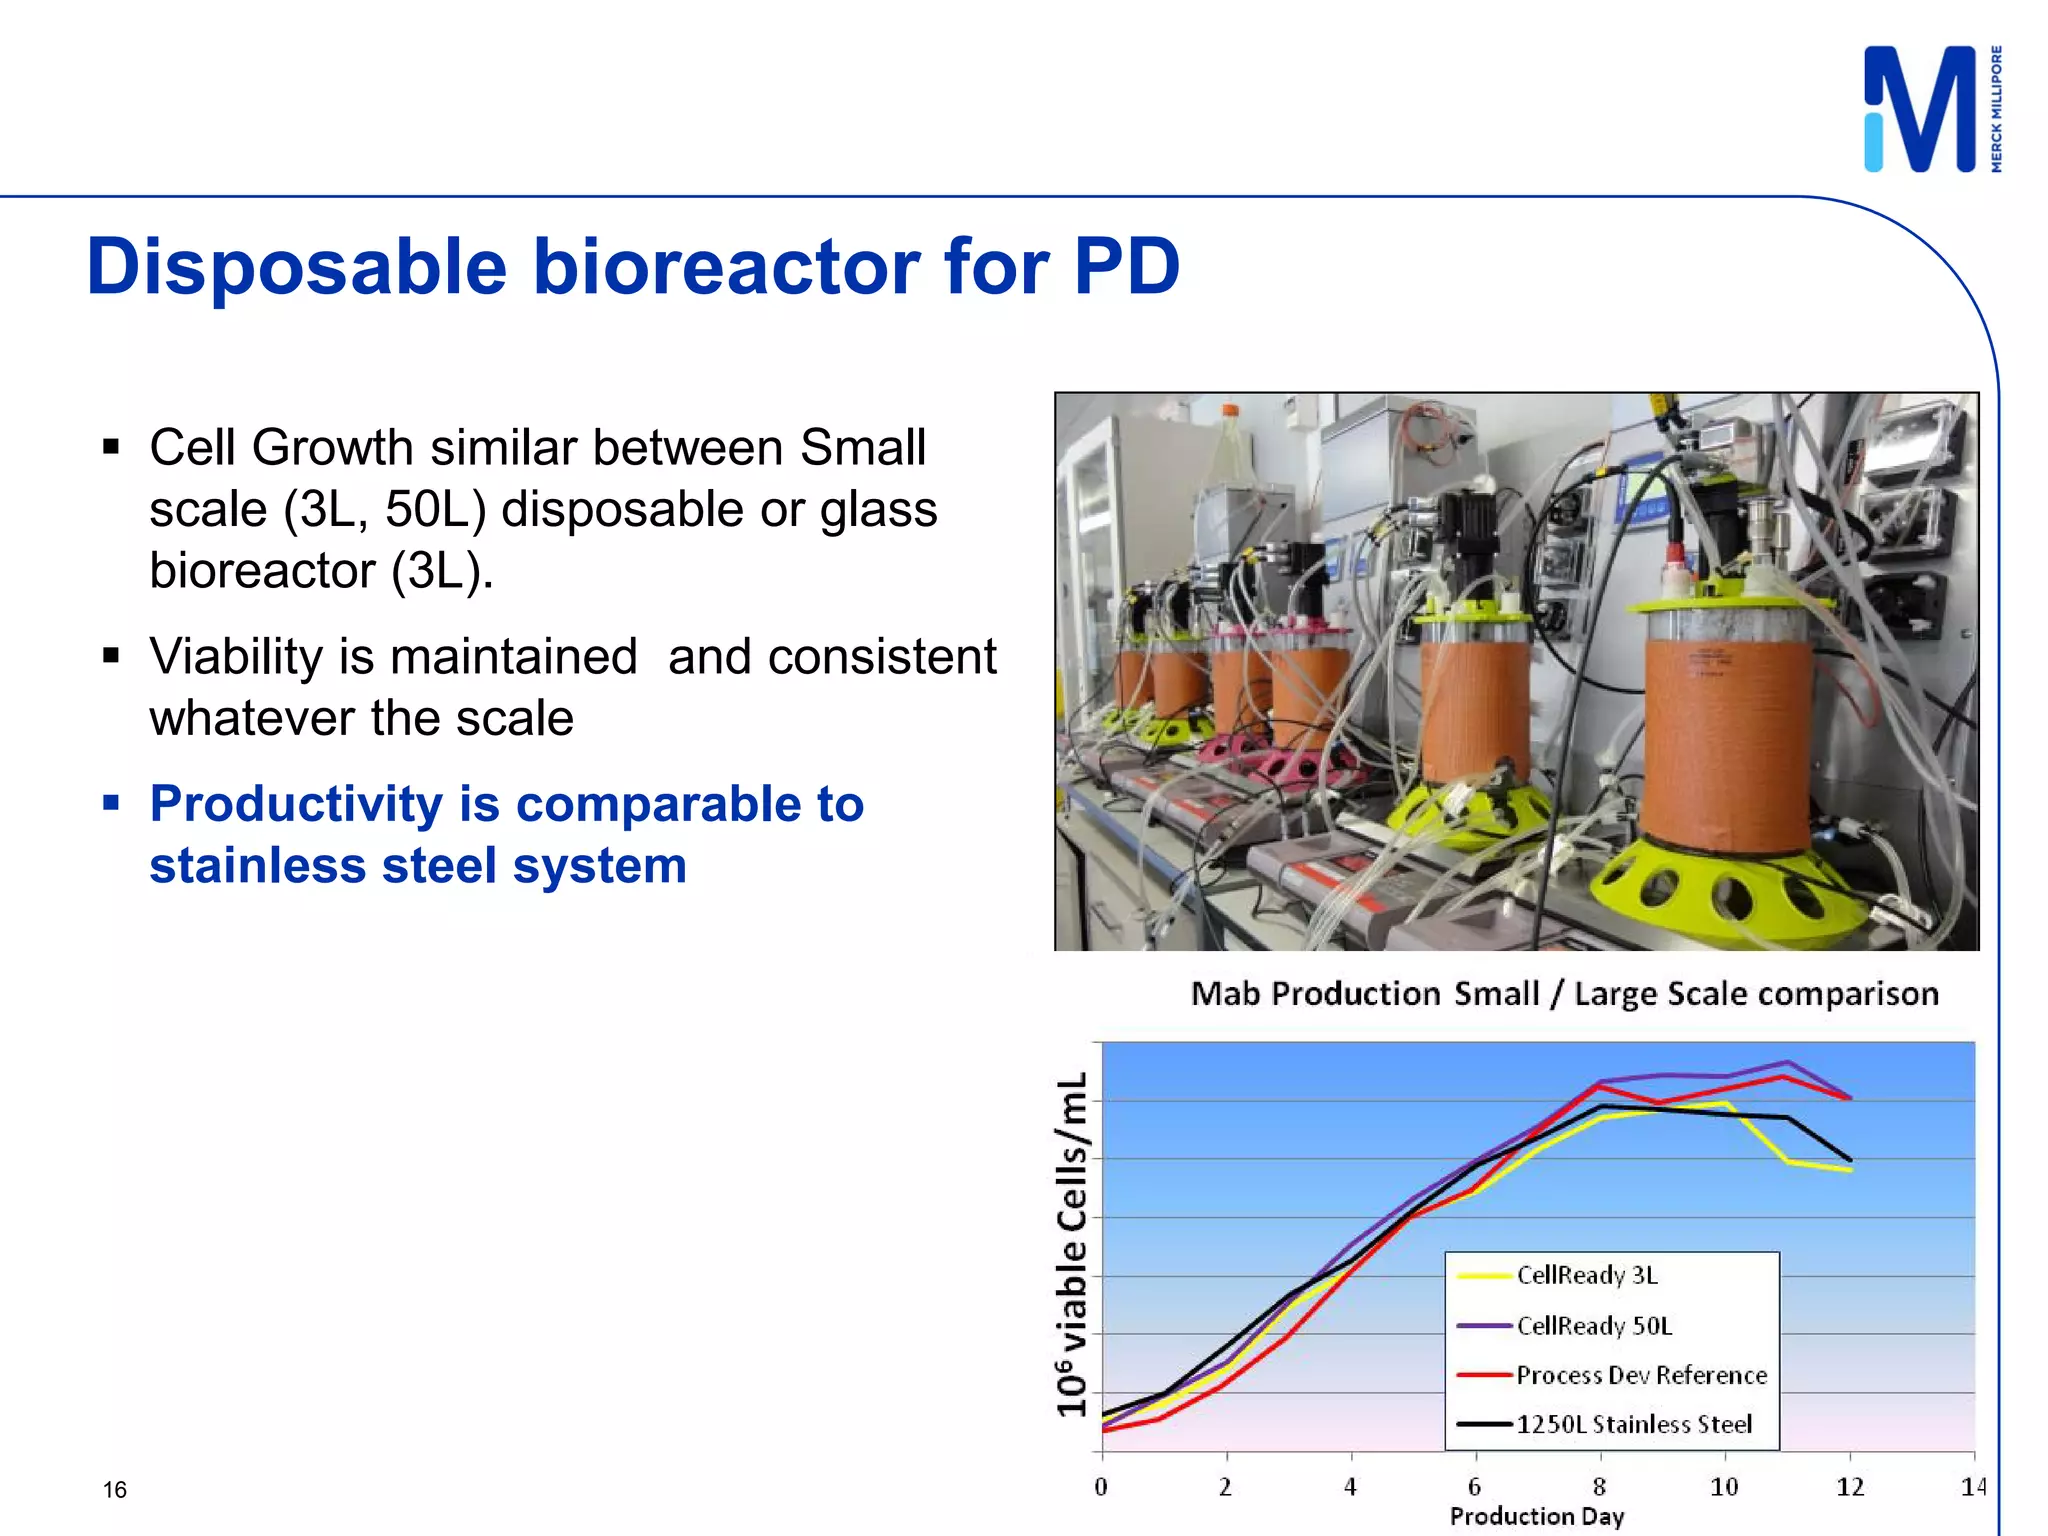
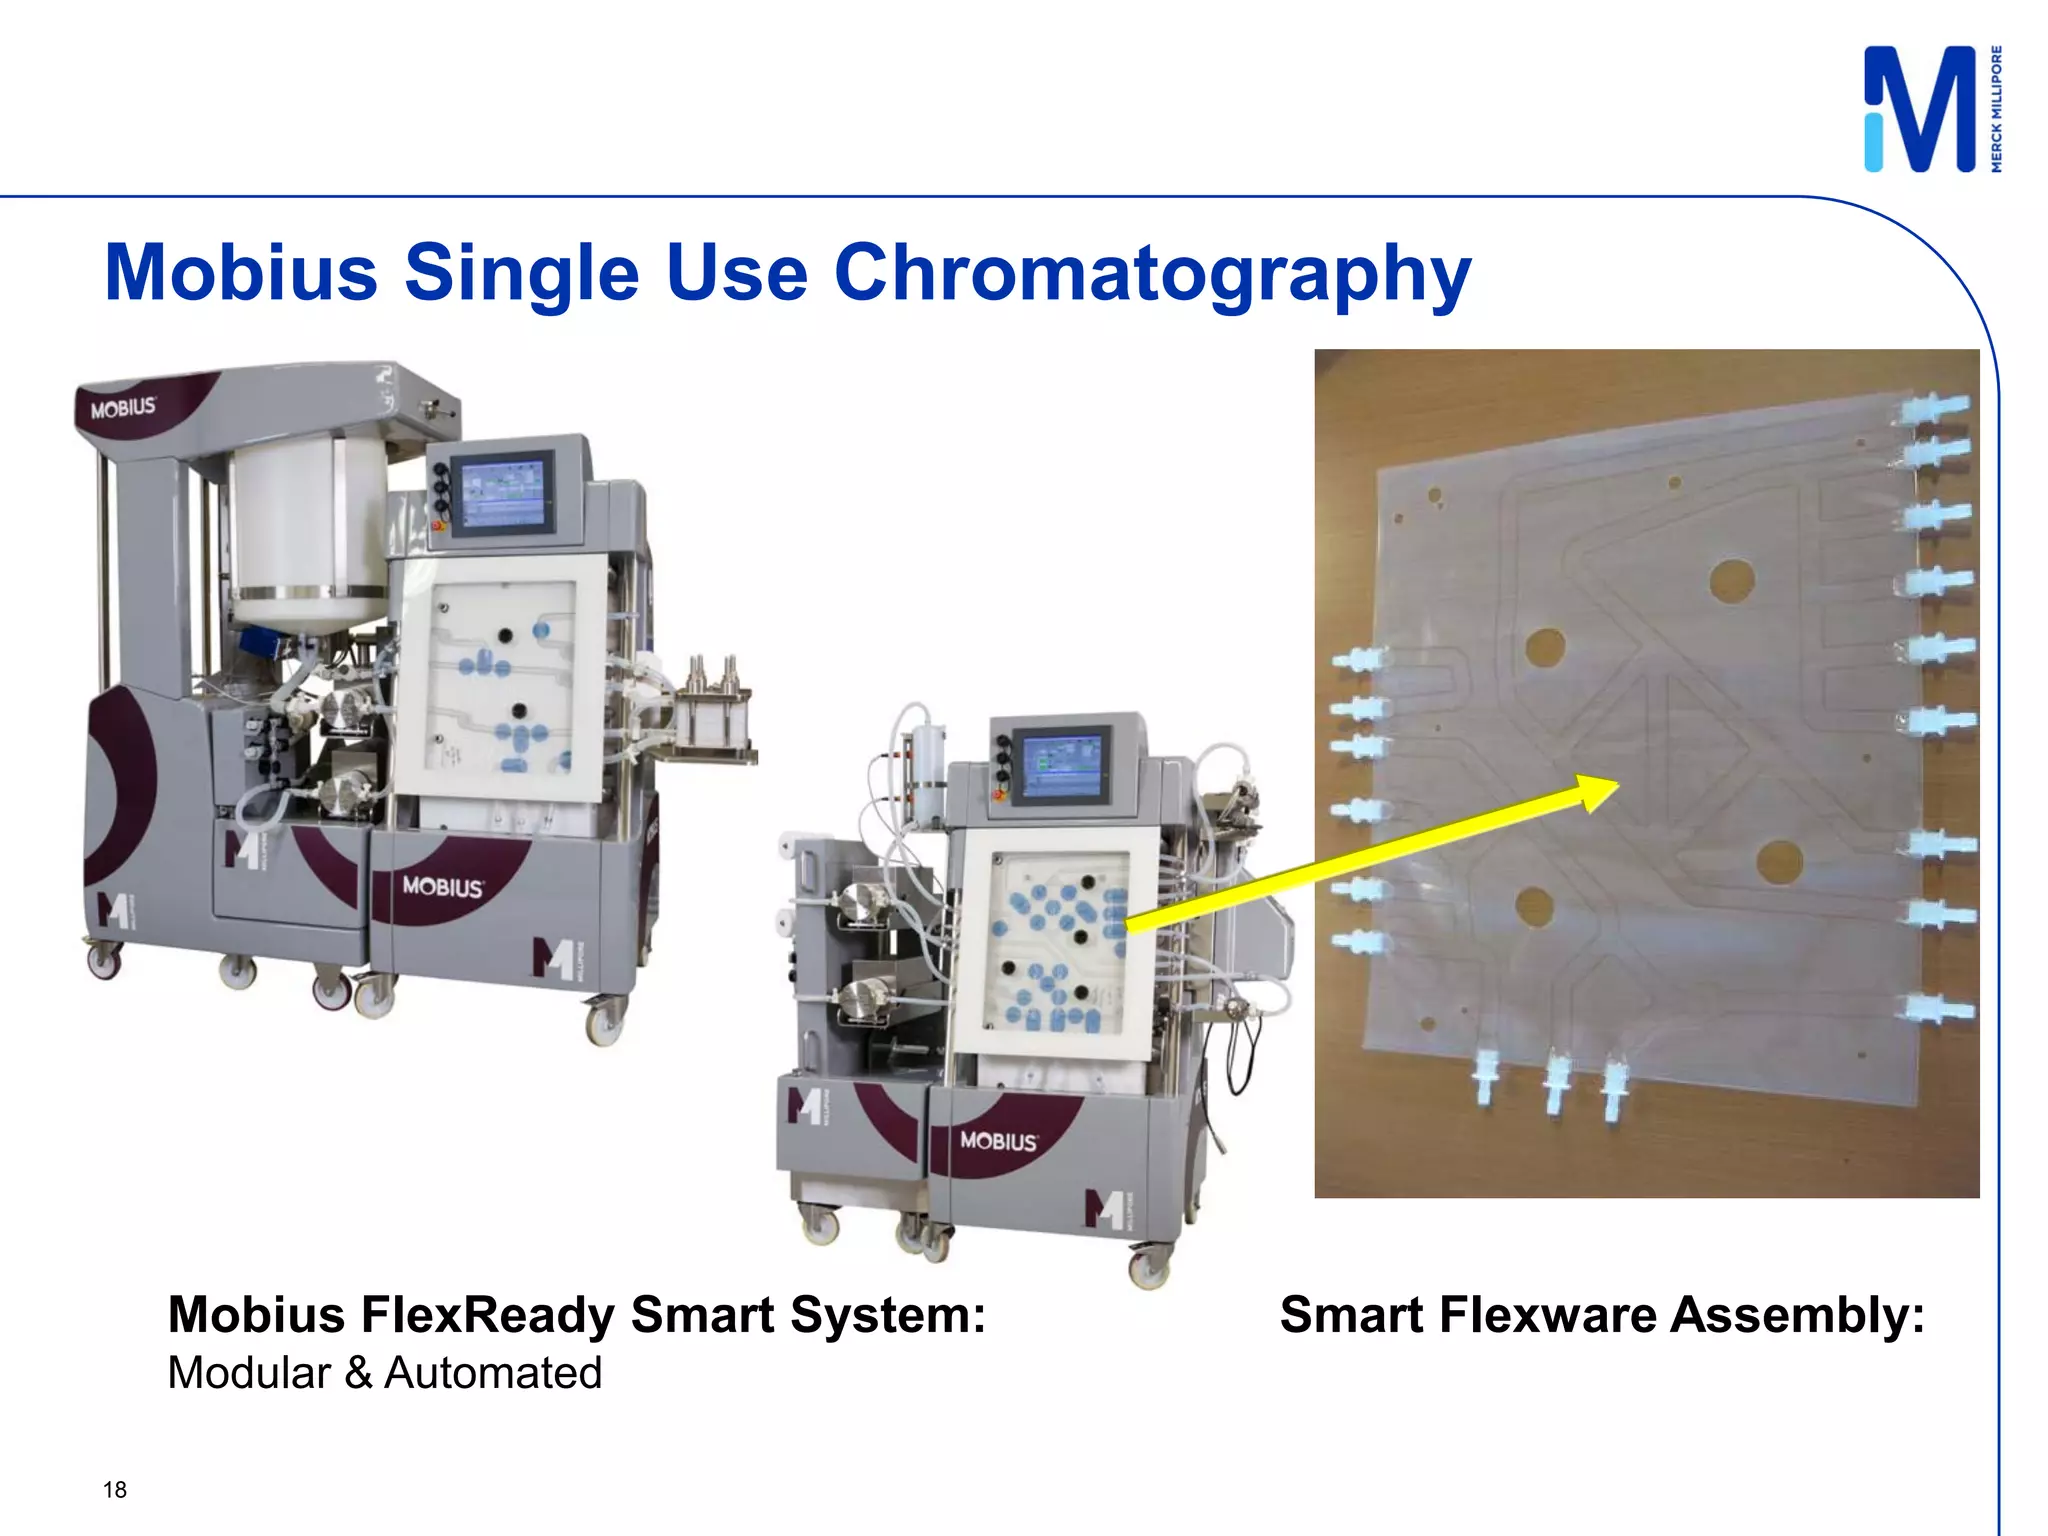
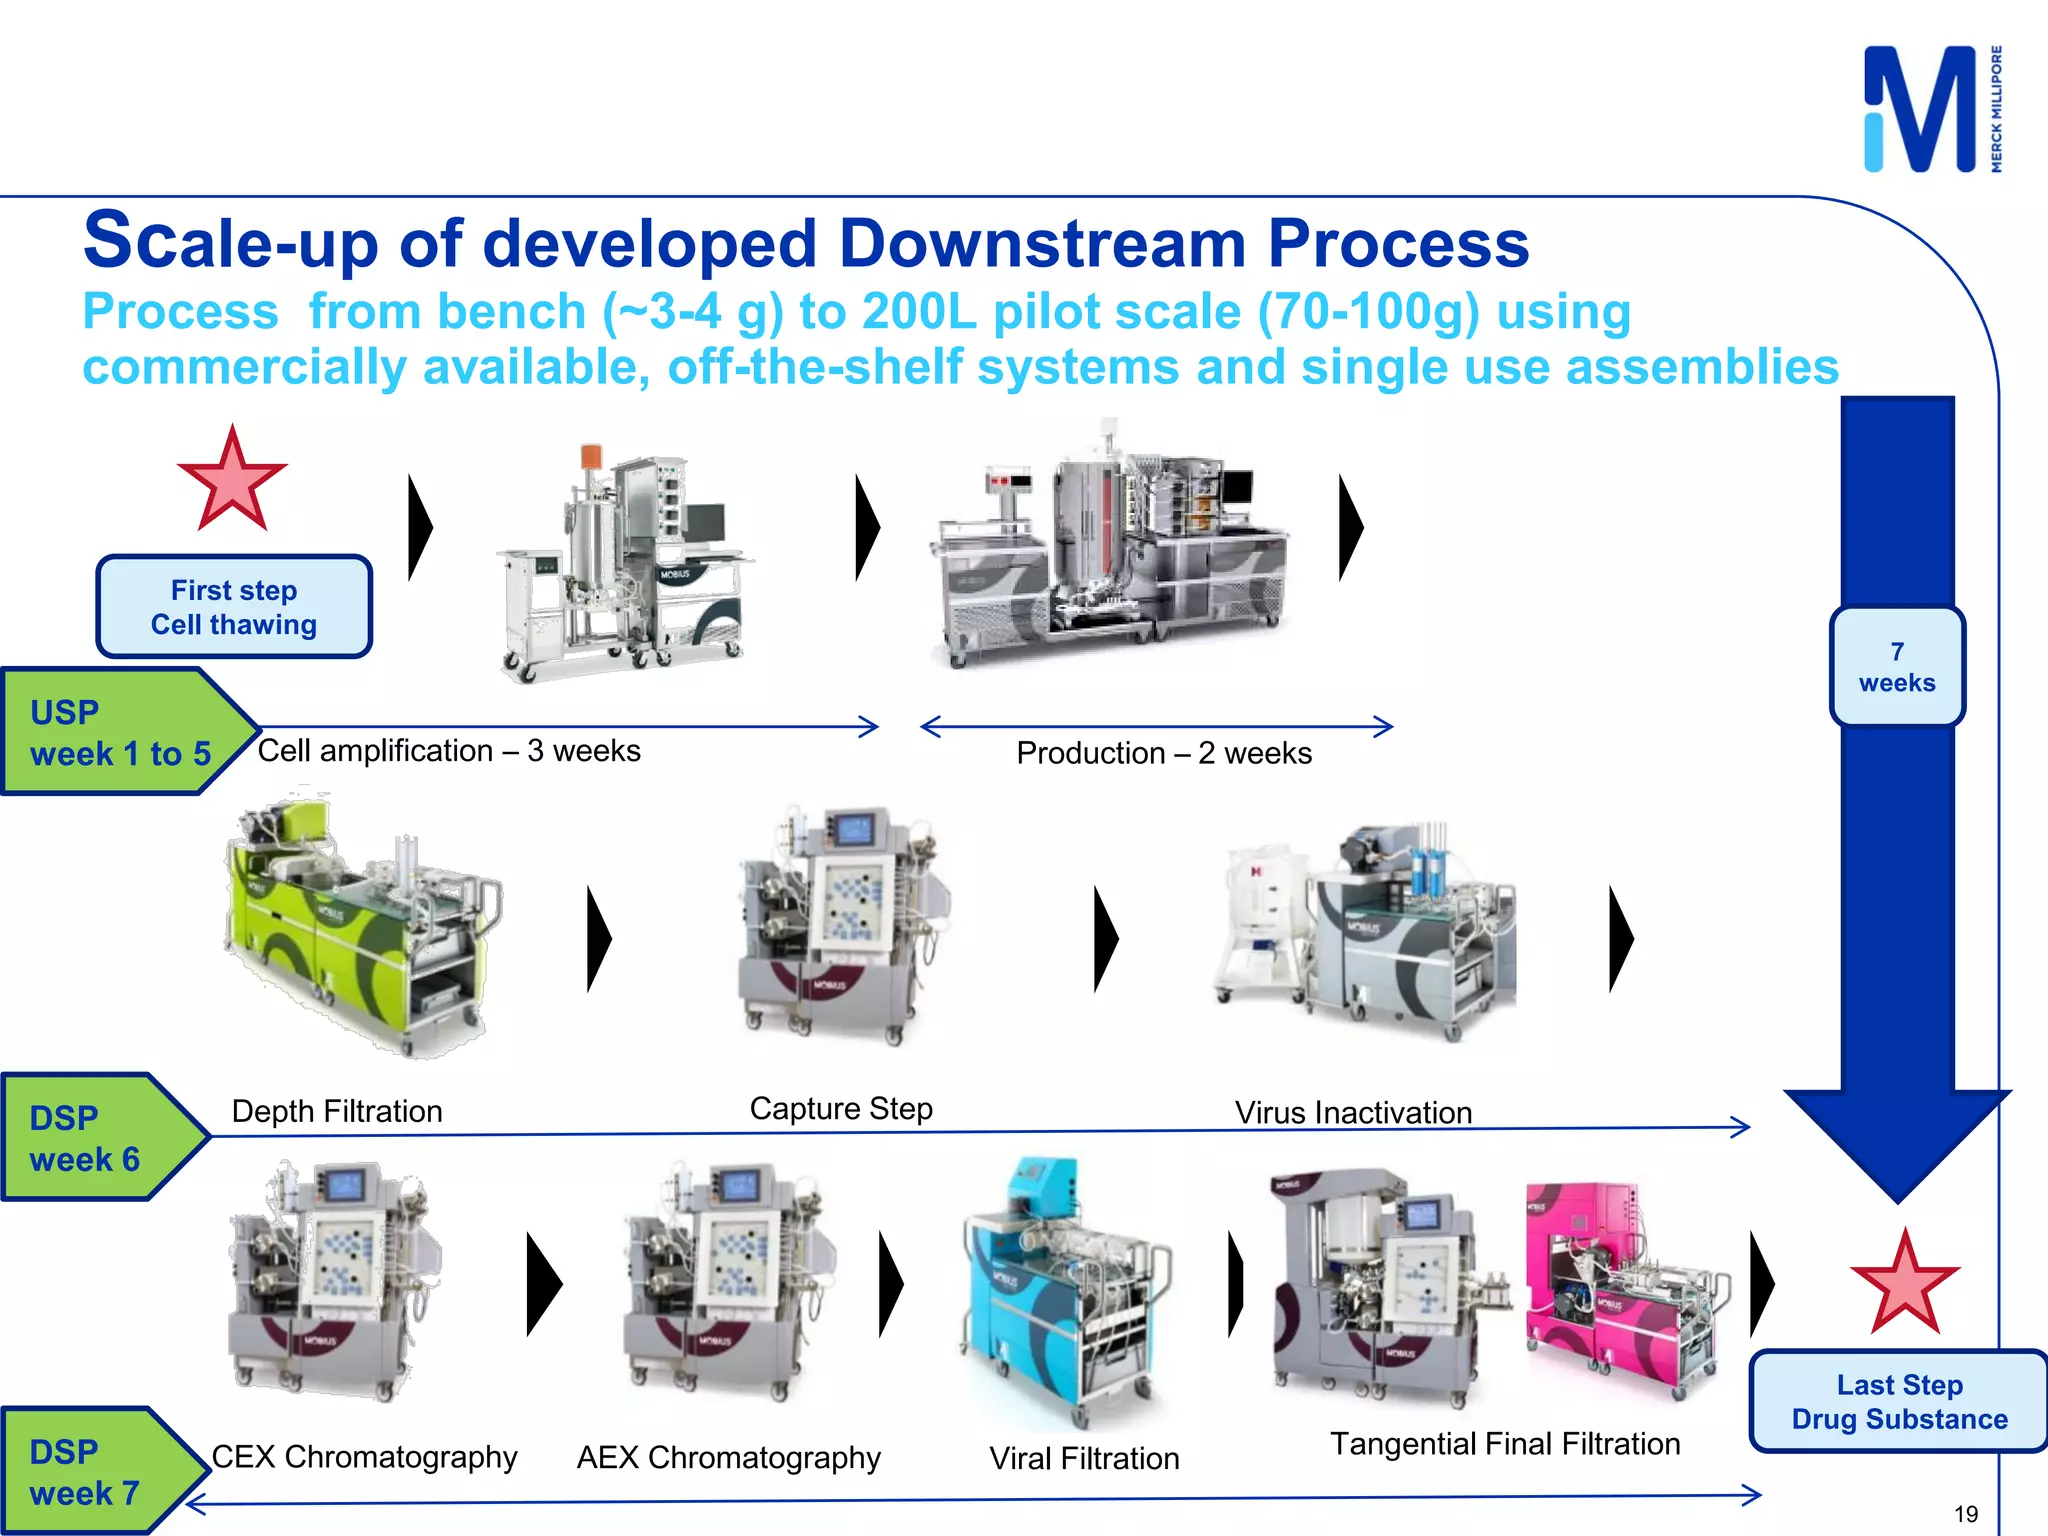
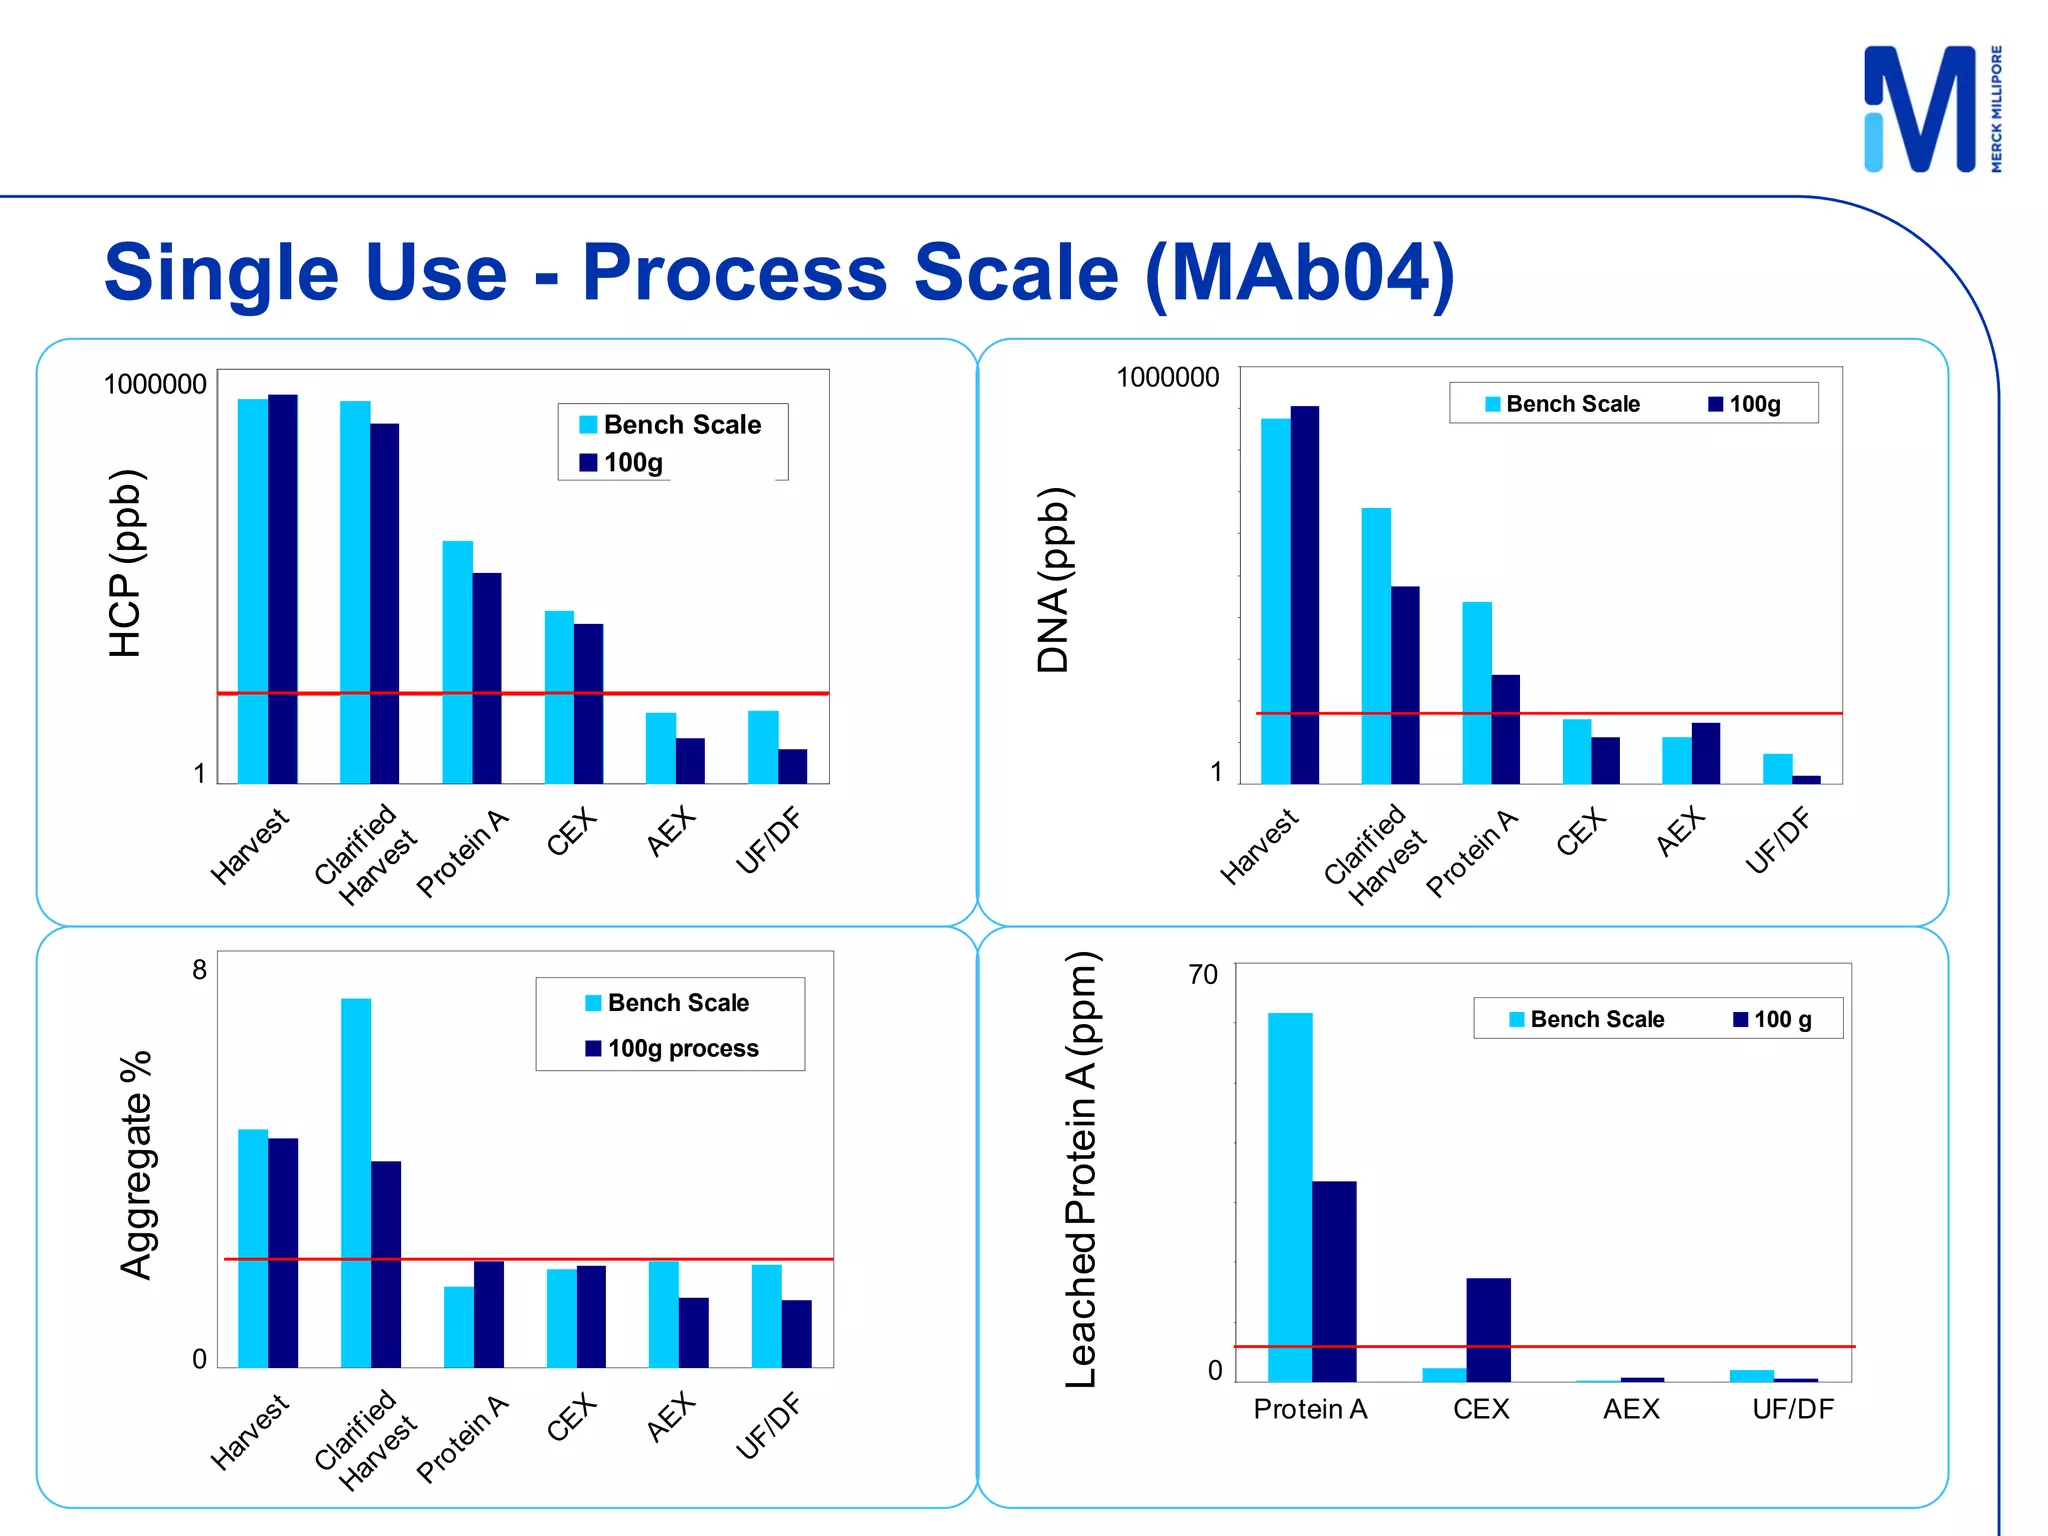
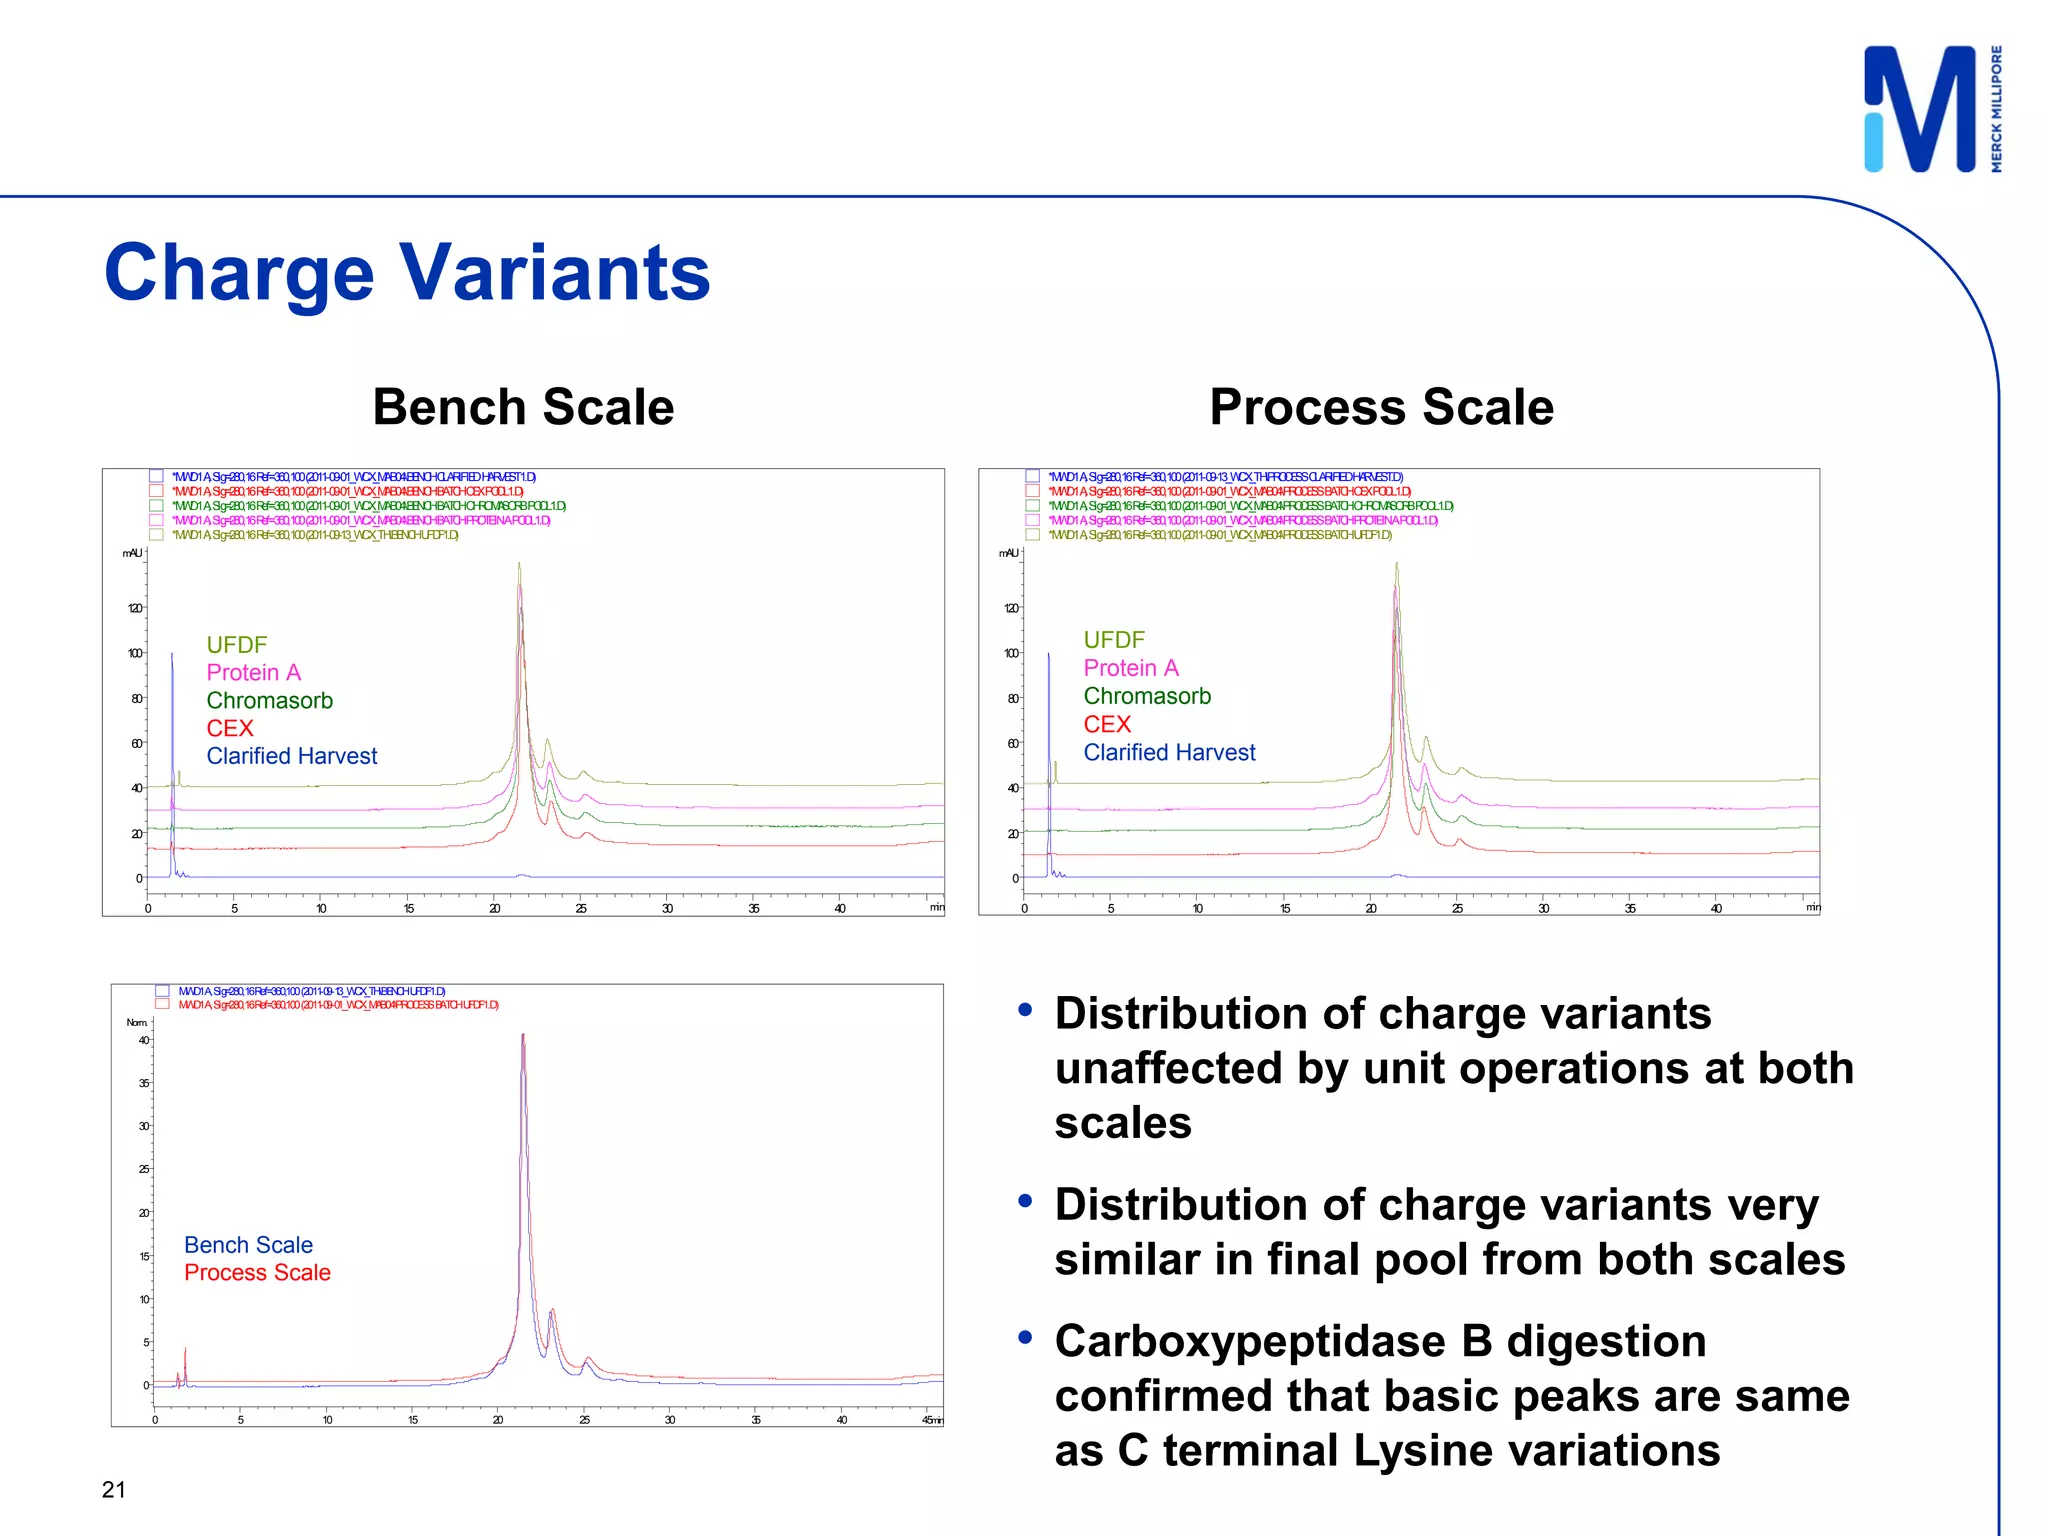
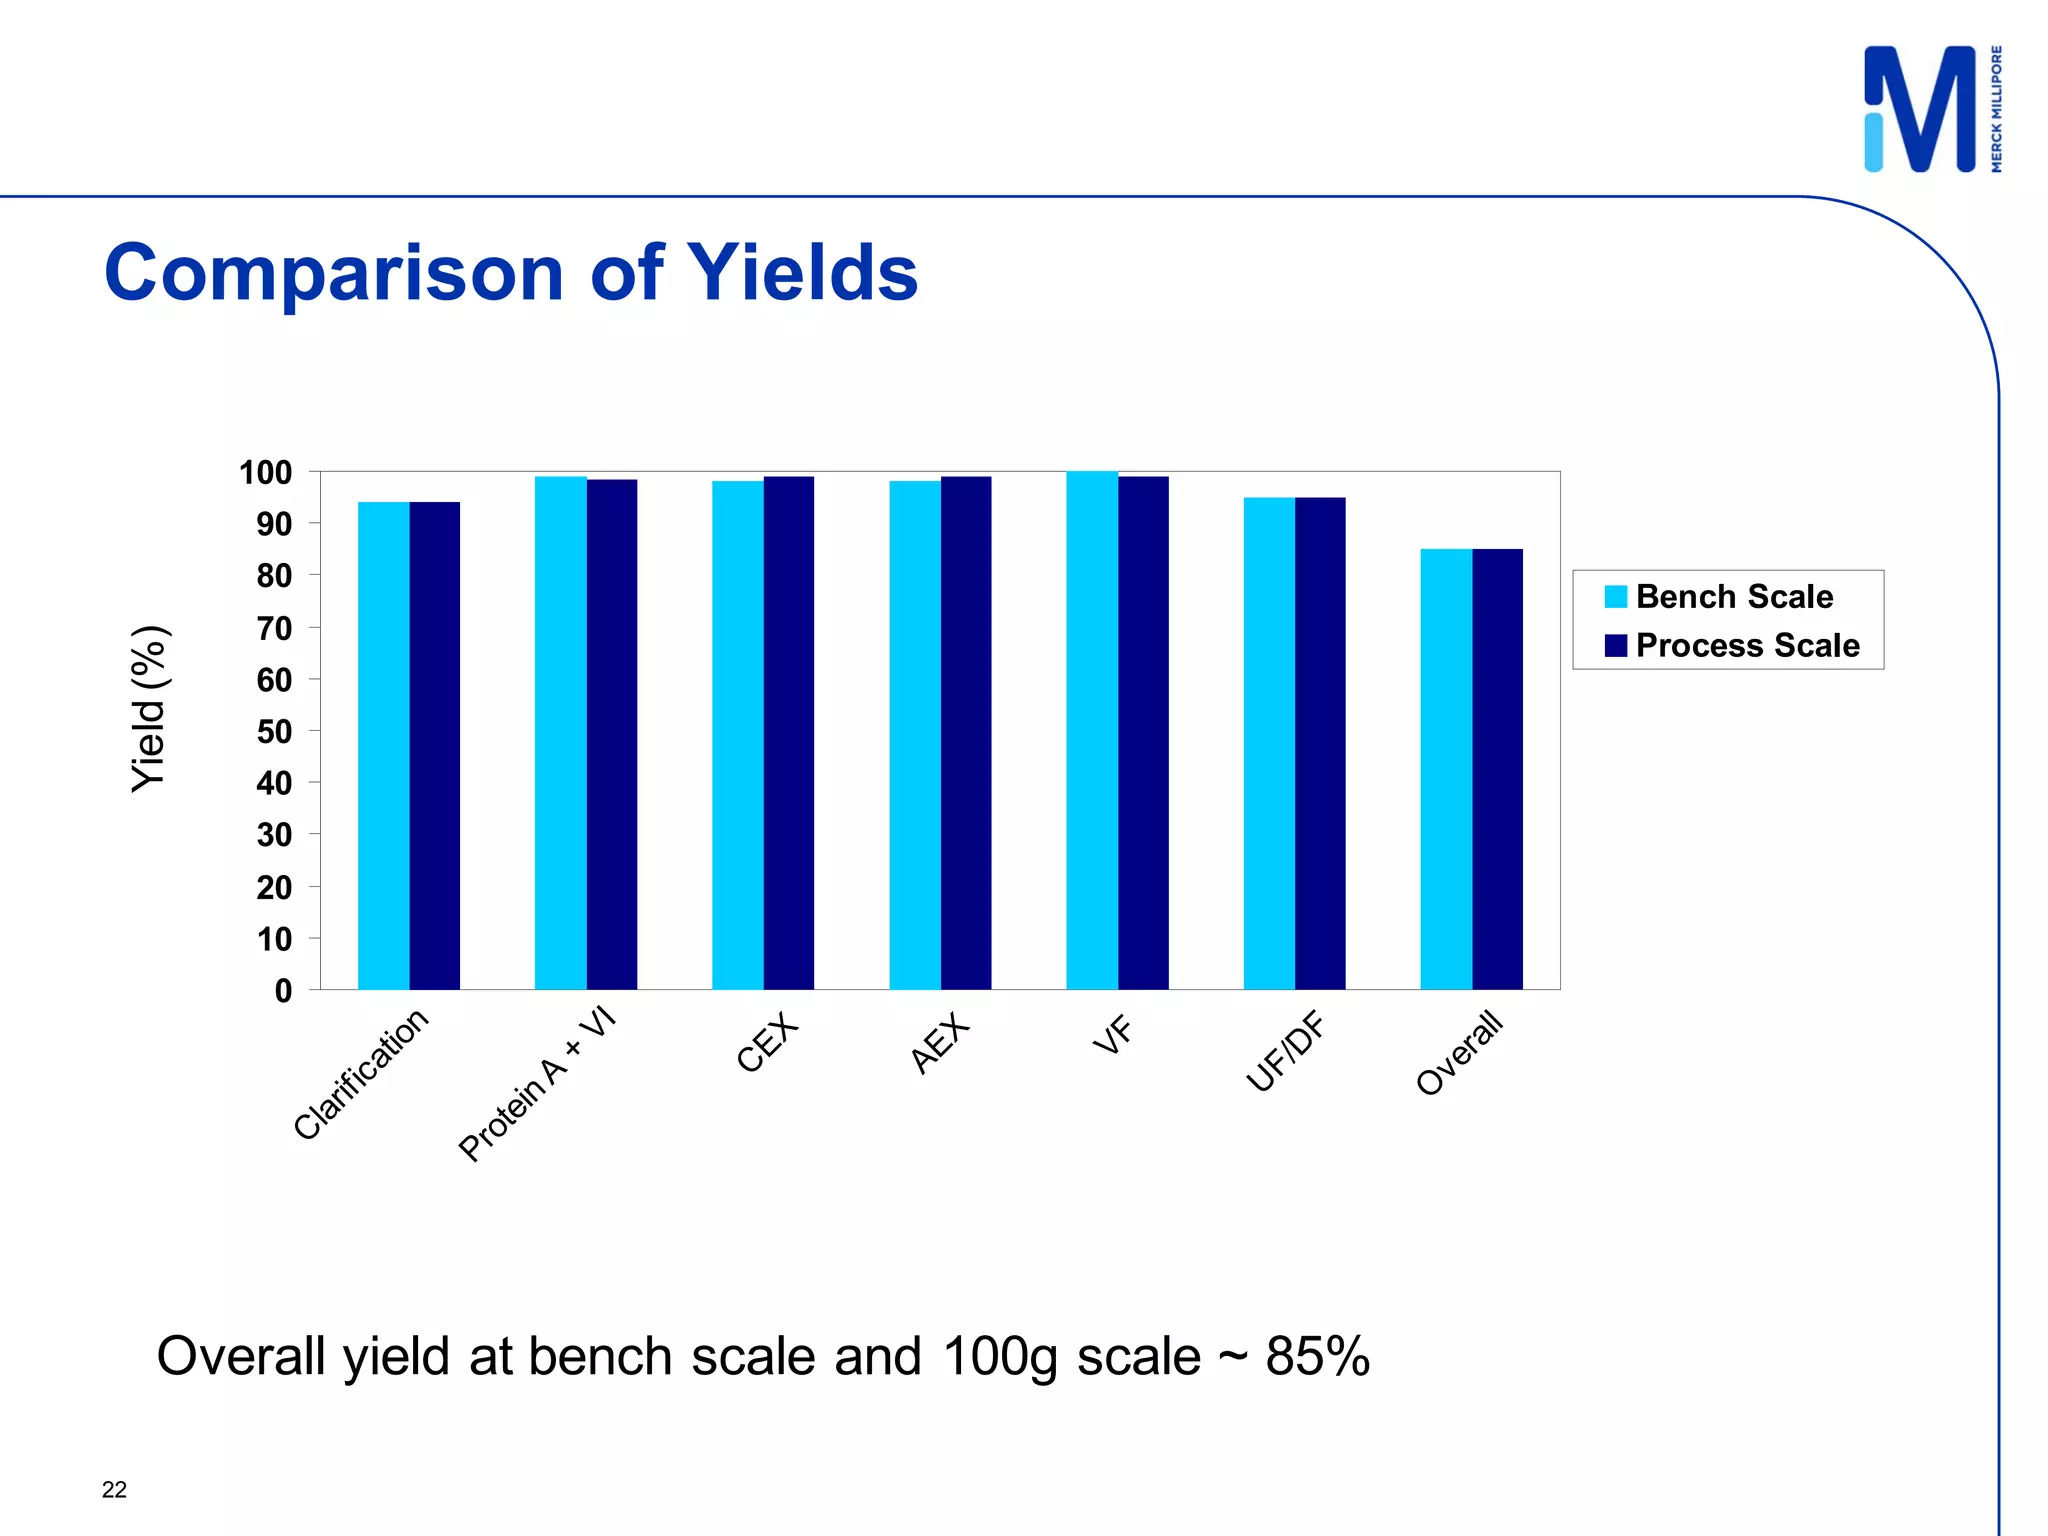
This document discusses implementing single-use technologies for a clinical drug supply pilot run. It summarizes: 1) A template process and pre-selected operating parameters were used to minimize process development work and reduce timelines. 2) A 100L pilot scale run was conducted using commercially available single-use systems and assemblies to scale up a downstream process developed at bench scale. 3) Comparison of bench and pilot scale runs showed similar impurity clearance, charge variant distribution, and overall yields, demonstrating successful scale up using single-use technologies.


![Coded Agents – with UiPath SDK + LangGraph [Virtual Hands-on Workshop]](https://cdn.slidesharecdn.com/ss_thumbnails/codedagentsdeck-251215155422-5497c599-thumbnail.jpg?width=640&height=640&fit=bounds)


