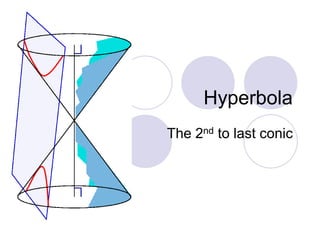
2. Hyperbola
A hyperbola can be defined as the locus of
points, or path traced out, in a plane such
that the difference of the distances from
the moving point to two fixed points
remains constant.
The two fixed points are called foci.
A hyperbola is the graph of a rational or
inverse function.
8. Inequalities
To determine if a shaded area is greater
than or less than a hyperbola function,
pick a test point.
Pick an easy point like (0,0) and determine
if the mathematical inequality remains
true.
9. Exam QuestionWhich graph corresponds to the relation
1
94
,
22
yx
yx ?
A)
(0, 3)
(0, -3)
x
y C)
(2, 0)
(-2, 0)
x
y
B)
(-2, 0) x
y
(2, 0)
D)
(0, 3)
(0, -3)
x
y
10. Exam Question
The following is a plan for the lawn of a municipal building. It is shown first as a drawing and
then mathematically in the Cartesian plane.
G G
30 m
40 m
x
y
Which one of the following inequations best defines the regions of lawn G?
A) 1
225400
22
yx
C) 1
9001600
22
yx
B) 1
225400
22
yx
D) 1
9001600
22
yx
11. Exam Question
A furniture designer created the table-leg
pattern illustrated at the right.
The curve is a hyperbola whose equation is
16x2
9y2
= 14 400
where the unit of measure is the centimetre.
The line segment AB passes through the focus F and is perpendicular to the transverse axis.
Rounded to the nearest tenth, what is height AB of the leg?
A) 96.0 cm C) 106.7 cm
B) 100.0 cm D) 133.3 cm