An ellipse is defined algebraically as the set of all points where the sum of the distances to two fixed points (the foci) is a constant. Geometrically, an ellipse can be constructed by stretching a circle: using a piece of string fixed at both ends (the foci) and tracing the path of a pencil as it is moved around so that the total length of string remains constant.
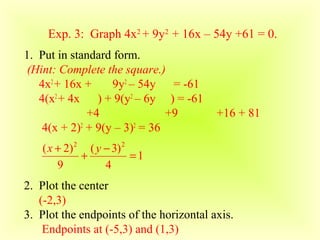
The standard equation of an ellipse is (x-h)2/a2 + (y-k)2/b2 = 1, where (h,k) is the center and a and b are the lengths of the semi-major and semi-minor axes. To graph an ellipse, one plots