Downloaded 988 times


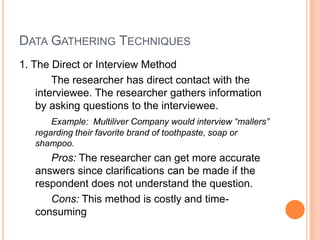
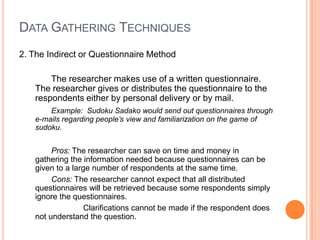
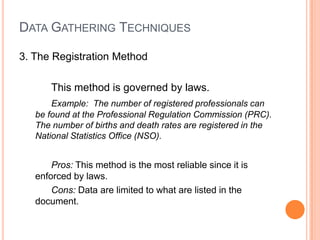
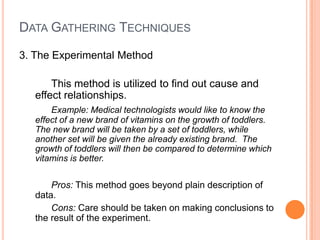
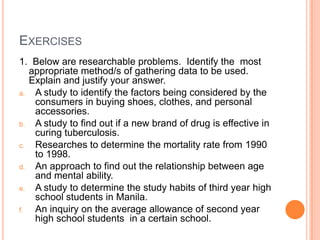

1. The document discusses different techniques for gathering data, including direct interviews, questionnaires, registration, and experiments. 2. It also provides Slovin's formula for determining sample size based on population size and margin of error. 3. Several examples are given to illustrate determining sample size using Slovin's formula for different population sizes and margins of error.