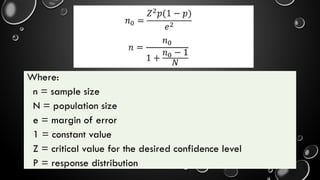
LESSON 1:
SAMPLING PROCEDURE
AND THE SAMPLE
Population and Sample
The first step in determining the sample size is
identifying the population of the topic of interest.
The population is the totality of all the objects,
elements, persons, and characteristics under
consideration. It is understood that this population
possesses common characteristics about which the
research aims to explore.
Two Types of Population
target population
accessible population
The actual population is the target
population, for example, all Senior High
School Students enrolled in Science,
Technology, Engineering, and Mathematics
(STEM) in the Division of Cavite.
While the accessible population is the
portion of the population in which the
researcher has reasonable access, for
example all Senior High School enrolled,
STEM strand at St. John Fisher School.
When the whole population is too costly or time-
consuming or impractical to consider, then, a sample
representative is identified. Sampling pertains to the
systematic process of selecting the group to be
analyzed in the research study. The goal is to get
information from a group that represents the target
population.
The representative subset of the population
refers to the sample.
All the 240 Senior High School Students enrolled
in Science, Technology, Engineering, and
Mathematics (STEM) Strand in a school, for
example, constitute the population; 60 of those
students constitute the sample.
Literature Review
Another approach is by reading similar or
related literature and studies to your current
research study. Since you are done writing your
review of related literature and studies, you
might want to recall how these studies determine
sample size. Using this approach increases the
validity of your sampling procedure.
Formulas
Formulas are also being established for the
computation of an acceptable sample size. You
can use different formulas depending on what
you know and do not know about the population.
These tools are also available online. One
formula for determining sample size that you can
follow is the Cochran’s Formula especially if you
have large sample size.
Cochran’s Formula:
Where:
n = sample size
N = population size
e = margin of error
1 = constant value
Z = critical value for the desired confidence level
P = response distribution
Probability Sampling in Quantitative Research
Simple Random Sampling - It is a way of choosing
individuals in which all members of the accessible
population are given an equal chance to be selected.
There are various ways of obtaining samples through
simple random sampling. These are fishbowl
technique, roulette wheel, or use of the table of
random numbers.
Cluster Sampling
This procedure is usually applied in large-scale
studies, geographical spread out of the population is
a challenge, and gathering information will be very
time-consuming. Cluster sampling involves grouping of
the population according to subgroups or clusters. It is
a method where multiple clusters of people from the
chosen population will be created by the researcher
in order to have homogenous characteristics.
Example:
A researcher would like to interview of all public
senior high school students across Mindanao. As a
researcher cluster will be selected to satisfy the
plan size. In the given example, the first cluster
can be by region, the second cluster can be by
division, and the third cluster can be by district.
Systematic Sampling
This procedure is as simple as selecting samples
every th (example every 2nd, 5th) of the chosen
population until arriving at a desired total number of
sample size. Therefore, the selection is based on a
predetermined interval. Dividing the population size
by the sample size, the interval will be obtained.
For example, from a total population of 75,
you have 25 samples; using systematic
sampling, you will decide to select every 3rd
person on the list of individuals.
LESSON 2:
RESEARCH INSTRUMENT,
VALIDITY AND RELIABILITY
Research Instruments
- are basic tools researchers used to gather data for
specific research problems.
 Common instruments are performance tests,
questionnaires, interviews, and observation checklist.
The first two instruments are usually used in
quantitative research, while the last two
instruments are often in qualitative research.
However, interviews and observation checklists
can still be used in quantitative research once the
information gathered is translated into numerical
data.
Difference Between
Reliability and Validity
What is RELIABILTY?
Reliability refers to the consistency of the
measures or results of the instrument.
What is VALIDITY?
A research instrument is considered valid if it
measures what it supposed to measure.
EXAMPLE:
When measuring oral communication
proficiency level of students, speech
performance using rubric, or rating scale is more
valid than students are given multiple choice
tests.
LESSON 3:
PLANNING DATA
COLLECTION PROCEDURE
Quantitative Data
Generally, data are any pieces of information
or facts that people have known. Once these
data answer the research problem, it becomes
helpful to research. When research data
appears to be measurable in the numerical form,
it is considered quantitative data.
Techniques in Collecting Quantitative Data
The following are the common quantitative data
gathering technique. Each technique corresponds
to specific instrument.
Observation
Survey
Experiment
Observation
It is gathering information about a certain
condition by using senses. The researcher records
the observation as seen and heard. This is done
by direct observation or indirect observation
using gadgets or apparatus. An observation
checklist aids the researcher in recording the
data gathered.
Survey
Data gathering is done through interview or
questionnaire. By means of questionnaire you use
series of questions or statements that respondents
will have to answer. Basically, respondents write
or choose their answer from given choices either
it is nominal or ordinal in form.
Survey
On the other hand, interview is when you ask
respondents orally to tell you the responses.
Since you are doing quantitative research, it is
expected that responses have numerical value
either it is nominal or ordinal in form.
Experiment
When your study is an experimental design, it
would use treatment or intervention. After the
chosen subjects, participants, or respondents
undergone the intervention, the effects of such
treatment will be measured.
Three Phases in Data Collection
Before
During
After
(1) before you will gather the data,
(2) what to do during the actual
gathering of data, and
(3) the things to consider after data has
been gathered.
THANK
YOU!

power point presentation for sampling lesson

  • 1.
  • 2.
    Population and Sample Thefirst step in determining the sample size is identifying the population of the topic of interest. The population is the totality of all the objects, elements, persons, and characteristics under consideration. It is understood that this population possesses common characteristics about which the research aims to explore.
  • 3.
    Two Types ofPopulation target population accessible population
  • 4.
    The actual populationis the target population, for example, all Senior High School Students enrolled in Science, Technology, Engineering, and Mathematics (STEM) in the Division of Cavite.
  • 5.
    While the accessiblepopulation is the portion of the population in which the researcher has reasonable access, for example all Senior High School enrolled, STEM strand at St. John Fisher School.
  • 6.
    When the wholepopulation is too costly or time- consuming or impractical to consider, then, a sample representative is identified. Sampling pertains to the systematic process of selecting the group to be analyzed in the research study. The goal is to get information from a group that represents the target population.
  • 7.
    The representative subsetof the population refers to the sample. All the 240 Senior High School Students enrolled in Science, Technology, Engineering, and Mathematics (STEM) Strand in a school, for example, constitute the population; 60 of those students constitute the sample.
  • 8.
    Literature Review Another approachis by reading similar or related literature and studies to your current research study. Since you are done writing your review of related literature and studies, you might want to recall how these studies determine sample size. Using this approach increases the validity of your sampling procedure.
  • 9.
    Formulas Formulas are alsobeing established for the computation of an acceptable sample size. You can use different formulas depending on what you know and do not know about the population. These tools are also available online. One formula for determining sample size that you can follow is the Cochran’s Formula especially if you have large sample size.
  • 10.
  • 11.
    Where: n = samplesize N = population size e = margin of error 1 = constant value Z = critical value for the desired confidence level P = response distribution
  • 12.
    Probability Sampling inQuantitative Research Simple Random Sampling - It is a way of choosing individuals in which all members of the accessible population are given an equal chance to be selected. There are various ways of obtaining samples through simple random sampling. These are fishbowl technique, roulette wheel, or use of the table of random numbers.
  • 13.
    Cluster Sampling This procedureis usually applied in large-scale studies, geographical spread out of the population is a challenge, and gathering information will be very time-consuming. Cluster sampling involves grouping of the population according to subgroups or clusters. It is a method where multiple clusters of people from the chosen population will be created by the researcher in order to have homogenous characteristics.
  • 14.
    Example: A researcher wouldlike to interview of all public senior high school students across Mindanao. As a researcher cluster will be selected to satisfy the plan size. In the given example, the first cluster can be by region, the second cluster can be by division, and the third cluster can be by district.
  • 15.
    Systematic Sampling This procedureis as simple as selecting samples every th (example every 2nd, 5th) of the chosen population until arriving at a desired total number of sample size. Therefore, the selection is based on a predetermined interval. Dividing the population size by the sample size, the interval will be obtained.
  • 16.
    For example, froma total population of 75, you have 25 samples; using systematic sampling, you will decide to select every 3rd person on the list of individuals.
  • 17.
  • 18.
    Research Instruments - arebasic tools researchers used to gather data for specific research problems.  Common instruments are performance tests, questionnaires, interviews, and observation checklist.
  • 19.
    The first twoinstruments are usually used in quantitative research, while the last two instruments are often in qualitative research. However, interviews and observation checklists can still be used in quantitative research once the information gathered is translated into numerical data.
  • 20.
  • 21.
    What is RELIABILTY? Reliabilityrefers to the consistency of the measures or results of the instrument.
  • 22.
    What is VALIDITY? Aresearch instrument is considered valid if it measures what it supposed to measure.
  • 23.
    EXAMPLE: When measuring oralcommunication proficiency level of students, speech performance using rubric, or rating scale is more valid than students are given multiple choice tests.
  • 24.
  • 25.
    Quantitative Data Generally, dataare any pieces of information or facts that people have known. Once these data answer the research problem, it becomes helpful to research. When research data appears to be measurable in the numerical form, it is considered quantitative data.
  • 26.
    Techniques in CollectingQuantitative Data The following are the common quantitative data gathering technique. Each technique corresponds to specific instrument. Observation Survey Experiment
  • 27.
    Observation It is gatheringinformation about a certain condition by using senses. The researcher records the observation as seen and heard. This is done by direct observation or indirect observation using gadgets or apparatus. An observation checklist aids the researcher in recording the data gathered.
  • 28.
    Survey Data gathering isdone through interview or questionnaire. By means of questionnaire you use series of questions or statements that respondents will have to answer. Basically, respondents write or choose their answer from given choices either it is nominal or ordinal in form.
  • 29.
    Survey On the otherhand, interview is when you ask respondents orally to tell you the responses. Since you are doing quantitative research, it is expected that responses have numerical value either it is nominal or ordinal in form.
  • 30.
    Experiment When your studyis an experimental design, it would use treatment or intervention. After the chosen subjects, participants, or respondents undergone the intervention, the effects of such treatment will be measured.
  • 31.
    Three Phases inData Collection Before During After
  • 32.
    (1) before youwill gather the data, (2) what to do during the actual gathering of data, and (3) the things to consider after data has been gathered.
  • 34.