Practice Test 4A Hypothesis Testing Solution
•
1 like•779 views

Practice Test 4A Hypothesis Testing Solution

Recommended
Recommended
More Related Content
What's hot
What's hot (20)
Similar to Practice Test 4A Hypothesis Testing Solution
Similar to Practice Test 4A Hypothesis Testing Solution (20)
More from Long Beach City College
More from Long Beach City College (20)
Recently uploaded
Recently uploaded (20)
Practice Test 4A Hypothesis Testing Solution
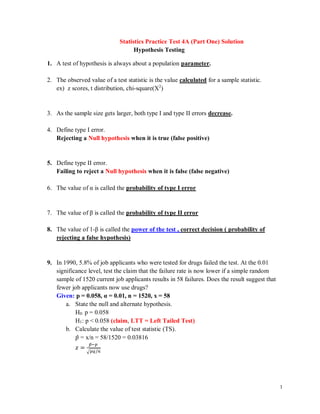
- 1. 1 1. 2. Statistics Practice Test 4A (Part One) Solution Hypothesis Testing A test of hypothesis is always about a population parameter. The observed value of a test statistic is the value calculated for a sample statistic. ex) z scores, t distribution, chi-square(X2 ) 3. As the sample size gets larger, both type I and type II errors decrease. 4. Define type I error. Rejecting a Null hypothesis when it is true (false positive) 5. Define type II error. Failing to reject a Null hypothesis when it is false (false negative) 6. The value of α is called the probability of type I error 7. The value of β is called the probability of type II error 8. The value of 1-β is called the power of the test , correct decision ( probability of rejecting a false hypothesis) 9. In 1990, 5.8% of job applicants who were tested for drugs failed the test. At the 0.01 significance level, test the claim that the failure rate is now lower if a simple random sample of 1520 current job applicants results in 58 failures. Does the result suggest that fewer job applicants now use drugs? Given: p = 0.058, α = 0.01, n = 1520, x = 58 a. State the null and alternate hypothesis. H0: p = 0.058 H1: p < 0.058 (claim, LTT = Left Tailed Test) b. Calculate the value of test statistic (TS). 𝑝̂ = x/n = 58/1520 = 0.03816 𝑧 = 𝑝̂−𝑝 √𝑝𝑞/𝑛
- 2. 2 𝒁 = 𝟎.𝟎𝟑𝟖𝟐−𝟎.𝟎𝟓𝟖 √ (𝟎.𝟎𝟓𝟖)(𝟎.𝟗𝟒𝟐) 𝟏𝟓𝟐𝟎 = − 𝟎.𝟎𝟏𝟗𝟖 𝟎.𝟎𝟎𝟓𝟗𝟗𝟓 = −𝟑. 𝟑𝟎𝟗𝟔 c. Find the critical value (CV). 𝜶 = 0.01 (Left-tailed, it’s negative) 𝒛 𝜶 = −𝒛 𝟎.𝟎𝟏 = −𝟐. 𝟑𝟑 𝒐𝒓 − 𝟐. 𝟑𝟐𝟓 d. Make a decision. (3 parts) 1. Reject H0 (because the value of test statistic is inside the rejection region) 2. Claim is true 3. There is sufficient evidence to support the claim that the failure rate among job applicants for drugs is now lower. Result suggests that fewer job applicants now use drugs. e. Find the p-value and make a decision. Is this decision in agreement with the previous one? P-value = P (z < -3.3096) = 0.0005 P-value = 0.0005 0.0005 < 𝜶 = 0.01 – reject null hypothesis this decision is in agreement with the previous one. TS: Z = -3.31 0
- 3. 3 f. What is type I error, what is the probability of making type I error? Type I error: Rejecting H0 when H0 is actually true Rejecting the claim that the failure rate of job applicants who were tested for drugs is 5.8% when the percentage is actually less than 5.8%. Probability of Type I error = = 0.01 10. A sample of 54 bears has a mean weight of 182.9 lb. Let’s assume that the standard deviation of weights of all such bears is known to be 121.8 lb, at α = 0.1. Is there enough evidence to support the claim that the population mean of all such bear weights is less than 200 lb? Given: n = 54, 𝒙̅ = 182.9 lb, σ = 121.8 lb, α = 0.1 μ = 200 lb a. State the null and alternate hypothesis. H0: μ = 200 H1: μ < 200 (claim, LTT) b. Calculate the value of test statistic. / x Z n − = Z = 𝟏𝟖𝟐.𝟗 −𝟐𝟎𝟎 𝟏𝟐𝟏.𝟖 √𝟓𝟒 = −𝟏𝟕.𝟏 𝟏𝟔.𝟓𝟕𝟒𝟖𝟖 = −𝟏. 𝟎𝟑𝟏𝟕 c. Find the critical value(s). Since α = 0.1 z = -1.285 d. Make a decision. 1. Fail to reject the null hypothesis because the value of test statistic is inside the non-rejection region.
- 4. 4 2. Claim is false. 3. There is not a sufficient evidence to support the claim that the population mean of all bear weights is less than 200 lb. 11. Sixteen new textbooks in the college bookstore, had prices with a mean of $70.41 and a standard deviation of $19.70. Use a 0.05 significance level to test the claim that the mean price of a textbook at this college is less than $75? Given: n = 16 𝒙̅ = $70.41 𝒔 = $𝟏𝟗. 𝟕𝟎 α = 0.05 μ = $75 a) H0: μ = 75 H1: μ < 75 (claim, LTT) b) TS: (Note σ is missing, T-distribution is used ) / x t s n − = 𝒕 = 𝟕𝟎. 𝟒𝟏 − 𝟕𝟓 𝟏𝟗. 𝟕𝟎 √𝟏𝟔 = − 𝟒. 𝟓𝟗 𝟒. 𝟗𝟐𝟓 = −𝟎. 𝟗𝟑𝟐𝟎 c) CV: Since α = 0.05 & df = n-1 = 15 t = -1.753 d) Decision; 1. Fail to reject the null hypothesis because the value of test statistic is inside the non- rejection region. 2. Claim is false. 3. There is not a sufficient evidence to support the claim that the mean price of a textbook at this college is less than $75.
- 5. 5 12. Tests in the author’s past statistics classes have scores with a standard deviation equal to 14.1. One of his current classes now has 27 test scores with a standard deviation of 9.3. Use a 0.01 significance level to test the claim that this current class has less variation than past classes. Does a lower standard deviation suggest that the current class is doing better? Assume the population is normal. Given: n = 27 s = 9.3 𝝈 = 𝟏𝟒. 𝟏 α = 0.01 a) H0: σ = 14.1 H1: σ < 14.1 {claim, LTT} b) TS: 𝒙 𝟐 = (𝒏 −𝟏)𝒔 𝟐 𝝈 𝟐 = (𝟐𝟕−𝟏)𝟗.𝟑 𝟐 𝟏𝟒.𝟏 𝟐 = 𝟐𝟐𝟒𝟖.𝟕𝟒 𝟏𝟗𝟖.𝟖𝟏 = 𝟏𝟏. 𝟑𝟏𝟏 c) CV: df: 26, α = 0.01 Critical Value: 𝒙 𝟐 = 𝒙 𝟏−𝜶 𝟐 = 𝒙 𝟎.𝟗𝟗 𝟐 = 12.198 d) Decision 1. Reject null hypothesis because the value of test statistic is inside the rejection region. 2. The Claim is true. 3. There is sufficient evidence to support the claim that this current class has less variation than past classes. A lower standard deviation does not suggest that the current class is doing better. It just means that the grade is more homogeneous (closer to the mean). Mean value might be different.