Correlation & Regression Sample Test
•
0 likes•79 views

1. The document discusses correlation and regression analysis. It defines the linear correlation coefficient r and how it measures the strength of a linear relationship between two variables. 2. It presents the formula for calculating r and describes how to test for a linear correlation between two variables. 3. It also defines the regression equation y=mx+b, where m is the slope and b is the y-intercept. It describes how to use a regression equation to predict values of the dependent variable y given values of the independent variable x.

Recommended
More Related Content
What's hot
What's hot (20)
Similar to Correlation & Regression Sample Test
Similar to Correlation & Regression Sample Test (20)
More from Long Beach City College
More from Long Beach City College (20)
Recently uploaded
Recently uploaded (20)
Correlation & Regression Sample Test
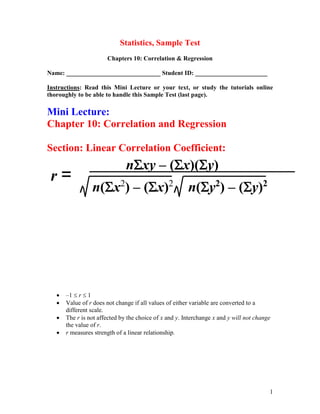
- 1. 1 Statistics, Sample Test Chapters 10: Correlation & Regression Name: ______________________________ Student ID: _______________________ Instructions: Read this Mini Lecture or your text, or study the tutorials online thoroughly to be able to handle this Sample Test (last page). Mini Lecture: Chapter 10: Correlation and Regression Section: Linear Correlation Coefficient: –1 r 1 Value of r does not change if all values of either variable are converted to a different scale. The r is not affected by the choice of x and y. Interchange x and y will not change the value of r. r measures strength of a linear relationship. nxy – (x)(y) n(x2 ) – (x)2 n(y2 ) – (y)2 r =
- 2. 2 Testing for a Linear Correlation Section: Regression
- 3. 3 Regression Equation The regression equation expresses a relationship between x (called the independent variable, predictor variable or explanatory variable, and y (called the dependent variable or response variable. The typical equation of a straight line is expressed in the form of y = mx + b, where b is the y-intercept and m is the slope. (Given a collection of paired data, the regression equation, algebraically describes the relationship between the two variables) Note: Population Parameter 0 1 y x Sample Statistic 0 1 y b b x Formulas 1 2 2 0 1 : int : , , n xy x y Slope b n x x y x Y ercept b y b x y x n n Regression Line The graph of the regression equation is called the regression line (or line of best fit, or least squares line). If there is not a significant linear correlation, the best predicted y-value is y . If there is a significant linear correlation, the best predicted y-value is found by substituting the x-value into the regression equation.
- 4. 4 Statistics, Sample Test Chapters 10: Correlation & Regression 1)Given the sample data: (the table lists the numbers of registered boats in tens of thousands) Year 1991 1992 1993 1994 1995 1996 1997 1998 1999 2000 X: Boats (Ten- thousands) 68 68 67 70 71 73 76 81 83 84 Y: Manatee Deaths 53 38 35 49 42 60 54 67 82 78 A. (Correlation) Find the value of the linear correlation coefficient r. B. (Correlation)Test the claim that there is a linear correlation between the two variables x and y. Use both (a) Method 1 and (b) Method 2. ( = 0.05) C. (Regression) Find the regression equation. D. (Regression) Assume that in 2001 there were 850,000 registered boats. Because the table lists the numbers of registered boats in tens of thousands, this means that for 2001 we have x = 85. Given that x = 85, find the best predicted value of y, the number of manatee deaths from boats. 2)Given the sample data: Data X 1 1 3 5 Y 2 8 6 4 A. (Correlation) Find the value of the linear correlation coefficient r. B. (Correlation) Test the claim that there is a linear correlation between the two variables x and y. Use both (a) Method 1 and (b) Method 2. ( = 0.05) C. (Regression) Find the regression equation. D. (Regression) Find the best predicted value of y, when x is equal to 2. +++++++++++++++++++++++++++++++++++++++++++++++++++++
- 5. 5 Statistics, Sample Test Chapters 10: Correlation & Regression Name: ______________________________ Student ID: _______________________ Instructions: Read this Mini Lecture or your text, or study the tutorials online thoroughly to be able to handle this Sample Test (last page). Mini Lecture: Chapter 10: Correlation and Regression Section: Linear Correlation Coefficient: 2 2 2 2 n xy x y r n x x n y y –1 r 1 Value of r does not change if all values of either variable are converted to a different scale. The r is not affected by the choice of x and y. Interchange x and y will not change the value of r. r measures strength of a linear relationship. Testing for a Linear Correlation
- 6. 6 Section: Regression Regression Equation The regression equation expresses a relationship between x (called the independent variable, predictor variable or explanatory variable, and y (called the dependent variable or response variable.
- 7. 7 The typical equation of a straight line is expressed in the form of y = mx + b, where b is the y-intercept and m is the slope. (Given a collection of paired data, the regression equation, algebraically describes the relationship between the two variables) Note: Population Parameter: 0 1 y x Sample Statistic: Formulas 1 2 2 0 1 : int : , , n xy x y Slope b n x x y x Y ercept b y b x y x n n Regression Line The graph of the regression equation is called the regression line (or line of best fit, or least squares line). If there is not a significant linear correlation, the best predicted y-value is y . If there is a significant linear correlation, the best predicted y-value is found by substituting the x-value into the regression equation. Statistics, Sample Test Chapters 10: Correlation & Regression 3) Given the sample data: (the table lists the numbers of registered boats in tens of thousands) Year 1991 1992 1993 1994 1995 1996 1997 1998 1999 2000 X: Boats (Ten- thousands) 68 68 67 70 71 73 76 81 83 84 Y: Manatee Deaths 53 38 35 49 42 60 54 67 82 78 A. (Correlation) Find the value of the linear correlation coefficient r.
- 8. 8 B. (Correlation)Test the claim that there is a linear correlation between the two variables x and y. Use both (a) Method 1 and (b) Method 2. ( = 0.05) C. (Regression) Find the regression equation. D. (Regression) Assume that in 2001 there were 850,000 registered boats. Because the table lists the numbers of registered boats in tens of thousands, this means that for 2001 we have x = 85. Given that x = 85, find the best predicted value of y, the number of manatee deaths from boats. 4) Given the sample data: Data X 1 1 3 5 Y 2 8 6 4 A. (Correlation) Find the value of the linear correlation coefficient r. B. (Correlation) Test the claim that there is a linear correlation between the two variables x and y. Use both (a) Method 1 and (b) Method 2. ( = 0.05) C. (Regression) Find the regression equation. D. (Regression) Find the best predicted value of y, when x is equal to 2.